
DCE-310 · Lesson 2 of 12 · 32 min
Load estimation and capacity planning
Every decision in the electrical design of a data centre, from the size of the utility service in Lesson 1 to the rating of a single rack circuit, starts from an estimate of load. Estimate too low and the facility runs out of power before it is full; estimate too high and millions of dollars of transformers, switchgear and generators sit idle for years, and the utility reserves capacity that could have served someone else. This lesson explains how data centre loads are built up from the IT equipment to the utility meter, why nameplate ratings mislead, how diversity, redundancy and growth enter the calculation, and how the arrival of AI training clusters has changed both the size and the behaviour of the load.
From the server to the meter
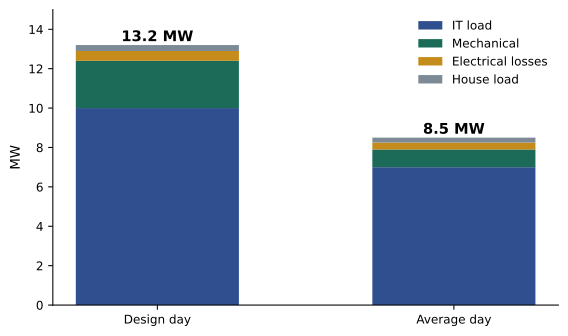
The load at the utility meter is built up in layers:
- IT load: servers, storage and network equipment. This is the load the facility exists to serve, and it is usually the "critical load" that is protected by UPS.
- Mechanical load: chillers, pumps, cooling units, fans and cooling towers. It depends on the IT load, the cooling design and the weather.
- Electrical losses: UPS, transformer and distribution losses, typically 5% to 10% of the IT load in older designs and less in modern ones.
- House load: lighting, offices, security, building management, fire systems, heating of generator engines and battery rooms.
The ratio of total facility power to IT power is the power usage effectiveness (PUE, DCE-200). For electrical design, what matters is the peak PUE on the hottest design day, not the annual average, because the electrical system must carry the worst case.
Worked problem
Building the facility load
A data centre is designed for 10 MW of IT load. On the design day the mechanical load is 24% of IT load, electrical losses are 5% and house loads total 0.3 MW. What is the peak facility demand, the design PUE, and the apparent power at a power factor of 0.95?
Show solution
- Mechanical: \(0.24 \times 10 = 2.4\) MW. Losses: \(0.05 \times 10 = 0.5\) MW.
- Total: \(10 + 2.4 + 0.5 + 0.3 = 13.2\) MW.
- Design PUE: \(13.2/10 = 1.32\).
- Apparent power: \(13.2/0.95 = 13.9\) MVA.
Answer: A peak demand of 13.2 MW (13.9 MVA) and a design PUE of 1.32. The annual PUE of the same site might be 1.2 or lower, but the utility service, transformers and generators must be sized from the peak.
Nameplate, measured and design load
Every server carries a nameplate power rating, usually the rating of its power supply. Real equipment almost never draws that much: a server with a 1,100 W power supply may draw 300 W idle and 650 W at full load. Summing nameplate ratings therefore overstates the load, sometimes by a factor of two, and leads to oversized and underused infrastructure.
Better estimates come from:
- Measured power of the actual equipment running representative workloads, from vendor power calculators or tests.
- Measurements from existing facilities running the same kind of workload.
- The power budget per rack agreed with the IT team or the tenant, which then becomes a contractual limit enforced by the rack circuits.
Worked problem
Nameplate versus reality
A hall will hold 2,000 servers with 1,100 W nameplate power supplies. Measured power at full load is 650 W per server, and the IT team expects the hall to run at no more than 80% of that on average, with peaks at full load. What load should the electrical design use, and how does it compare with the nameplate sum?
Show solution
- Nameplate sum: \(2{,}000 \times 1.1 = 2.2\) MW.
- Measured full-load peak: \(2{,}000 \times 0.65 = 1.3\) MW.
- Average: \(0.8 \times 1.3 = 1.04\) MW.
Answer: Design for the measured peak of 1.3 MW (with a margin agreed with the IT team), not the 2.2 MW nameplate sum, which would oversize the electrical system by about 70%. The average of 1.04 MW matters for energy cost and cooling, not for sizing.
Diversity and demand factors
Not every load peaks at the same moment. The diversity factor is the sum of the individual peak loads divided by the peak of the combined load; its inverse, the coincidence factor, is the fraction of the summed peaks that occurs at once. Electrical codes use demand factors for many building loads, allowing feeders to be sized below the connected load.
In traditional enterprise and colocation data centres, diversity is significant: different tenants and applications peak at different times, and few racks reach their allocated power. Measured coincident peaks of 60% to 80% of the allocated rack power are common. Designers can use this to place more racks behind a given amount of upstream capacity, a practice called oversubscription, but they must then monitor the load and have a plan for what happens if it grows (Lesson 10).
AI training clusters are different. Thousands of accelerators work on one job in lockstep, so they reach peak power together: the coincidence factor approaches 1, and the diversity that once allowed oversubscription disappears.
Worked problem
Oversubscribing a power block
A colocation hall has a 2 MW UPS block. Tenants have contracted 2.5 MW of rack power in total. Measured history shows the coincident peak of such halls is 72% of contracted power. (a) What is the expected peak? (b) What is the margin? (c) What happens if a new AI tenant replaces 0.5 MW of the contracted conventional load with AI racks that peak at 100% of contract?
Show solution
- (a) \(0.72 \times 2.5 = 1.80\) MW.
- (b) Margin: \(2.0 - 1.80 = 0.20\) MW, 10% of the block.
- (c) New peak: \(0.72 \times 2.0 + 1.00 \times 0.5 = 1.44 + 0.50 = 1.94\) MW; margin 0.06 MW, 3%.
Answer: The oversubscribed block runs with a 10% margin, which shrinks to 3% when the AI tenant arrives, too little for safe operation. Operators of mixed halls track contracted, allocated and measured power separately and stop oversubscribing blocks that host synchronized loads.
Redundancy and usable capacity
Redundancy changes the relationship between installed and usable capacity. In a 2N design each path must carry the whole load, so each is loaded to at most 50% in normal operation; in a distributed redundant design with \(N\) blocks sized so that any \(N-1\) can carry the load, each block is loaded to at most \((N-1)/N\); in N+1 designs the usable capacity is that of \(N\) units. These architectures are covered in DCE-340; for load planning the key quantity is usable critical capacity, the IT load the facility can support with its redundancy intact.
| Architecture | Installed UPS capacity | Usable critical capacity | Normal loading per module |
|---|---|---|---|
| 2N, 2 × 2 MW | 4 MW | 2 MW | ≤ 50% |
| Distributed redundant 4-to-make-3, 4 × 2 MW | 8 MW | 6 MW | ≤ 75% |
| Block redundant 5 + 1 reserve, 6 × 2 MW | 12 MW | 10 MW | ≤ 100% (active), reserve idle |
Growth and phasing
Data centres are rarely filled on day one. A campus may be built in phases of 10 MW to 100 MW over several years, and each hall fills over months as customers move in. Electrical infrastructure is therefore designed for the full build-out, with the long-lead and hard-to-expand parts (the utility service, substation space, main duct banks, generator yard) sized for the ultimate load, while modular parts (UPS modules, PDUs, generators) are added as the load arrives. The plan must keep redundancy intact at every intermediate stage, not just at the end.
Worked problem
A phased ramp
A 48 MW IT campus is built in four 12 MW phases, one every nine months. Each phase fills linearly over the twelve months after it opens. When does the IT load first exceed 30 MW, and what IT load must phase 1's utility service already be able to supply?
Show solution
- Phases open at months 0, 9, 18 and 27; each adds 1 MW per month for 12 months.
- Month 18: phase 1 full (12), phase 2 at 9 months (9), phase 3 at 0: 21 MW.
- Month 24: phase 1 (12), phase 2 full (12), phase 3 at 6 months (6): 30 MW. It exceeds 30 MW just after month 24.
- The utility service and substation are normally built for the full 48 MW IT (plus mechanical load) from the start, or with a firm commitment and space for expansion, because utility upgrades can take years.
Answer: The IT load passes 30 MW about two years after opening. The utility service is planned for the full campus from the first phase, which is why interconnection requests are made for the ultimate load (DCE-420), while UPS and generator modules are added phase by phase.
How AI changes the load
AI clusters change data centre load in three ways that matter to electrical engineers:
- Density: racks of 100 kW or more concentrate load into fewer, heavier circuits, busways and cooling units (Lesson 5).
- Coincidence: synchronized accelerators remove diversity, so design load approaches the sum of rack peaks.
- Dynamics: during training, accelerators alternate between computation and communication phases many times a second to every few seconds, and a whole cluster may drop from full power to a fraction of it at once when a job stops or checkpoints. Swings of tens of megawatts within a second are possible on the largest campuses.
Rapid swings stress generators and UPS systems, which must respond to large load steps, and can disturb the grid: utilities and grid operators such as NERC have raised concerns about large loads that change quickly or disconnect suddenly. In July 2024, a voltage disturbance in northern Virginia caused about 1,500 MW of data centre load to transfer to backup power at once, an event NERC studied as a warning of what large, sensitive loads can do to grid stability. Mitigations include energy storage that smooths the load seen by the grid, software that smooths power draw at the accelerators, and coordination with the utility on ride-through settings (Lesson 8).
Worked problem
A synchronized load step
A 60 MW AI training cluster drops to 35% of its power within 200 ms when a job pauses for a checkpoint, and returns to full power 20 seconds later. What load step does the facility see, and what rate of change?
Show solution
- Step: \(60 \times (1 - 0.35) = 39\) MW.
- Rate: \(39/0.2 = 195\) MW/s.
Answer: A 39 MW drop at about 195 MW per second, repeated when the job resumes. Generators on a campus running on backup power would struggle to follow such steps, and grid operators may require the campus to limit its ramp rate. Battery energy storage at the facility can absorb and supply the difference so that the grid sees a smoother profile.
Documenting the load
The results of load estimation are recorded in a load schedule (a table of every load with its rating, design demand and the panel or bus that feeds it) and summarized in the design basis, which states the design IT load per hall and per rack, redundancy, design-day conditions, PUE, growth plan and margins. These documents drive the sizing of everything that follows and are updated as the design develops (Lesson 12).
The Canadian Electrical Code permits demand factors for some loads and requires feeders and services to be sized for the calculated load; utility connection requests to provincial utilities such as Hydro-Québec and Hydro One, or through the Alberta Electric System Operator (AESO) in Alberta, are made on the basis of the design load and its ramp.
Common mistakes
MistakeSumming nameplate ratings to size the electrical system.
InsteadUse measured or vendor-calculated power at full load, with agreed margins.
MistakeSizing from annual average PUE.
InsteadUse the design-day peak mechanical load.
MistakeApplying enterprise diversity to AI clusters.
InsteadSynchronized accelerators have a coincidence factor near 1.
MistakeChecking redundancy only at full build-out.
InsteadVerify usable capacity and redundancy at every phase.
MistakeIgnoring load dynamics.
InsteadAssess load steps and ramp rates for generators, UPS and the grid.
Summary and key terms
- Facility load = IT + mechanical + electrical losses + house load, sized for the design-day peak.
- Nameplate ratings overstate IT load; use measured power.
- Diversity allows oversubscription in conventional halls but disappears in AI clusters.
- Usable critical capacity depends on the redundancy architecture.
- Long-lead infrastructure is built for the ultimate load; modular parts follow the ramp.
- AI loads are dense, coincident and fast-changing, affecting generators, UPS and the grid.
- Load schedules and the design basis record the results.
- Critical load
- The IT load protected by UPS.
- Design day
- The hottest expected conditions used to size mechanical and electrical systems.
- Nameplate rating
- The maximum rating marked on equipment, usually far above its real draw.
- Diversity factor
- The sum of individual peaks divided by the combined peak.
- Coincidence factor
- The fraction of individual peaks that occurs at the same time.
- Oversubscription
- Allocating more load than the upstream capacity, relying on diversity.
- Usable critical capacity
- The IT load supportable with redundancy intact.
- Phasing
- Building and filling a facility in stages.
- Load schedule
- A table of loads, their demands and their sources.
- Design basis
- The document that records the key design assumptions and criteria.
Practice problems
Work each problem on paper first, then reveal the answer to check.
IT 5 MW, mechanical 1.5 MW, losses 0.3 MW, house 0.2 MW. Facility load and PUE?
Show answer
7.0 MW; 1.40.
That load at power factor 0.96. Apparent power?
Show answer
7.29 MVA.
500 servers, 800 W nameplate, 480 W measured peak. Design load versus nameplate sum?
Show answer
240 kW versus 400 kW.
Individual peaks sum to 3 MW; combined peak is 2.4 MW. Diversity factor?
Show answer
1.25.
Why is AI training load coincident?
Show answer
Accelerators work on one job in lockstep and peak together.
Usable capacity of a 3-to-make-2 distributed design with 1.5 MW modules?
Show answer
3 MW.
Maximum normal loading per module in 3-to-make-2?
Show answer
About 67%.
A 20 MW cluster falls to 40% in 0.5 s. Step and rate?
Show answer
12 MW at 24 MW/s.
What is built for the ultimate load from the first phase?
Show answer
Long-lead items such as the utility service, substation space and main duct banks.
What document records rack density, redundancy and design-day conditions?
Show answer
The design basis.
Lesson quiz · 5 questions
Score 60% or more to complete this lesson.
Create a free account to save your progress, take quizzes and earn a certificate.