
DCE-210 · Lesson 2 of 12 · 38 min
Transport, performance and quality of service
Lesson 1 described how frames and packets are built and addressed. This lesson asks a different question: how fast does the network actually feel to the applications that use it? A link may be rated at 100 Gb/s, yet a single file transfer across it crawls along at a few hundred megabits per second, or a web page that depends on a hundred servers takes ten times longer than any one of them. The answers lie in latency, in the transport protocols that pace traffic, in what happens when many senders converge on one receiver, and in how the network decides which packets go first.
These topics matter to facility engineers as well as network engineers. The distance between buildings, the choice of switches, the placement of storage and the layout of a campus all show up as latency and throughput that customers notice.
Where the time goes: the parts of latency
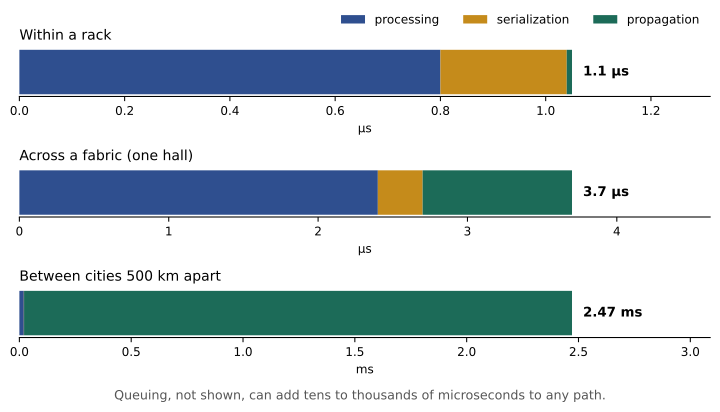
The latency of a packet is the time from when its first bit leaves the sender until its last bit reaches the receiver. It has four parts:
- Serialization delay: the time to put the bits on the wire, equal to the packet size divided by the link rate. A 1500-byte packet takes 1.2 µs at 10 Gb/s and 0.12 µs at 100 Gb/s.
- Propagation delay: the time for the signal to travel the distance. Light in optical fibre travels at about two thirds of its speed in a vacuum, roughly 204,000 km/s, so propagation adds about 4.9 µs per kilometre, usually rounded to 5 µs (Lesson 9 explains why). Copper cables are similar.
- Processing (switching) delay: the time a switch or router takes to look up and forward the packet, from a few hundred nanoseconds in a data centre switch to tens of microseconds in software.
- Queuing delay: the time a packet waits behind other packets in a switch buffer. It is zero on an idle network and can grow to milliseconds under congestion. It is the only part that changes from moment to moment, and it causes most latency problems.
Round-trip time (RTT) is the time for a packet to go out and an answer to come back, roughly twice the one-way latency. Protocols that wait for acknowledgements are governed by RTT.
Worked problem
Latency across a fabric
A server sends a 1500-byte packet to a server in another rack of the same hall through a leaf, a spine and another leaf. Server links are 100 Gb/s, fabric links 400 Gb/s, each switch takes 0.8 µs to forward and the total fibre and copper length is 200 m. Assume the switches store each packet before forwarding it and the network is idle. What is the one-way latency?
Show solution
- Serialization on the two 100 Gb/s server links: \(2 \times 1500 \times 8 / 100 \times 10^{9} = 0.24\) µs.
- Serialization on the two 400 Gb/s fabric links: \(2 \times 1500 \times 8 / 400 \times 10^{9} = 0.06\) µs.
- Processing in three switches: \(3 \times 0.8 = 2.4\) µs.
- Propagation: \(0.2 \text{ km} \times 5\ \mu\text{s/km} = 1.0\) µs.
- Total: \(0.24 + 0.06 + 2.4 + 1.0 = 3.7\) µs.
Answer: About 3.7 µs one way, so an RTT of roughly 7.4 µs plus the time the servers themselves take, which is usually much longer: the operating system and application often add 10 µs to 100 µs. This is why high-performance clusters bypass the operating system with RDMA (Lesson 11).
TCP in brief
Most applications use TCP (Transmission Control Protocol), which turns the unreliable delivery of IP packets into a reliable, ordered byte stream. TCP numbers every byte it sends; the receiver returns acknowledgements (ACKs) saying how much it has received in order. Data that is not acknowledged within a timeout, or that the receiver signals is missing, is sent again.
TCP does not send one packet and wait. It keeps a window of unacknowledged data in flight. The window is limited by two things: the receive window the receiver advertises (how much buffer it has) and the congestion window the sender maintains (its estimate of how much the network can carry). A sender can transmit at most one window per round trip, so
The bandwidth-delay product
To fill a link, the window must be at least the bandwidth-delay product (BDP): the link rate multiplied by the RTT. The BDP is the amount of data "in the pipe" at once.
Worked problem
Why a fast link is slow
A company copies backups over a 10 Gb/s wavelength between two data centres with an RTT of 60 ms. (a) What is the BDP? (b) What is the maximum throughput if the TCP window is stuck at 64 KiB (65,536 bytes), the limit without window scaling?
Show solution
- (a) \(BDP = 10 \times 10^{9} \times 0.060 = 6 \times 10^{8}\) bits = 75 MB.
- (b) Throughput \(\le 65{,}536 \times 8 / 0.060 = 8.74 \times 10^{6}\) b/s.
Answer: (a) 75 MB must be in flight to fill the link. (b) With a 64 KiB window the transfer runs at only about 8.7 Mb/s, less than 0.1% of the link. Modern systems use TCP window scaling (RFC 7323) to allow windows of up to 1 GiB, but the buffers on both hosts must be tuned large enough. Long-distance transfer tools often run many parallel TCP streams for the same reason.
Inside a data centre the RTT is tiny, so the BDP is small: a 100 Gb/s link with a 10 µs RTT holds only 125 KB. Between cities the BDP becomes large, and every buffer, window and timer must be sized for it.
Loss and congestion control
If every sender transmitted as fast as it could, switch buffers would overflow and packets would be dropped. TCP congestion control prevents this. A new connection starts slowly and doubles its window every round trip (slow start) until it detects loss or reaches a threshold; it then grows the window steadily and cuts it sharply (typically halving it, or reducing by 30% in CUBIC, the Linux default) whenever a packet is lost. This additive-increase, multiplicative-decrease behaviour shares a bottleneck fairly between flows, but it means that loss directly limits throughput. A widely used approximation (the Mathis formula) for a long-lived flow is
where MSS is the maximum segment size (typically 1460 bytes) and \(p\) is the packet loss probability.
Worked problem
The cost of a little loss
Estimate the throughput of a single TCP flow with MSS 1460 bytes and loss probability \(10^{-4}\) (one packet in 10,000) on (a) a 60 ms intercity path and (b) a 50 µs path inside a data centre.
Show solution
- \(1.22/\sqrt{10^{-4}} = 1.22/0.01 = 122\).
- (a) \(MSS/RTT = 1460 \times 8 / 0.060 = 194{,}667\) b/s; throughput \(\approx 194{,}667 \times 122 = 23.7\) Mb/s.
- (b) \(MSS/RTT = 1460 \times 8 / 50 \times 10^{-6} = 233.6\) Mb/s; throughput \(\approx 233.6 \times 122 = 28.5\) Gb/s.
Answer: About 24 Mb/s across the 60 ms path but about 28 Gb/s inside the data centre: the same small loss rate is a thousand times more harmful over distance. A dirty connector or failing optic that drops one packet in ten thousand can cripple long-distance transfers while barely registering locally.
Newer algorithms reduce the dependence on loss. BBR, developed by Google, estimates the bottleneck bandwidth and minimum RTT and paces packets to match, rather than waiting for loss. Explicit Congestion Notification (ECN) lets switches mark packets when queues build instead of dropping them, and DCTCP (Data Center TCP, RFC 8257) uses the fraction of marked packets to slow down gently and keep queues short.
UDP and QUIC
UDP (User Datagram Protocol) adds only port numbers and a checksum to IP; it has no acknowledgements, ordering or congestion control of its own. Applications that prefer timeliness to reliability, such as voice, video calls, DNS lookups and online games, use it directly. QUIC (RFC 9000, 2021) builds a reliable, encrypted, congestion-controlled transport on top of UDP in the application itself, and carries HTTP/3. It sets up connections in fewer round trips than TCP plus TLS and avoids head-of-line blocking between streams. A large share of web traffic from the biggest content providers now uses QUIC, which matters to operators because it is encrypted end to end and cannot be inspected by middleboxes.
Buffers and incast
Every switch port has a queue. When packets arrive faster than the output link can send them, they wait in the buffer; when the buffer is full, new packets are dropped (tail drop). Data centre switch chips usually have a shared on-chip buffer of a few tens to a few hundred megabytes for the whole chip, shared among all ports, so any one port can claim only a part of it.
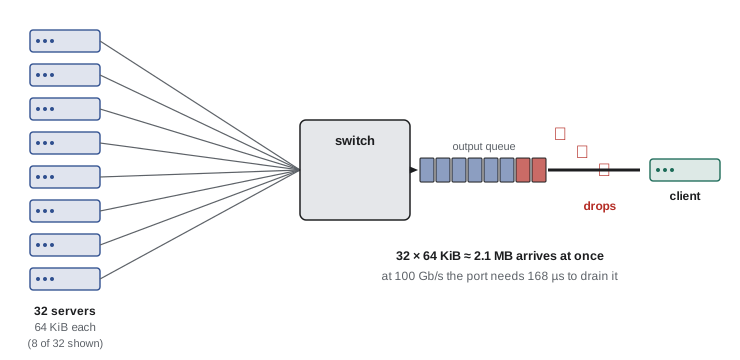
A classic data centre problem is incast: many servers answer one request at the same instant, and their responses converge on the single port leading to the requester. Distributed storage reads, search queries and AI collective operations (Lesson 11) all produce it.
Worked problem
An incast burst
A client reads a block striped across 32 storage servers. Each returns 64 KiB at the same moment through a 100 Gb/s port to the client. The switch can give that port at most 1 MB of buffer. (a) How much data arrives? (b) How long does the port take to drain it? (c) What happens?
Show solution
- (a) \(32 \times 65{,}536 = 2{,}097{,}152\) bytes, about 2.1 MB.
- (b) \(2{,}097{,}152 \times 8 / 100 \times 10^{9} = 168\) µs.
- (c) The burst arrives far faster than the port drains, so roughly half of it must be buffered beyond the 1 MB available. Packets are dropped, the affected servers wait for a retransmission timeout, and the read stalls.
Answer: About 2.1 MB arrives, needing 168 µs to drain, and much of it is dropped. If the minimum retransmission timeout is the traditional 200 ms, the read takes over a thousand times longer than it should. Fixes include shorter timeouts, DCTCP with ECN, deeper-buffer switches, limiting how many servers answer at once, and lossless fabrics for RDMA.
Buffers are a trade-off. Deep buffers absorb bursts and help long-distance flows, but a full buffer adds delay to every packet behind it, a problem called bufferbloat: a 100 MB queue on a 10 Gb/s port adds 80 ms of latency. Data centre switches therefore use relatively shallow buffers with active queue management, while routers at the edge of the WAN, which must handle long RTTs, often use deep buffers built from external high-bandwidth memory.
Spreading traffic across paths
A leaf-spine fabric (Lesson 3) offers many equal-cost paths between any two leaves. Switches spread traffic across them with ECMP (equal-cost multipath): they hash the fields that identify a flow, usually the five-tuple of source and destination IP address, protocol and source and destination port, and use the result to pick an uplink. All packets of one flow take the same path, so they arrive in order.
Hashing works well when there are many small flows. It works poorly when a few very large flows (elephant flows) dominate, because two of them can hash onto the same link while others sit idle.
Worked problem
Hash collisions
A leaf has 8 uplinks. Eight large flows, each able to fill one uplink, start at once and are placed by independent random hashing. How many uplinks are expected to carry no flow at all?
Show solution
- Probability that a given uplink receives none of the 8 flows: \((7/8)^{8} = 0.344\).
- Expected idle uplinks: \(8 \times 0.344 = 2.75\).
Answer: About 2.75 of the 8 uplinks sit idle on average, so some links carry two or three elephant flows and those flows run at half or a third of their potential. This is why AI fabrics use adaptive routing, packet spraying or flowlet switching instead of plain ECMP (Lesson 11).
Tail latency
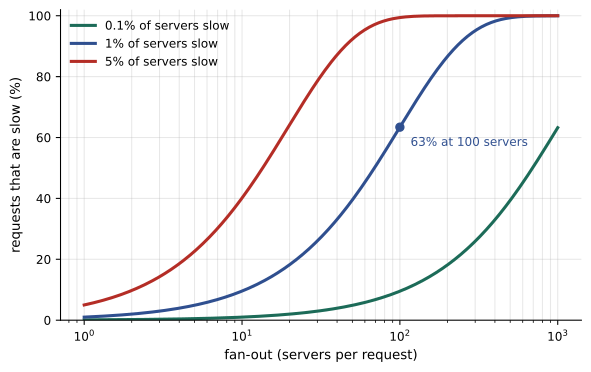
Many services answer a request by fanning it out to many servers and waiting for all of them, so the slowest server decides the response time. Average latency is then much less important than tail latency: the 99th or 99.9th percentile. Google engineers described the effect in a well-known 2013 paper, "The Tail at Scale".
Worked problem
Fan-out and the tail
Each server answers in 10 ms 99% of the time but takes 1 s the other 1% (because of a garbage-collection pause, a retransmission timeout or a busy disk). A request fans out to 100 servers and waits for all of them. What fraction of requests take at least 1 s?
Show solution
- Probability that all 100 servers are fast: \(0.99^{100} = 0.366\).
- Probability that at least one is slow: \(1 - 0.366 = 0.634\).
Answer: About 63% of requests are slow, even though each server is fast 99% of the time. Fan-out services hedge requests (sending a duplicate after a short delay), tolerate partial answers, and work hard to remove the causes of slow outliers, including network drops and queuing.
Quality of service
When a link is congested, quality of service (QoS) decides whose packets wait and whose are dropped. Packets are classified by a 6-bit DSCP (Differentiated Services Code Point) field in the IP header, or by the 3-bit priority field of an Ethernet VLAN tag. Each class is placed in its own queue, and a scheduler serves the queues:
- Strict priority: one queue is always served first. It suits small amounts of latency-sensitive traffic such as voice and network control protocols, but can starve other queues if overused.
- Weighted fair queuing or deficit round robin: queues share the link in set proportions, such as 50% storage, 30% general and 20% backup.
- Policing and shaping: traffic above an agreed rate is dropped (policed) or delayed and smoothed (shaped). Carriers police customer traffic to the purchased bandwidth.
- Lossless classes: for traffic that must never be dropped, such as RDMA over Converged Ethernet (RoCE), priority flow control (PFC) pauses the sender of that class when the buffer fills (Lesson 11).
QoS cannot create capacity. It decides who suffers when there is not enough, so the first answer to persistent congestion is more bandwidth or less traffic. QoS is essential for protecting the network's own control traffic (routing protocols, management) and for converged networks that mix storage, voice and bulk data on the same links.
Measuring performance
Network performance is measured both from the network and from the hosts:
- Interface counters show utilization, errors and discards (drops) on every port. A port with rising discards is congested; a port with rising CRC errors has a physical fault.
- Latency probes send test packets between many pairs of servers continuously (a "pingmesh") to map latency and loss across the fabric.
- Throughput tests such as iperf measure what a single flow or many parallel flows can achieve.
- Utilization averages hide bursts. A link averaging 30% over five minutes may be at 100% for milliseconds at a time and dropping packets; switch telemetry that reports buffer occupancy and microbursts is needed to see it (Lesson 12).
Common mistakes
MistakeAssuming a fast link means fast transfers over any distance.
InsteadCheck the bandwidth-delay product and make sure TCP windows and host buffers are large enough.
MistakeIgnoring small loss rates.
InsteadThroughput falls with the square root of loss and inversely with RTT; find and fix sources of loss, such as dirty connectors, especially on long paths.
MistakeJudging congestion from five-minute averages.
InsteadLook at discards, buffer occupancy and microburst telemetry.
MistakeOptimizing average latency for fan-out services.
InsteadMeasure and reduce tail latency (99th and 99.9th percentiles).
MistakeUsing QoS to fix a network that is simply too small.
InsteadQoS allocates scarcity; add capacity for persistent congestion.
Summary and key terms
- Latency = serialization + propagation (about 5 µs/km) + processing + queuing; queuing varies most.
- TCP throughput is limited to window/RTT; windows must cover the bandwidth-delay product.
- Loss limits TCP throughput, far more severely on long paths.
- ECN, DCTCP and BBR reduce dependence on loss; QUIC carries reliable, encrypted transport over UDP.
- Incast overflows the buffers of the port toward a requester; buffers trade burst absorption against delay.
- ECMP hashing spreads flows across paths but elephant flows can collide.
- With fan-out, tail latency dominates response time.
- QoS classifies, queues, schedules, polices and shapes traffic, but cannot create capacity.
- Serialization delay
- Packet size divided by link rate.
- Propagation delay
- Distance divided by signal speed, about 5 µs/km in fibre.
- Round-trip time (RTT)
- Time for a packet to go out and a reply to return.
- Bandwidth-delay product
- Link rate multiplied by RTT: the data in flight needed to fill the link.
- Congestion window
- The sender's estimate of how much data the network can carry in flight.
- ECN
- Explicit Congestion Notification: marking packets instead of dropping them.
- Incast
- Many synchronized senders overwhelming one receiver's port.
- Bufferbloat
- Excess latency caused by large, full buffers.
- ECMP
- Equal-cost multipath: hashing flows across several equal paths.
- Tail latency
- The latency of the slowest small fraction of requests.
- DSCP
- The IP header field that marks a packet's service class.
Practice problems
Work each problem on paper first, then reveal the answer to check.
Serialization delay of a 9000-byte packet at 400 Gb/s?
Show answer
0.18 µs.
One-way propagation delay over 80 km of fibre?
Show answer
About 400 µs (0.4 ms).
BDP of a 100 Gb/s link with 20 ms RTT?
Show answer
2 × 10⁹ bits = 250 MB.
Maximum throughput of a 1 MB window with a 10 ms RTT?
Show answer
800 Mb/s.
Using the Mathis formula, how does throughput change if loss rises from 10⁻⁴ to 10⁻²?
Show answer
It falls by a factor of 10.
Twenty servers each send 128 KiB to one 25 Gb/s port at once. Drain time?
Show answer
20 × 131,072 × 8 / 25 × 10⁹ ≈ 839 µs.
Four uplinks, two elephant flows hashed randomly. Probability they share a link?
Show answer
1/4.
Fan-out to 50 servers, each slow 2% of the time. Fraction of slow requests?
Show answer
1 − 0.98⁵⁰ ≈ 64%.
Name two queue scheduling methods.
Show answer
Strict priority; weighted fair queuing (or deficit round robin).
A 50 MB queue on a 25 Gb/s port adds how much delay when full?
Show answer
16 ms.
Lesson quiz · 5 questions
Score 60% or more to complete this lesson.
Create a free account to save your progress, take quizzes and earn a certificate.