
DCE-210 · Lesson 12 of 12 · 31 min
Network operations, reliability and the road ahead
A network is not finished when the last cable is plugged in. It must be watched, changed, repaired and grown for years, usually while carrying traffic that cannot stop. Most serious network outages are not caused by hardware failing on its own but by changes made by people and software, and by failures that are partial or hard to see. This final lesson covers how networks are operated at scale: monitoring and telemetry, automation and change management, the failure modes that matter, lessons from major outages, capacity planning, and the technologies that will shape data centre networks over the next decade.
Seeing the network: monitoring and telemetry
Operators need to know, continuously, whether every link, device and path is healthy and how loaded it is. The main sources of information are:
- Device counters and state: interface utilization, errors, discards, optical receive power and temperature, CPU and memory, routing session status. Traditionally these were polled every few minutes with SNMP; modern devices stream them every few seconds or faster using streaming telemetry (for example gNMI with OpenConfig data models), which reveals short events that polling misses.
- Flow data: sampled records of which addresses and applications are using the network (sFlow, NetFlow, IPFIX), used for capacity planning, billing, security and troubleshooting.
- Active probes: synthetic traffic sent continuously between many endpoints (Lesson 2) to measure latency and loss as applications experience them.
- Logs and events: messages from devices about link changes, protocol events and errors, collected centrally and correlated.
The goal is not more graphs but faster detection and diagnosis. Good monitoring raises alerts on symptoms that affect users (loss, latency, unreachability) and gives engineers the context to find the cause quickly.
Worked problem
Why averages mislead
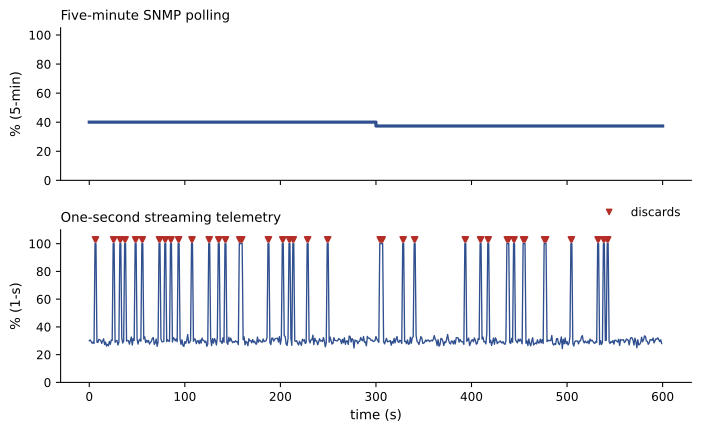
A 100 Gb/s port carries, in each 300 s polling interval, 20 bursts of 2 s at 100% utilization and runs at 30% the rest of the time. What utilization does five-minute polling report? What fraction of the time is the port saturated?
Show solution
- Saturated time: \(20 \times 2 = 40\) s; the other 260 s at 30%.
- Average: \((40 \times 100 + 260 \times 30)/300 = (4{,}000 + 7{,}800)/300 = 39.3\%\).
- Fraction saturated: \(40/300 = 13.3\%\).
Answer: Polling reports a comfortable 39% average, yet the port is saturated 13% of the time and probably dropping packets during each burst. Discard counters and high-resolution telemetry would show the problem; utilization averages alone would not.
Automation and the source of truth
A large data centre network has thousands of devices whose configurations must be consistent with each other and with the design. Configuring them by hand is slow and error-prone. Modern operators treat network configuration like software:
- A source of truth, a database describing every device, port, cable, address and intended setting, holds the design.
- Templates and code generate each device's configuration from the source of truth, so that a change is made once and applied everywhere consistently.
- Configurations are stored in version control, reviewed by a second engineer, and tested automatically before deployment, including in a simulated copy of the network.
- Deployment tools push changes, verify the result and roll back automatically if checks fail.
- Continuous validation compares the live network with the intended state and flags any drift.
Automation also reaches the physical layer: cabling plans generated from the source of truth, labels printed automatically, and technicians' work orders that tell them exactly which port to connect, which reduces the cabling errors that cause many faults in new deployments.
Change management
Because most outages follow a change, disciplined change management is the most effective reliability practice. Its elements are familiar from facility operations (DCE-200, Lesson 12):
- Every change has a written plan, a risk assessment, a test, a rollback procedure and a review.
- Changes are made in small steps and deployed progressively: first to a test environment, then to one device or one site (a canary), watching closely, then more widely.
- Risky changes are scheduled when traffic is low and engineers are available, and are not made to both redundant halves of a system at the same time.
- Automated safety checks stop a change that would, for example, remove too many routes, disable too many links or cut off management access.
- Engineers must always be able to reach devices out of band (Lesson 4) if the change breaks the production network.
Failure modes that matter
Networks fail in ways that are easy to detect and ways that are not:
- Fail-stop failures: a link or switch goes down cleanly. Routing protocols detect it within milliseconds to seconds (often helped by BFD, Bidirectional Forwarding Detection) and traffic moves to other paths. In a well-designed fabric these are routine.
- Grey failures: a component keeps running but performs badly: a link that drops 1% of packets, a switch that corrupts a small fraction of packets, an optic slowly losing power, a line card that silently drops traffic to some destinations. Routing protocols may not notice, because control messages still get through. Grey failures cause most hard-to-diagnose performance problems, and finding them requires active probing, error counters and automated analysis that disables suspicious components.
- Configuration and software errors: a bad policy, a software bug or a mistaken command. These can affect many devices at once, because the same configuration or software runs everywhere.
- Shared dependencies: DNS, authentication, time, management networks and the tools used to fix problems. When they fail, recovery becomes much harder.
Worked problem
The cost of a gray link
A fabric spreads each server's flows across 16 equal paths with ECMP. One path's link begins dropping 1% of packets. (a) What fraction of flows cross the bad link? (b) Using the Mathis formula from Lesson 2 with RTT 50 µs and MSS 1460 bytes, what throughput can an affected TCP flow achieve?
Show solution
- (a) About \(1/16 = 6.25\%\) of flows.
- (b) \(MSS/RTT = 1460 \times 8 / 50 \times 10^{-6} = 233.6\) Mb/s; \(1.22/\sqrt{0.01} = 12.2\); throughput \(\approx 233.6 \times 12.2 = 2.85\) Gb/s.
Answer: About 6% of flows are limited to under 3 Gb/s on 100 Gb/s servers, while the rest run normally. Average network health looks fine, but every job that depends on all its flows (Lesson 2's tail latency) slows down. Automated systems that spot rising error counters and remove the link from service turn a grey failure into a harmless fail-stop one.
Lessons from major outages
Two widely studied outages show how network failures cascade.
On October 4, 2021, Facebook (now Meta) disappeared from the internet for about six hours. During routine maintenance, a command meant to assess the capacity of the global backbone instead disconnected all of its data centres from each other; an audit tool that should have blocked the command had a bug. Facebook's DNS servers, designed to stop announcing their addresses when they could not reach the data centres, withdrew their BGP routes, so the rest of the internet could no longer find any Facebook service. Engineers then struggled to reach the affected systems, because the internal tools and even some building access systems depended on the same network.
On July 8, 2022, Rogers Communications suffered a nationwide outage in Canada lasting about a day for many customers, affecting more than 12 million wireless and wireline customers, Interac debit payments, and access to 911 for some users. A maintenance change removed a routing filter on distribution routers, which then flooded the core routers with routes until they failed. Because the wireless and wireline services shared a common core, both failed together, and management access was impaired by the same failure. An independent review commissioned by the CRTC recommended stronger change management, separation of management networks and better redundancy.
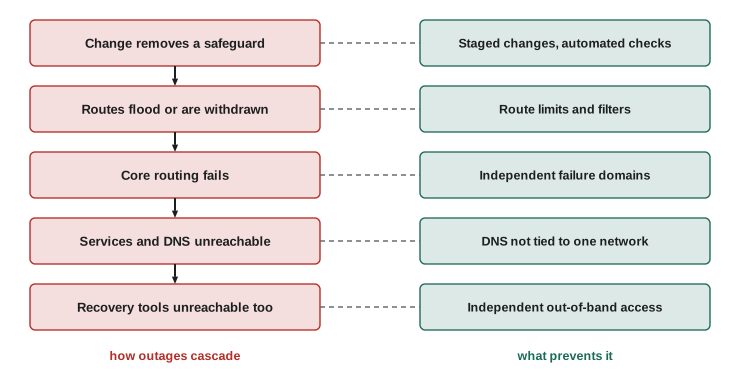
The common lessons are clear: changes can affect everything at once, safety checks must themselves be tested, critical services such as DNS must not depend on a single network, and the means of recovery, including out-of-band access, tools and physical access, must not share the fate of the production network.
In Canada, the federal government and the CRTC responded to the Rogers outage with requirements for major carriers to support emergency roaming, mutual assistance and public communication during outages, and with closer oversight of network resilience.
Capacity planning
Network traffic in data centres has grown by tens of percent a year for decades, and much faster in AI clusters. Capacity planning compares measured peak traffic, projected forward, with the capacity of each layer, and triggers upgrades early enough to complete them, which can take a year or more for new fibre routes or carrier contracts.
Worked problem
When to upgrade
A data centre's peak internet traffic is 4 Tb/s and grows 35% a year. Its edge capacity is 10 Tb/s, and the operator upgrades when the peak would exceed 70% of capacity. Adding capacity takes 9 months. When must the upgrade start?
Show solution
- Trigger level: \(0.70 \times 10 = 7\) Tb/s.
- Time to reach it: \(4 \times 1.35^{t} = 7\), so \(t = \ln(1.75)/\ln(1.35) = 0.560/0.300 = 1.87\) years.
- Start the upgrade 0.75 years earlier: at about \(1.87 - 0.75 = 1.1\) years from now.
Answer: The peak reaches 70% in about 1.9 years, so the upgrade must start in about 13 months. At 35% annual growth, traffic doubles roughly every 2.3 years, so a design that looks generous today is often full within one refresh cycle.
The road ahead
Several developments are shaping the next generation of data centre networks:
- Faster lanes and ports: 200 Gb/s electrical and optical lanes enable 1.6 Tb/s Ethernet ports, standardized by the IEEE 802.3dj project, with 400 Gb/s lanes and 3.2 Tb/s ports already in development.
- Lower-power optics: linear-drive pluggables and co-packaged optics (Lesson 6) cut the energy per bit of optical links, which matters as optics become a large share of network power.
- AI-specific fabrics: the Ultra Ethernet Consortium published its 1.0 specification in June 2025, adapting Ethernet for AI and high-performance computing with packet spraying, new congestion control and a new transport. UALink (1.0 specification April 2025) and NVLink compete to connect accelerators within a scale-up domain (Lesson 11).
- Optical circuit switching: some operators use mirror-based optical switches in place of electrical spine layers, reconfiguring the topology to match the workload while using very little power.
- Hollow-core fibre: fibre in which light travels through air rather than glass, nearly 50% faster than in standard fibre, which cuts propagation latency by about a third. Microsoft has begun deploying it between data centres.
- Post-quantum security (Lesson 4) and network automation driven by AI tools, which help operators detect anomalies and diagnose faults.
Worked problem
What hollow-core fibre buys
Two data centres are linked by a 90 km fibre route. Light travels at about 204,000 km/s in standard fibre and about 299,000 km/s in hollow-core fibre. Compare the round-trip propagation times.
Show solution
- Standard: \(2 \times 90 / 204{,}000 = 882\) µs.
- Hollow-core: \(2 \times 90 / 299{,}000 = 602\) µs.
- Saving: \(882 - 602 = 280\) µs, about 32%.
Answer: About 280 µs saved on every round trip, roughly a third. For synchronous replication (Lesson 5), the same latency budget can therefore cover about 1.47 times the distance, letting availability zones be placed farther apart for better independence.
Careers in data centre networking
Data centre networks employ network engineers who design and operate fabrics, network automation and software engineers, optical and transport engineers, telecommunications technicians, structured cabling installers (DCE-320), carrier and interconnection managers, and security specialists. Facility engineers who understand networks are valued because so many network problems, from airflow direction and power feeds to cable pathways and fibre routes, have physical causes. Industry certifications from equipment vendors and organizations such as BICSI complement formal education.
Common mistakes
MistakeRelying on five-minute utilization averages.
InsteadUse streaming telemetry and discard counters to see microbursts.
MistakeMaking the same change to every device at once.
InsteadDeploy in stages with canaries and automated rollback.
MistakeAssuming routing protocols detect all failures.
InsteadGrey failures need active probing and error-counter analysis.
MistakeLetting recovery tools depend on the production network.
InsteadKeep out-of-band access, tools and physical access independent.
MistakePlanning upgrades only when links are already full.
InsteadProject growth and start upgrades early enough to finish in time.
Summary and key terms
- Streaming telemetry, flow data, active probes and logs reveal network health; averages hide microbursts.
- A source of truth, generated configurations, review, testing and automated rollback make changes safer.
- Most major outages follow changes; staged deployment and safety checks are the main defence.
- Grey failures degrade performance without triggering routing; they need active detection.
- The Facebook (2021) and Rogers (2022) outages show cascading failures through shared dependencies.
- Capacity planning projects growth and starts upgrades early.
- 1.6 Tb/s Ethernet, lower-power optics, Ultra Ethernet, optical switching and hollow-core fibre lie ahead.
- Streaming telemetry
- Devices pushing frequent measurements to collectors instead of being polled.
- Source of truth
- The authoritative database of the network's intended design.
- Canary
- A first small deployment of a change, watched before wider rollout.
- BFD
- Bidirectional Forwarding Detection: fast detection of path failures.
- Grey failure
- A partial failure that degrades performance without being detected as down.
- Configuration drift
- Differences between a device's live and intended configuration.
- Capacity planning
- Projecting demand to schedule upgrades before capacity runs out.
- Ultra Ethernet
- An industry specification adapting Ethernet for AI and HPC.
- Hollow-core fibre
- Fibre that guides light through air, reducing latency.
Practice problems
Work each problem on paper first, then reveal the answer to check.
What does streaming telemetry reveal that five-minute SNMP polling misses?
Show answer
Short events such as microbursts.
A port runs at 100% for 30 s and 20% for 270 s. Five-minute average?
Show answer
28%.
What is a canary deployment?
Show answer
Applying a change first to a small part of the network and watching it before going further.
Why are grey failures hard to detect?
Show answer
The component stays up and control traffic still passes, so routing does not react.
ECMP over 8 paths; one drops packets. Fraction of flows affected?
Show answer
About 12.5%.
What made recovery slow in the 2021 Facebook outage?
Show answer
Tools and access depended on the failed network.
What triggered the 2022 Rogers outage?
Show answer
A change that removed a routing filter, flooding core routers with routes.
Traffic grows 40% a year. Doubling time?
Show answer
ln 2 / ln 1.4 ≈ 2.1 years.
Peak 3 Tb/s, capacity 6 Tb/s, trigger 75%, growth 25% a year. Years to trigger?
Show answer
ln(1.5)/ln(1.25) ≈ 1.8 years.
Round-trip saving of hollow-core fibre over 50 km?
Show answer
About 156 µs.
Lesson quiz · 5 questions
Score 60% or more to complete this lesson.
Create a free account to save your progress, take quizzes and earn a certificate.