
BUS-230 · Lesson 3 of 12 · 30 min
Process design and analysis
A process is a set of activities that transforms inputs into outputs. Approving a loan, assembling a bicycle, admitting a patient, filling an online order and brewing a batch of beer are all processes. Process design decides how the work will be done: the sequence of steps, the equipment and technology used, how much the work is standardized or customized, and how customers interact with it. Process analysis measures how a process performs, finds its constraints and identifies improvements. These skills apply to any operation, and they are among the most immediately useful tools in this course.
This lesson covers the main types of process and how they relate to product variety and volume, strategies for when to start production relative to customer orders, process mapping, the key measures of process performance, bottlenecks, Little's Law and common ways to improve a process. Capacity decisions and waiting lines follow in lesson 4, and lean tools such as value stream mapping in lesson 11.
Types of process
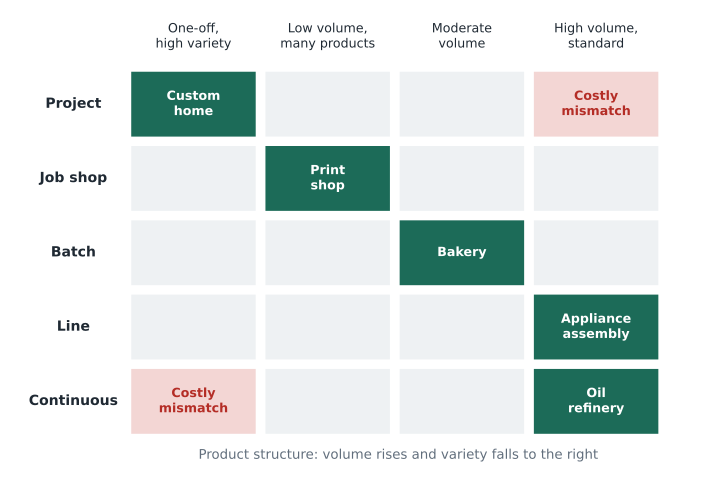
Processes are commonly classified by volume and variety. A project produces a one-off, usually large and complex output, such as a bridge, a film or a software system; resources come to the work, and project management techniques (covered in the PMP courses) are used to plan it. A job shop handles small quantities of many different products, each following its own route through general-purpose equipment and skilled staff; a machine shop making custom parts or a print shop are examples. A batch process makes moderate volumes of a range of products in groups, such as a bakery that makes a batch of bagels, then a batch of rye bread, using the same ovens.
A line (or repetitive) process makes high volumes of standardized products moving through a fixed sequence of stations, such as an appliance assembly line or a sandwich chain's assembly counter. A continuous process makes very high volumes of an undifferentiated product that flows without interruption, such as petroleum refining, paper making or electricity generation. Mass customization tries to combine the efficiency of line processes with variety, usually through modular designs, flexible automation and postponing the final customization until an order arrives, as with made-to-order laptops or custom-fit running shoes.
The product–process matrix
Hayes and Wheelwright's product–process matrix relates the product's position (low volume and high variety to high volume and standardization) to the process type. Most successful operations lie near the diagonal: projects and job shops for unique, low-volume products; batch for moderate volume and variety; lines and continuous flow for high volumes of standard products. A firm far off the diagonal incurs extra cost: running a commodity product through a job shop wastes money on unnecessary flexibility, while forcing a highly varied product onto an inflexible line causes constant changeovers and errors. As products move through the life cycle, firms often move their processes down the diagonal.
| Process type | Volume | Variety | Equipment and skills | Example |
|---|---|---|---|---|
| Project | One-off | Very high | Resources brought to the work | Building a hospital |
| Job shop | Low | High | General-purpose machines, skilled staff | Custom machining, print shop |
| Batch | Moderate | Moderate | Semi-flexible equipment, changeovers between batches | Bakery, pharmaceutical tablets |
| Line (repetitive) | High | Low | Specialized stations in sequence | Appliance or vehicle assembly |
| Continuous | Very high | Very low | Highly automated, capital intensive | Refinery, paper mill |
Services have an equivalent framework. Schmenner's service process matrix classifies services by labour intensity and by the degree of customer interaction and customization. Professional services, such as law and medicine, are labour-intensive and highly customized. Service shops, such as hospitals and auto repair, are less labour-intensive but still customized. Mass services, such as retail stores and schools, are labour-intensive with little customization. Service factories, such as airlines and fast-food chains, combine high capital intensity with standardized offerings. The management challenges differ: professional services must manage scarce skilled people, while service factories must manage capacity and demand.
When to produce: process strategies
Another key design choice is when to start production relative to the customer's order. In make-to-stock, products are made in advance from forecasts and held in finished-goods inventory, giving fast delivery but risking unsold stock; groceries and household goods work this way. In assemble-to-order, standard modules are made to stock and assembled when the order arrives, as with configurable computers or sandwiches. In make-to-order, production starts only after an order is received, as with custom furniture. In engineer-to-order, even the design begins after the order, as with custom machinery or buildings.
The point at which a product becomes dedicated to a specific customer order is called the customer order decoupling point. Moving it upstream (toward engineer-to-order) increases customization but lengthens delivery times; moving it downstream (toward make-to-stock) speeds delivery but raises inventory and forecasting risk. Postponement is the deliberate delay of differentiation until as late as possible: a paint store that mixes colours at the counter from a few base paints holds far less inventory than one that stocks every colour in every size.
Mapping a process
Before a process can be improved it must be understood, and the best way is to map it. A flowchart shows the sequence of steps, decision points and flows using standard symbols: ovals for start and end, rectangles for activities, diamonds for decisions and arrows for flows. A swim-lane diagram adds horizontal lanes for each department or role, making hand-offs between people visible; many delays and errors occur at hand-offs. For services, a service blueprint separates actions the customer sees from back-office actions behind the line of visibility (covered from the marketing side in BUS-220). Value stream maps, covered in lesson 11, add data on inventory and waiting time.
Mapping should be done by walking the process, not by describing it from an office. Teams are often surprised to find steps that no one knew about, approvals that add days but no value, rework loops, and large differences between the official procedure and what people actually do. A common technique is to classify each step as value-adding (changing the product in a way the customer will pay for), necessary but not value-adding (such as regulatory inspection) or waste.
Measuring process performance
Several measures describe a process. Cycle time is the average time between successive units leaving the process; for a line it equals the time at the slowest station. Throughput rate (or flow rate) is the number of units produced per unit of time and is the inverse of cycle time. Throughput time (also called flow time or lead time) is the total time a unit spends in the process from start to finish, including waiting. Work in process (WIP) is the number of units inside the process at any time. Capacity is the maximum throughput rate. Utilization is the share of available time a resource is busy.
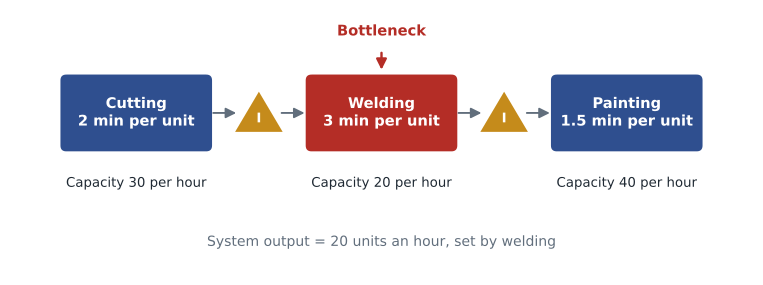
The bottleneck is the resource with the lowest capacity; it limits the throughput of the whole process. An hour lost at the bottleneck is an hour lost for the entire system, while an hour saved at a non-bottleneck is a mirage, because the extra output simply waits in front of the bottleneck. The theory of constraints, developed by Eliyahu Goldratt, turns this insight into five focusing steps: identify the constraint; exploit it (make sure it never sits idle); subordinate everything else to it; elevate it (add capacity); and, when the constraint moves elsewhere, repeat.
Worked problem
Finding the bottleneck
A small trailer-hitch shop has three stations in sequence: cutting takes 2 minutes per unit, welding 3 minutes and painting 1.5 minutes, each with one worker. The shop runs 8 hours a day. Find the bottleneck, the daily capacity, the cycle time and the utilization of each station. Then evaluate adding a second welder.
Show solution
- Station capacities: cutting 60 ÷ 2 = 30 units an hour; welding 60 ÷ 3 = 20 an hour; painting 60 ÷ 1.5 = 40 an hour.
- Welding is the bottleneck; capacity = 20 an hour × 8 = 160 units a day; cycle time = 3 minutes.
- At 20 units an hour, utilization: cutting 20 ÷ 30 ≈ 67 %; welding 100 %; painting 20 ÷ 40 = 50 %.
- Throughput time without waiting = 2 + 3 + 1.5 = 6.5 minutes.
- With two welders, welding capacity becomes 40 an hour; cutting (30 an hour) becomes the new bottleneck; daily capacity rises to 240 units, a 50 % increase.
Answer: Welding limits output to 160 units a day. A second welder raises capacity to 240 units a day, at which point cutting becomes the constraint.
Little's Law
Little's Law is one of the most useful relationships in operations. For any stable process (one where, over the long run, the average inflow equals the average outflow), the average number of units in the process equals the average throughput rate multiplied by the average throughput time:
Here \(L\) is average inventory or WIP, \(\lambda\) is the throughput rate and \(W\) is the average throughput time. The law holds regardless of the distribution of arrival and processing times and applies to products, customers, documents or cash. Given any two of the three quantities, the third follows. It explains why reducing WIP shortens lead times: if a factory produces 50 units a day and holds 1,000 units in process, the average unit takes 20 days to get through; cutting WIP to 250 units cuts the average throughput time to 5 days with no change in output.
Worked problem
Applying Little's Law to a service
A mortgage department completes an average of 30 applications a day. A count shows 210 applications in process, from receipt to final decision. (a) What is the average processing time? (b) Management wants decisions within 3 days on average without changing staffing. How much WIP is consistent with that goal?
Show solution
- (a) W = L ÷ λ = 210 ÷ 30 = 7 days.
- (b) L = λ × W = 30 × 3 = 90 applications.
- Reducing WIP from 210 to 90 requires releasing work into the process more carefully, clearing the backlog and stopping work from piling up between steps; it does not by itself require more staff, as long as the department can handle 30 a day.
- Customers care about W; managers often see only L, so tracking both is useful.
Answer: Applications currently take 7 days on average. To reach 3 days at the same output, the department must hold no more than about 90 applications in process.
import random
random.seed(230)
# Two-step process (check documents, then approve), one clerk at each step.
n = 4000
t, arrivals = 0.0, []
for _ in range(n):
    t += random.expovariate(1 / 6.0)          # an application every 6 minutes on average
    arrivals.append(t)
free1 = free2 = 0.0
finish, flow = [], []
for a in arrivals:
    s1 = max(a, free1); free1 = s1 + random.uniform(3, 6)      # step 1: 3-6 minutes
    s2 = max(free1, free2); free2 = s2 + random.uniform(4, 6.5) # step 2: 4-6.5 minutes
    finish.append(free2); flow.append(free2 - a)
horizon = finish[-1]
lam = n / horizon                       # throughput per minute
W = sum(flow) / n                       # average flow time, minutes
# Estimate L by sampling the number in process at 2,000 random instants
samples = [random.uniform(0, horizon) for _ in range(2000)]
inside = lambda x: sum(1 for a, f in zip(arrivals, finish) if a <= x < f)
L_obs = sum(inside(x) for x in samples) / 2000
print(f"Throughput: {lam*60:.2f} per hour; average flow time: {W:.1f} minutes")
print(f"Little's Law estimate L = lambda x W = {lam*W:.2f}")
print(f"Observed average number in process (sampled): {L_obs:.2f}")Throughput: 9.87 per hour; average flow time: 28.5 minutes Little's Law estimate L = lambda x W = 4.69 Observed average number in process (sampled): 4.69
The simulation shows Little's Law at work. The average number of applications in process, observed by sampling the system at random moments, closely matches the product of the throughput rate and the average flow time. Small differences reflect sampling error in the simulation, not a failure of the law.
Improving a process
Process improvement methods share a few basic moves. Eliminate steps that add no value, such as duplicate approvals or unnecessary transport. Combine steps to reduce hand-offs, which cause delays and errors. Reorder steps so that work runs in parallel rather than in sequence; a hospital that orders tests while a patient waits for a physician, rather than after, shortens the visit. Simplify steps through better tools, standard work and error-proofing. Balance work across stations so no one is overloaded. Add capacity at the bottleneck, by adding people or equipment, reducing set-ups or offloading work to non-bottleneck resources. And reduce variability, because variability creates queues even when average capacity is sufficient (lesson 4).
Business process reengineering, popular in the 1990s, called for radical redesign of processes from scratch rather than incremental improvement, often using information technology to remove hand-offs. Today, firms use a mix of continuous improvement (kaizen), Six Sigma projects (lesson 8) and digital tools. Process mining software reconstructs actual process flows from the time-stamped event logs of ERP and workflow systems, revealing the many variants a process takes in practice. Robotic process automation and artificial intelligence can take over repetitive, rule-based steps such as data entry and document classification, but automating a poorly designed process only makes the waste run faster.
| Improvement move | Example | Main effect |
|---|---|---|
| Eliminate | Remove a second signature on routine purchases under $500 | Shorter lead time, less effort |
| Combine | One agent handles a customer request end to end | Fewer hand-offs and errors |
| Parallel | Order lab tests while the patient waits to see the doctor | Shorter throughput time |
| Simplify and standardize | Templates and checklists for loan files | Less variation and rework |
| Add bottleneck capacity | Second welder, or reduce welding set-up time | Higher throughput |
| Reduce variability | Appointment scheduling instead of walk-ins | Shorter queues at the same utilization |
Common mistakes
MistakeAdding capacity at a station that is not the bottleneck.
InsteadFind the bottleneck first; only bottleneck improvements raise system throughput.
MistakeConfusing cycle time with throughput time.
InsteadCycle time is the interval between units leaving; throughput time is the total time one unit spends in the process.
MistakeMapping the process from the procedure manual.
InsteadWalk the process and observe what actually happens, including rework and waiting.
MistakeThinking a long queue of work means more output.
InsteadBy Little's Law, more WIP at the same throughput simply means longer lead times.
MistakeRunning a high-volume standard product through a job-shop process.
InsteadMatch the process type to volume and variety, near the diagonal of the product–process matrix.
MistakeAutomating a step before simplifying the process.
InsteadRemove waste and redesign first, then automate what remains.
Summary and key terms
- A process transforms inputs into outputs; design decides how the work is done.
- Process types range from project and job shop through batch and line to continuous flow.
- The product–process matrix matches process type to volume and variety; mismatches add cost.
- Make-to-stock, assemble-to-order, make-to-order and engineer-to-order differ in where the decoupling point lies.
- Flowcharts, swim lanes and blueprints make processes and hand-offs visible.
- Cycle time, throughput rate, throughput time, WIP, capacity and utilization describe performance.
- The bottleneck limits the whole process; the theory of constraints focuses improvement there.
- Little's Law, L = λW, links WIP, throughput and throughput time in any stable process.
- Improvement moves include eliminating, combining, parallelizing, simplifying, adding bottleneck capacity and reducing variability.
- Process
- A set of activities that transforms inputs into outputs.
- Job shop
- A process for small quantities of many different products using general-purpose resources.
- Line process
- A process in which standardized products move through a fixed sequence of stations.
- Product–process matrix
- A framework matching process type to product volume and variety.
- Decoupling point
- The point where a product becomes dedicated to a specific customer order.
- Cycle time
- The average time between successive units leaving a process.
- Throughput time
- The total time a unit spends in a process, including waiting.
- Bottleneck
- The resource with the lowest capacity, which limits system output.
- Little's Law
- Average WIP equals throughput rate multiplied by average throughput time.
- Postponement
- Delaying product differentiation until as late as possible.
Practice problems
Work each problem on paper first, then reveal the answer to check.
Classify each process: custom yacht; brewery; car assembly; dental practice.
Show answer
Project; batch (or continuous for very large breweries); line; professional service or service shop.
Why is it costly to run a commodity product in a job shop?
Show answer
It pays for flexibility and skilled labour the product does not need, raising unit cost.
Give an example of postponement.
Show answer
Mixing paint colours at the store from a few base paints.
Stations take 4, 6 and 5 minutes per unit, one worker each. What is the hourly capacity?
Show answer
10 units an hour, set by the 6-minute station.
In the same line, what is the utilization of the 4-minute station?
Show answer
10 ÷ 15 ≈ 67 %.
A clinic sees 12 patients an hour; on average 9 are in the clinic. What is the average time in the clinic?
Show answer
9 ÷ 12 = 0.75 hours, or 45 minutes.
A warehouse ships 400 orders a day and holds 1,200 orders in process. What is the average order lead time?
Show answer
3 days.
State the five focusing steps of the theory of constraints.
Show answer
Identify, exploit, subordinate, elevate, repeat.
What does a swim-lane diagram reveal that a basic flowchart may not?
Show answer
Hand-offs between departments or roles.
Portfolio task: map a process you use (for example, ordering a textbook) and suggest three improvements.
Show answer
Answers vary; identify steps, waits, hand-offs and improvement moves.
Lesson quiz · 5 questions
Score 60% or more to complete this lesson.
Create a free account to save your progress, take quizzes and earn a certificate.