
BUS-230 · Lesson 1 of 12 · 30 min
Operations and productivity
Every organization makes something. A brewery turns grain, water and labour into beer; a hospital turns the skills of nurses and doctors, equipment and supplies into treated patients; a software firm turns developer time and cloud computing into an app; a city transit system turns buses, drivers and fuel into trips. Operations management is the design, operation and improvement of the systems that create and deliver an organization's goods and services. It is one of the three core functions of any organization, alongside marketing (which creates demand) and finance (which provides and accounts for money). In most firms, operations employs the largest share of people and controls the largest share of costs and assets, so small improvements in operations can have a large effect on profit, customer satisfaction and sustainability.
This lesson introduces the field. It defines operations management and the transformation process, contrasts goods and services, traces the history of the discipline, explains the decisions operations managers make and shows how productivity is measured and improved. Later lessons go deeper on each decision area: strategy, process design, capacity, location and layout, forecasting, quality, inventory, planning, lean operations and the supply chain. The course builds on the arithmetic and break-even analysis in BUS-110; the MBA course MBA-513 revisits the same topics at a more advanced level.
The transformation process
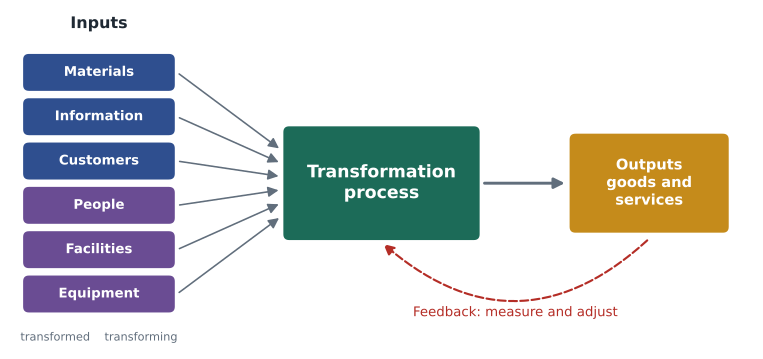
The simplest model of operations is the input–transformation–output model. Inputs are the resources an operation uses. Transformed resources are what the operation changes: materials (a steel coil becomes car doors), information (an accounting firm turns receipts into a tax return) or customers themselves (a hair salon changes a customer's appearance; an airline changes a passenger's location). Transforming resources are what do the changing: facilities, equipment, technology and people. The transformation process adds value by changing the physical properties, location, ownership, storage, information or condition of what passes through it. Outputs are the goods and services delivered to customers.
Feedback and control close the loop. The operation monitors outputs and the process itself, comparing actual performance with targets for cost, quality, speed and other measures, and adjusts inputs or the process when results drift. A bakery that weighs a sample of loaves every hour and adjusts the divider when the average weight creeps up is using feedback control. Random variation in demand, supplier deliveries, equipment condition and human performance means that control is a permanent task rather than a one-time design decision.
| Operation | Main transformed resource | Transforming resources | Main output |
|---|---|---|---|
| Auto parts plant | Steel, plastic, components | Presses, robots, skilled trades, engineers | Brake assemblies |
| Hospital emergency department | Patients (customers) | Physicians, nurses, imaging, beds | Diagnosed and treated patients |
| Accounting firm | Information | Accountants, software, offices | Audited statements, tax returns |
| Distribution centre | Materials (location and storage) | Racking, conveyors, forklifts, staff | Orders delivered on time |
| Restaurant | Food and customers | Kitchen equipment, cooks, servers | Meals and a dining experience |
Goods and services
The traditional distinction between manufacturing and services is useful but blurred. Pure goods, such as a bag of salt sold in bulk, are tangible, can be stored and are produced away from the customer. Pure services, such as a counselling session, are intangible, perishable (an empty appointment slot cannot be sold later) and produced while the customer is present. Most offerings lie between the extremes. A new car comes with financing, warranty service and connected software updates; a restaurant meal combines a tangible product with a service experience. Many manufacturers now earn a large share of profit from services, a trend called servitization: aircraft engine makers sell 'power by the hour' contracts, and equipment makers sell monitoring and maintenance subscriptions.
The differences still matter for operations decisions. Because services cannot be stored, capacity must be matched to demand in real time, which makes queuing and scheduling central (lesson 4). Because customers participate, their behaviour introduces variability: one bank customer arrives with a simple deposit, the next with a complex mortgage question. Because services are intangible, quality is harder to measure and depends heavily on customer perceptions. And because many services are produced where the customer is, location decisions for services focus on access to customers, whereas manufacturing locations focus on costs and access to suppliers and markets (lesson 5).
| Characteristic | Typical goods | Typical services | Operations implication |
|---|---|---|---|
| Tangibility | Physical, can be inspected | Intangible, experienced | Service quality measured through perceptions and surveys |
| Storage | Can be held in inventory | Perishable | Services must flex capacity or manage demand |
| Customer contact | Low; produced away from customer | Often high; customer present | Customer behaviour adds variability |
| Location | Near resources or transport hubs | Near customers | Many small sites versus a few large plants |
| Measuring output | Units produced | Cases, visits, transactions | Productivity and quality are harder to compare |
A short history of operations management
Operations management has a long history. Adam Smith's 1776 description of a pin factory showed how the division of labour raised output per worker. Eli Whitney and others promoted interchangeable parts. Frederick Taylor's scientific management, around 1900, used time studies and standard methods to set 'one best way' for each task, while Frank and Lillian Gilbreth studied motion and fatigue. Henry Ford's moving assembly line of 1913 cut the time to assemble a Model T chassis from about 12 hours to about 90 minutes, making mass production the dominant model for half a century.
After the Second World War, statistical quality control, pioneered by Walter Shewhart and spread by W. Edwards Deming and Joseph Juran, was embraced in Japan. Toyota developed the Toyota Production System, the basis of lean operations (lesson 11), which combined just-in-time flow with built-in quality and continuous improvement. Computers made material requirements planning (MRP) and later enterprise resource planning (ERP) possible (lesson 10). Since the 1990s, the focus has widened from the factory to the whole supply chain, to services, which now account for most employment in Canada and the United States, and to sustainability. Today, analytics, automation, artificial intelligence and the disruptions of pandemics, extreme weather and trade disputes are reshaping the field again.
What operations managers decide
Operations decisions are often grouped by time horizon. Strategic decisions, made for years ahead, include the operations strategy, the design of goods and services, process technology, capacity, location and the structure of the supply chain. Tactical decisions, made for months ahead, include aggregate production plans, workforce levels, inventory policies and supplier contracts. Operational decisions, made daily or weekly, include scheduling jobs, assigning staff, ordering materials and responding to quality problems. A useful checklist is the ten decision areas used by many textbooks: design of goods and services; quality management; process and capacity design; location; layout; human resources and job design; supply chain management; inventory; scheduling; and maintenance.
Operations managers work across functions. Marketing forecasts demand and promises delivery dates; operations must be able to meet them. Finance evaluates investments in equipment and sets budgets; operations must justify capital spending and control costs. Human resources recruits and trains people; operations designs the jobs. Engineering designs products; operations must be able to make them at the required quality and cost. Job titles include operations manager, plant manager, production planner, supply chain analyst, quality manager, logistics coordinator, purchasing agent and process improvement specialist, and the same skills apply in hospitals, banks, government agencies and non-profits.
Productivity
Productivity measures how efficiently inputs are converted into outputs. It is the ratio of outputs to inputs:
Partial (single-factor) productivity uses one input, such as labour hours (output per labour hour), machine hours, energy or capital. Multifactor productivity divides output by a combination of inputs, usually measured in dollars so that they can be added: labour cost plus materials plus energy plus capital charges. Labour productivity is the most widely reported measure because labour is easy to count and wages depend in the long run on output per hour, but it can mislead: a factory that buys robots raises output per labour hour even if total costs rise. Multifactor productivity gives a fuller picture.
Productivity growth is the main source of rising living standards over time. If output per hour grows 2 % a year, output per hour roughly doubles in 35 years. Productivity growth comes from better technology and equipment (capital), more skilled and better-managed workers, and improvements in methods and organization. For an individual firm, productivity improvement means either producing more with the same inputs or producing the same output with fewer inputs.
Worked problem
Partial and multifactor productivity
A furniture workshop makes 360 chairs in a week using 600 labour hours. Labour costs $32 an hour, materials cost $10,800, energy $1,200 and the weekly capital charge for equipment is $3,000. Next month it plans to buy a CNC router that raises output to 450 chairs a week with 560 labour hours, while the capital charge rises to $5,400 (materials scale with output; energy rises to $1,500). Compare labour and multifactor productivity before and after.
Show solution
- Before: labour productivity = 360 ÷ 600 = 0.60 chairs per labour hour.
- Before: total input cost = 600 × $32 + $10,800 + $1,200 + $3,000 = $19,200 + $15,000 = $34,200; multifactor productivity = 360 ÷ $34,200 ≈ 0.01053 chairs per dollar, or 10.53 chairs per $1,000.
- After: labour productivity = 450 ÷ 560 ≈ 0.80 chairs per labour hour, up about 34 %.
- After: materials = $10,800 × 450 ÷ 360 = $13,500; total cost = 560 × $32 + $13,500 + $1,500 + $5,400 = $17,920 + $20,400 = $38,320; multifactor productivity = 450 ÷ $38,320 ≈ 11.74 chairs per $1,000, up about 11.6 %.
- The labour measure overstates the gain because the router adds capital cost; the multifactor measure captures the trade-off.
Answer: Labour productivity rises about 34 %, but multifactor productivity rises a more modest but still worthwhile 11.6 %, because part of the labour saving is offset by the higher capital charge.
Worked problem
Productivity in a service
A provincial licensing office processes 1,800 renewals a week with 12 clerks working 35 hours each. After it introduces online pre-filling, 9 clerks handle 2,100 renewals a week, and 600 more renewals are completed fully online with no clerk time. What happened to labour productivity, and what should management watch?
Show solution
- Before: 1,800 ÷ (12 × 35) = 1,800 ÷ 420 ≈ 4.29 renewals per clerk hour.
- After, counting only clerk-handled renewals: 2,100 ÷ (9 × 35) = 2,100 ÷ 315 ≈ 6.67 renewals per clerk hour, up about 56 %.
- Counting all renewals: 2,700 ÷ 315 ≈ 8.57 per clerk hour, double the original rate.
- Management should also track the cost of the online system, error rates and customer waiting time, because productivity gains that lower service quality are not real improvements.
Answer: Labour productivity rose by roughly 56 % to 100 %, depending on how online transactions are counted. Service productivity measures should always be read alongside quality and cost.
National statistics agencies publish productivity data for whole economies and industries. In Canada, Statistics Canada publishes quarterly estimates of labour productivity, hourly compensation and unit labour cost for the business sector, and annual multifactor productivity estimates. Canada's productivity record has become a major public policy concern: estimates often put Canadian business-sector labour productivity at roughly 70 to 75 per cent of the US level, and the Bank of Canada and others have warned that weak productivity growth limits wage growth and competitiveness. Explanations include lower business investment in machinery, equipment and software per worker, a large share of small firms, and the industry mix. For managers, the point is that the national gap is the sum of millions of operations decisions about equipment, methods, training and management practice.
Measuring productivity correctly
Measuring productivity is harder than the formula suggests. Outputs must be comparable over time: if the furniture workshop shifts from simple stools to complex rocking chairs, a fall in chairs per hour may hide a rise in value per hour. Statisticians handle this by weighting outputs by value and adjusting for price changes. Quality changes are hard to capture: a laptop today is far more powerful than one a decade ago at a similar price. In services, defining the output is often contentious. Is a hospital more productive if it discharges patients faster, or less productive if more of them are readmitted? Is a call centre more productive if it handles more calls per hour, or less productive if customers must call back?
Good practice is to use a family of measures rather than one. A plant might track output per labour hour, scrap rate, energy per unit, on-time delivery and overall equipment effectiveness (OEE, covered in ROB-440). A service operation might track transactions per staff hour, first-contact resolution, waiting time and customer satisfaction. Measures should be linked to the operations strategy (lesson 2): a firm that competes on speed should measure speed, not only cost.
# Productivity index for a bakery over six weeks, base week = 100
loaves  = [12000, 12400, 11800, 13100, 13600, 13900]
hours   = [800, 810, 805, 820, 815, 812]
cost_k  = [21.5, 22.0, 21.4, 23.0, 23.6, 23.9]   # total input cost, thousands of dollars

base_lab = loaves[0] / hours[0]
base_mfp = loaves[0] / cost_k[0]
print("week  loaves/hr  per-hour idx  multifactor idx")
for w, (q, h, c) in enumerate(zip(loaves, hours, cost_k), start=1):
    lab = q / h
    mfp = q / c
    print(f"{w:>4}  {lab:9.2f}  {100*lab/base_lab:12.1f}  {100*mfp/base_mfp:15.1f}")
growth = (loaves[-1]/hours[-1]) / base_lab - 1
print(f"Change in loaves per hour over the period: {growth:.1%}")week loaves/hr per-hour idx multifactor idx 1 15.00 100.0 100.0 2 15.31 102.1 101.0 3 14.66 97.7 98.8 4 15.98 106.5 102.0 5 16.69 111.2 103.2 6 17.12 114.1 104.2 Change in loaves per hour over the period: 14.1%
The output shows how an index makes trends easy to read: each week's productivity is expressed relative to the first week, set to 100. Labour productivity rises faster than multifactor productivity here because input costs rise along with output; a manager would want to know why costs per loaf are not falling as volume grows.
Operations, ethics and sustainability
Operations decisions have social and environmental consequences. Choices about job design affect worker safety and well-being; choices about suppliers affect working conditions far up the supply chain; choices about energy, materials and transport affect greenhouse gas emissions and waste. The triple bottom line asks firms to measure performance on people, planet and profit. Many sustainability gains are also productivity gains: less scrap, less energy and less transport mean lower costs. Others involve trade-offs, such as paying more for low-carbon materials. Lesson 12 returns to sustainable supply chains, emissions accounting and laws on forced labour in supply chains.
Common mistakes
MistakeThinking operations management only applies to factories.
InsteadEvery organization transforms inputs into outputs; hospitals, banks and governments have operations too.
MistakeUsing labour productivity alone to judge an investment in equipment.
InsteadUse multifactor productivity or total cost per unit, which include the capital and energy the investment adds.
MistakeComparing productivity across periods when the output mix has changed.
InsteadWeight outputs by value or measure each product separately before comparing.
MistakeTreating faster service as more productive regardless of outcomes.
InsteadPair productivity measures with quality measures such as errors, rework and customer satisfaction.
MistakeAssuming services cannot be standardized or measured.
InsteadServices can be designed, measured and improved, although customer variability must be managed.
MistakeSeeing sustainability as separate from operations.
InsteadWaste, energy and transport choices are operations decisions that affect cost and emissions together.
Summary and key terms
- Operations management designs, runs and improves the systems that create goods and services.
- The transformation model converts inputs into outputs, with feedback and control to keep performance on target.
- Most offerings combine goods and services; services are intangible, perishable and involve customers in production.
- The field developed from the division of labour and scientific management through mass production, quality management, lean, ERP and supply chain management.
- Operations decisions span strategic, tactical and operational horizons and ten common decision areas.
- Productivity is output divided by input; partial measures use one input and multifactor measures combine several.
- Labour productivity can overstate gains from capital investment; multifactor productivity gives a fuller picture.
- National productivity growth drives living standards and reflects millions of operations decisions.
- Productivity measures must be paired with quality, customer and sustainability measures.
- Operations management
- The design, operation and improvement of the systems that create and deliver goods and services.
- Transformation process
- The activities that change inputs into outputs of greater value.
- Transformed resources
- Materials, information or customers that are changed by an operation.
- Transforming resources
- Facilities, equipment, technology and people that perform the transformation.
- Servitization
- The addition of services to physical products as a source of value and revenue.
- Productivity
- The ratio of outputs to the inputs used to produce them.
- Partial productivity
- Output divided by a single input, such as labour hours.
- Multifactor productivity
- Output divided by a combination of inputs, usually measured in dollars.
- Scientific management
- Taylor's approach of studying tasks to set standard methods and times.
- Triple bottom line
- Measuring performance on social, environmental and economic results.
Practice problems
Work each problem on paper first, then reveal the answer to check.
Name the transformed and transforming resources in a dental clinic.
Show answer
Transformed: patients (and information). Transforming: dentists, hygienists, chairs, instruments, imaging.
Give two reasons capacity management is harder in services.
Show answer
Services are perishable and cannot be stored, and demand often arrives randomly while customers wait.
A plant makes 2,000 units with 400 labour hours. What is its labour productivity?
Show answer
5 units per labour hour.
Inputs cost $8,000 and output is 1,600 units. What is multifactor productivity?
Show answer
0.2 units per dollar, or 200 units per $1,000.
Labour productivity rises 20 % after automation but total cost per unit rises. Has the firm become more productive overall?
Show answer
No; multifactor productivity has fallen even though labour productivity rose.
Why might a call centre's calls per hour be a misleading productivity measure?
Show answer
Rushed calls may not resolve problems, causing repeat calls and dissatisfaction.
How long does it take output per hour to double at 2 % annual growth?
Show answer
About 35 years (70 ÷ 2).
Classify each as strategic, tactical or operational: building a new plant; setting next quarter's workforce; assigning today's shifts.
Show answer
Strategic; tactical; operational.
What is servitization? Give an example.
Show answer
Adding services to products, such as an engine maker selling engine hours with maintenance included.
Portfolio task: choose a local organization and sketch its transformation process and three productivity measures.
Show answer
Answers vary; inputs, process, outputs and measures linked to cost, quality and speed should appear.
Lesson quiz · 5 questions
Score 60% or more to complete this lesson.
Create a free account to save your progress, take quizzes and earn a certificate.