
BUS-230 · Lesson 11 of 12 · 31 min
Lean operations
In the 1980s, researchers comparing car plants around the world found something startling. Toyota's plants assembled cars with roughly half the labour hours, half the factory space, a fraction of the inventory and far fewer defects than typical North American and European plants. The difference was not mainly robots or cheaper wages but a different way of organizing work, which the researchers called lean production. Lean thinking has since spread from car plants to hospitals, banks, software teams, warehouses, construction sites and government offices. Its central idea is simple to state and hard to practise: deliver what customers value with the least possible waste, by making work flow smoothly and improving it continuously with the people who do it.
This lesson covers the origins and principles of lean, the types of waste, just-in-time production and pull systems with kanban, level scheduling, set-up reduction, workplace organization and error-proofing, equipment maintenance, value stream mapping, continuous improvement, lean in services, and the limits of lean, including the resilience trade-offs revealed by recent supply chain disruptions.
Origins and principles
Lean grew from the Toyota Production System (TPS), developed by Taiichi Ohno, Shigeo Shingo and others from the late 1940s onward. Toyota could not afford the large inventories and long production runs of American mass producers, so it developed ways to make small quantities of many models efficiently. TPS rests on two pillars: just-in-time (making only what is needed, when it is needed, in the amount needed) and jidoka (automation with a human touch: building in quality by stopping the process at the first sign of a problem). Underneath both are standardized work, level production and kaizen (continuous improvement), and a philosophy of respect for people. The term 'lean' was popularized by the 1990 book The Machine That Changed the World, from MIT's International Motor Vehicle Program.
Womack and Jones later summarized lean thinking in five principles. Specify value from the customer's point of view. Identify the value stream: all the steps needed to deliver the product, and eliminate those that create no value. Make value flow without interruptions, batches or waiting. Let the customer pull products through the system, rather than pushing products based on forecasts. Pursue perfection through continuous improvement, because each round of improvement reveals more waste.
The eight wastes
Ohno identified seven types of waste (muda in Japanese); many practitioners add an eighth. The acronym TIMWOODS helps people remember them.
| Waste | Description | Factory example | Office or service example |
|---|---|---|---|
| Transportation | Unnecessary movement of materials or information | Moving parts between distant departments | Routing a form through five offices |
| Inventory | More material or work than needed | Piles of work in process between machines | Overflowing email inboxes, backlog of applications |
| Motion | Unnecessary movement of people | Walking to fetch tools | Searching for files on shared drives |
| Waiting | Idle time waiting for the next step | Operators waiting for a machine set-up | Patients waiting for test results |
| Overproduction | Making more or earlier than needed | Building stock no one has ordered | Printing reports nobody reads |
| Overprocessing | Doing more work than the customer values | Polishing a hidden surface | Approvals by three managers for a small purchase |
| Defects | Errors requiring rework or scrap | Scrapped parts | Data entry errors, wrong prescriptions |
| Skills (unused talent) | Not using people's knowledge and ideas | Ignoring operators' improvement ideas | Skilled nurses doing clerical work |
Ohno considered overproduction the worst waste, because it creates and hides the others: excess production requires inventory, transport, storage and handling, and the piles of inventory conceal defects and problems. Lean also targets mura (unevenness in workload) and muri (overburden on people and equipment), because uneven schedules and overloaded resources generate waste and errors. A common image is of inventory as water in a river that hides rocks (problems): lowering the water level exposes the rocks so they can be removed.
Just-in-time and pull systems
Just-in-time (JIT) production aims to make and deliver exactly what is needed, when it is needed, in the quantity needed. In a push system, production is scheduled from forecasts and products are pushed to the next stage whether or not it is ready; inventory accumulates wherever the flow is blocked. In a pull system, a downstream stage signals when it needs more, and upstream stages produce only to replace what has been used. Pull limits work in process, and by Little's Law (lesson 3), limiting WIP shortens lead times.
Kanban, Japanese for 'signboard' or 'card', is the classic pull signal. Each container of parts carries a card. When a downstream station empties a container, the card goes back upstream as authorization to produce or move one more container. No card, no production. The number of cards caps the inventory in the loop, and managers deliberately remove cards over time to expose problems. Electronic kanban systems now send signals through scanners and software, and the same logic underlies kanban boards used by software and office teams to limit work in progress.
Here \(N\) is the number of kanban containers, \(d\) the demand rate, \(L\) the replenishment lead time (the time to produce or deliver and return a container), \(s\) a safety factor and \(C\) the container size. The result is rounded up.
Worked problem
How many kanbans?
An assembly cell uses 400 brackets a day. Brackets come from a stamping press in containers of 50. The time to fill and return a container is half a day, and the plant uses a 10 % safety factor. How many kanban containers are needed? What happens if set-up reduction cuts the replenishment time to a quarter of a day?
Show solution
- N = 400 × 0.5 × 1.10 ÷ 50 = 220 ÷ 50 = 4.4, rounded up to 5 containers.
- Maximum inventory in the loop = 5 × 50 = 250 brackets.
- With L = 0.25 day: N = 400 × 0.25 × 1.10 ÷ 50 = 2.2, rounded up to 3 containers, or at most 150 brackets.
- Shorter replenishment lead times directly reduce the inventory needed.
Answer: The cell needs 5 containers (250 brackets maximum). Halving the replenishment time reduces this to 3 containers (150 brackets), cutting inventory by 40 %.
Level scheduling and set-up reduction
Pull works best when demand on upstream processes is steady. Heijunka, or level scheduling, smooths the volume and mix of production over time. Instead of building all of model A on Monday and Tuesday and model B on Wednesday (large batches that create uneven demand for parts), a levelled plant builds a repeating mixed sequence such as A-A-B-A-C within each hour. Mixed-model sequencing requires that changeovers between models be quick and cheap.
Shigeo Shingo's single-minute exchange of dies (SMED) method attacks set-up time. Its key steps are to separate internal set-up activities (which can only be done while the machine is stopped) from external ones (which can be done while it runs), convert internal activities to external where possible (for example, preheating dies), and streamline the rest with quick-release clamps, standardized heights and parallel work. Toyota cut some press changeovers from hours to under ten minutes. Recall from lesson 9 that the economic order quantity rises with the square root of set-up cost: cutting set-up cost by three-quarters halves the economic batch size, which halves cycle inventory and makes level scheduling possible.
import math
# Effect of set-up reduction on economic batch size (EOQ logic)
D, H = 24_000, 3.0                       # annual demand, holding cost per unit-year
for setup_min, setup_cost in [(60, 200), (30, 100), (15, 50), (5, 17)]:
    q = math.sqrt(2 * D * setup_cost / H)
    print(f"set-up {setup_min:>2} min (${setup_cost:>3}): batch {q:5.0f}, "
          f"average cycle stock {q/2:5.0f}, set-ups a year {D/q:4.0f}")

# Value stream metrics for a simple line (one 8-hour shift a day)
steps = [("raw material", "inv", 5.0), ("cut", "op", 45), ("WIP", "inv", 2.0),
         ("weld", "op", 60), ("WIP", "inv", 1.5), ("assemble", "op", 90),
         ("finished goods", "inv", 3.0)]
day_s = 8 * 3600
va = sum(v for _, kind, v in steps if kind == "op")                 # seconds
lead_days = sum(v for _, kind, v in steps if kind == "inv") + va / day_s
print(f"Value-added time: {va} s; production lead time: {lead_days:.1f} days")
print(f"Process cycle efficiency: {va / (lead_days * day_s):.3%}")set-up 60 min ($200): batch 1789, average cycle stock 894, set-ups a year 13 set-up 30 min ($100): batch 1265, average cycle stock 632, set-ups a year 19 set-up 15 min ($ 50): batch 894, average cycle stock 447, set-ups a year 27 set-up 5 min ($ 17): batch 522, average cycle stock 261, set-ups a year 46 Value-added time: 195 s; production lead time: 11.5 days Process cycle efficiency: 0.059%
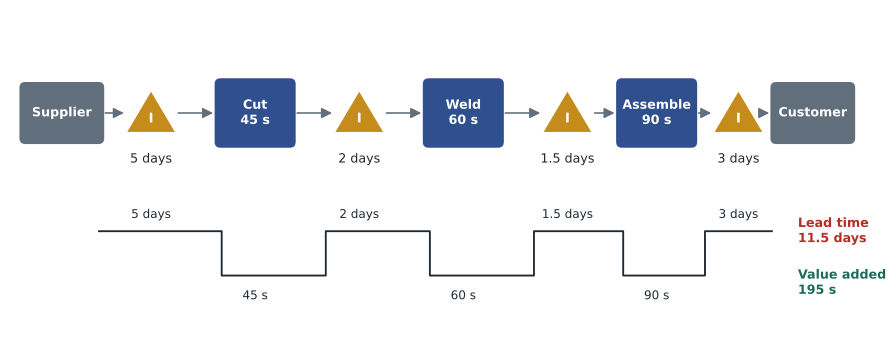
The first part of the output shows the power of set-up reduction: as the set-up falls from an hour to five minutes, the economic batch shrinks from about 1,800 to about 520 units and average cycle stock falls in proportion. The second part summarizes a value stream map, explained below: the product spends 11.5 days in the line but receives only 195 seconds of value-adding work, a process cycle efficiency of well under 1 %. Such figures are typical before lean improvement and show that the biggest gains usually lie in the waiting, not the work.
Workplace organization, error-proofing and maintenance
5S is a method for organizing the workplace so that problems are visible and work is efficient: sort (remove what is not needed), set in order (a place for everything, marked and close to where it is used), shine (clean and inspect), standardize (make the first three routine) and sustain (keep it up through discipline and audits). It is often the first lean activity a site undertakes because results are visible quickly, but 5S without the rest of lean is merely tidiness.
Poka-yoke, or error-proofing, designs processes so that mistakes cannot happen or are caught immediately. Examples include connectors that fit only one way, fixtures that hold a part only in the correct orientation, sensors that stop a machine if a part is missing, checklists, forms that will not submit until required fields are complete, and pharmacy systems that scan both the patient's wristband and the medication. Jidoka extends this by giving machines and people the ability to stop the process when something goes wrong, so defects are not passed downstream; Toyota's andon cord (lesson 7) is the visible symbol.
Total productive maintenance (TPM) aims for zero breakdowns by involving operators in routine care of their equipment (cleaning, lubrication, inspection), planning preventive maintenance, and analyzing failures. Its main measure, overall equipment effectiveness (OEE), multiplies availability, performance and quality rates and is covered in depth in ROB-440. Reliable equipment is a precondition for JIT, because without buffer inventory a breakdown stops the whole line.
Value stream mapping
A value stream map (VSM) is a one-page picture of the material and information flows needed to deliver a product family, from supplier to customer. It records each process step with its cycle time, changeover time, uptime and staffing, the inventory between steps (converted into days of demand), how information flows from the customer through production control to each step, and a timeline that compares total lead time with value-added time. Teams draw a current-state map by walking the process, identify waste, then design a future-state map with continuous flow, pull and levelled scheduling, and an action plan to get there.
Worked problem
Reading a value stream map
In the map shown, a weekly schedule pushes work to each step. The team proposes a future state in which cutting and welding are combined into a cell with one-piece flow (eliminating the 2-day WIP), the welding-to-assembly buffer is replaced by a kanban loop holding 0.5 days, raw material is delivered twice a week (cutting raw inventory to 2 days) and finished goods are cut to 1 day through level scheduling. Calculate the new lead time and process cycle efficiency.
Show solution
- Current lead time = 5 + 2 + 1.5 + 3 days plus 195 seconds ≈ 11.5 days.
- Future lead time = 2 (raw) + 0 (cell) + 0.5 (kanban) + 1 (finished) ≈ 3.5 days, plus 195 seconds.
- Value-added time is unchanged at 195 seconds.
- Future process cycle efficiency = 195 ÷ (3.5 × 28,800) ≈ 0.19 %, more than three times the current 0.06 %.
Answer: Lead time falls from about 11.5 days to 3.5 days, a 70 % reduction, without speeding up any operation. Inventory and the cash tied up in it fall in proportion.
Continuous improvement and respect for people
Lean is sustained by continuous improvement, or kaizen. Improvement happens daily, as teams solve small problems at the source, and in focused kaizen events, in which a cross-functional team spends three to five days analyzing and redesigning a process. Leaders practise gemba walks, going to the place where work is done to see problems first-hand and ask questions rather than relying on reports. Standard work documents the current best method, takt time and standard WIP for each job; it is not a straitjacket but the baseline from which improvements are made and measured. Visual management, such as boards showing hour-by-hour output against plan, makes problems obvious to everyone.
Respect for people is the other half of the Toyota Way. Lean depends on frontline workers to spot waste and propose improvements, which they will do only if they trust that improvements will not cost them their jobs and that raising problems is welcomed rather than punished. Many lean programs that failed treated lean as a set of tools for cutting staff; successful ones invest in training, involve employees in redesign, and redeploy people freed by improvements to growth or further improvement.
Lean in services and health care
Lean principles apply wherever work flows through steps. Banks have used them to cut mortgage approval times from weeks to days; governments to shorten permit and benefit processing; software teams to deliver features in small batches with kanban boards. In health care, lean has been used to reduce emergency department waits, operating room turnover times, medication errors and laboratory turnaround times. Results vary, and some high-profile programs, including a province-wide initiative in Saskatchewan in the early 2010s, were scaled back after criticism of their cost and approach, a reminder that lean depends on leadership, engagement and adaptation to local conditions rather than imported tools alone.
Services require some adaptation. Customers are often present in the process, demand is variable and less easily levelled, and much of the 'inventory' is people waiting or information in queues. Typical service applications focus on mapping the customer journey, removing unnecessary steps and hand-offs, standardizing routine work, levelling appointment schedules, and making queues and status visible.
The limits of lean and resilience
Lean's low inventories make an operation efficient but also exposed. The 2011 earthquake and tsunami in Japan, the global shortages of semiconductors, medical supplies and consumer goods during the COVID-19 pandemic, port congestion, and trade disputes showed that supply chains running with minimal buffers can stop when a single supplier or route fails. Some commentators declared the end of JIT; a more accurate lesson is that lean principles must be combined with deliberate resilience. Toyota itself had learned from 2011, mapping its supplier network deeply and holding strategic stocks of critical components, which helped it ride out the early chip shortage better than many rivals.
Firms now speak of 'just in case' alongside 'just in time': holding strategic buffers of critical, hard-to-source items, qualifying second sources, nearshoring some production and mapping suppliers several tiers deep, while still removing waste elsewhere. Lesson 12 develops these supply chain resilience strategies.
Common mistakes
MistakeTreating lean as a headcount reduction program.
InsteadUse lean to remove waste and redeploy people; respect for people sustains improvement.
MistakeCutting inventory without fixing the problems it hid.
InsteadLower inventory gradually while removing the causes of variation, breakdowns and defects.
MistakeImplementing 5S and calling the site lean.
InsteadCombine workplace organization with flow, pull, standard work and continuous improvement.
MistakeRunning large batches because set-ups are long.
InsteadReduce set-up times with SMED so small batches become economic.
MistakeRunning pull systems with highly erratic demand and no levelling.
InsteadLevel the schedule (heijunka) so upstream processes see steady demand.
MistakeAssuming lean means no buffers at all.
InsteadHold deliberate buffers for critical, hard-to-source items and map supply risks.
Summary and key terms
- Lean delivers customer value with minimum waste through flow, pull and continuous improvement.
- The Toyota Production System rests on just-in-time and jidoka, supported by standard work, levelling and kaizen.
- The eight wastes are transportation, inventory, motion, waiting, overproduction, overprocessing, defects and unused skills.
- Pull systems such as kanban cap work in process and shorten lead times.
- The number of kanbans is d × L × (1 + s) ÷ C.
- Heijunka levels volume and mix; SMED cuts set-up times so small batches become economic.
- 5S, poka-yoke, jidoka and TPM support stable, high-quality processes.
- Value stream maps reveal that waiting dominates lead time; process cycle efficiency is often below 1 %.
- Lean must be balanced with resilience through strategic buffers and supply chain mapping.
- Lean operations
- An approach that delivers customer value with the least waste through flow, pull and continuous improvement.
- Just-in-time
- Producing only what is needed, when it is needed, in the amount needed.
- Jidoka
- Building in quality by stopping the process at the first sign of a problem.
- Kanban
- A signal, often a card, that authorizes production or movement of a container of parts.
- Pull system
- A system in which downstream demand triggers upstream production.
- Heijunka
- Levelling the volume and mix of production over time.
- SMED
- Single-minute exchange of dies, a method for reducing set-up times.
- 5S
- Sort, set in order, shine, standardize and sustain.
- Poka-yoke
- Error-proofing that prevents mistakes or makes them immediately visible.
- Value stream map
- A diagram of material and information flows with lead time and value-added time.
Practice problems
Work each problem on paper first, then reveal the answer to check.
Name the five lean principles.
Show answer
Value, value stream, flow, pull and perfection.
Classify each waste: a nurse walking to a distant supply room; reports nobody reads.
Show answer
Motion; overproduction.
Why did Ohno consider overproduction the worst waste?
Show answer
It creates other wastes such as inventory, transport and handling and hides problems.
Demand is 600 units a day, lead time 0.25 day, container 25, safety factor 0. How many kanbans?
Show answer
600 × 0.25 ÷ 25 = 6.
What is the difference between internal and external set-up?
Show answer
Internal set-up requires the machine to be stopped; external set-up can be done while it runs.
If set-up cost falls to one-quarter, what happens to the economic batch size?
Show answer
It halves.
Lead time is 20 days and value-added time 2 hours of a 10-hour working day. What is the process cycle efficiency?
Show answer
2 ÷ 200 = 1 %.
Give an example of poka-yoke in a service.
Show answer
An online form that will not submit until required fields are complete.
Why did some firms add strategic inventory after 2020?
Show answer
To protect against supply disruptions that lean, low-buffer supply chains could not absorb.
Portfolio task: walk a process you know and list examples of each of the eight wastes.
Show answer
Answers vary; each waste type with a concrete example.
Lesson quiz · 5 questions
Score 60% or more to complete this lesson.
Create a free account to save your progress, take quizzes and earn a certificate.