
BUS-230 · Lesson 12 of 12 · 38 min
Supply chain management, sustainability and capstone: improving operations
No operation stands alone. A bicycle assembled in Ontario or Oregon may contain a frame welded in Taiwan, gears from Japan, tires from Vietnam and paint from Germany, shipped through ports, rail yards and distribution centres before a courier delivers it to a customer's door. The supply chain is the network of organizations, activities and flows that delivers a product from raw materials to the final customer, and back again for returns and recycling. Supply chain management coordinates those flows of materials, information and money across firms so that the whole chain serves customers at low total cost, with acceptable risk and impact on people and the planet.
This final lesson brings the course together. It covers supply chain structure and strategy, sourcing and supplier relationships, logistics and landed cost, trade and tariffs, the bullwhip effect, resilience, sustainability and laws on forced labour in supply chains, and ends with a capstone in which you apply the tools from every lesson to improve the operations of an invented company. The MBA course MBA-513 treats global supply chains at a more advanced level.
Supply chain structure and strategy
A supply chain includes suppliers (and their suppliers, known as tier 2, tier 3 and so on), manufacturers, distributors, retailers, logistics providers and customers. The SCOR model, maintained by the supply chain association ASCM, organizes supply chain processes into plan, source, make, deliver, return and enable, and provides standard metrics for reliability, responsiveness, agility, cost and asset efficiency. Upstream refers to suppliers; downstream refers to customers.
Supply chain strategy should match the product. Marshall Fisher distinguished functional products, such as groceries and basic tools, which have stable, predictable demand and low margins, from innovative products, such as fashion and new electronics, which have unpredictable demand, short life cycles and high margins. Functional products need efficient supply chains that minimize cost, with high utilization and lean inventories. Innovative products need responsive supply chains that react quickly to demand, with spare capacity, buffer stocks of components, postponement and fast transport. Mismatches, such as an efficient, slow chain for a fast-changing fashion product, produce either stockouts or heavy markdowns.
Sourcing: make or buy, and managing suppliers
The make-or-buy decision asks whether to produce an item internally or buy it. Cost is assessed with break-even analysis: if making requires fixed costs \(F\) and variable cost \(v_m\) per unit, and buying costs \(p\) per unit, buying is cheaper below the volume \(F \div (p - v_m)\). Strategic factors often matter more: whether the activity is a core competency, the need to protect intellectual property, control over quality and delivery, the availability of capable suppliers, and the risk of depending on them. Outsourcing non-core activities can free capital and management attention; outsourcing too much can hollow out the capabilities a firm needs to innovate.
Worked problem
A make-or-buy analysis
A kayak maker buys moulded seats for $20 each. Making them in-house would require a moulding machine and tooling costing $120,000 a year (depreciation, maintenance and an operator) plus $14 per seat in materials and energy. Annual demand is 15,000 seats, expected to grow to 25,000 within three years. Should it make or buy?
Show solution
- Break-even volume = 120,000 ÷ (20 − 14) = 20,000 seats a year.
- At 15,000 seats: buy = $300,000; make = 120,000 + 15,000 × 14 = $330,000; buying is $30,000 cheaper.
- At 25,000 seats: buy = $500,000; make = 120,000 + 350,000 = $470,000; making is $30,000 cheaper.
- Other factors: control over seat quality and design changes favour making; capital, focus and the supplier's expertise favour buying.
Answer: At current volume, buying is cheaper; if growth to 25,000 seats is likely and seat quality matters to the brand, investing in in-house moulding becomes attractive. The decision depends on confidence in the forecast.
Not all purchases deserve the same approach. The Kraljic matrix classifies purchased items by their profit impact and supply risk. Strategic items (high impact, high risk), such as a custom engine or specialized resin, call for close partnerships and joint planning. Leverage items (high impact, low risk), such as standard steel, call for competitive bidding to exploit buying power. Bottleneck items (low impact, high risk), such as a specialty part from a single source, call for securing supply through buffer stock or alternative designs. Routine items (low impact, low risk), such as office supplies, call for simplified, automated buying.
| Category | Profit impact | Supply risk | Typical approach | Example |
|---|---|---|---|---|
| Strategic | High | High | Long-term partnership, joint planning, supplier development | Custom electronic controller |
| Leverage | High | Low | Competitive bidding, volume consolidation | Standard sheet steel, packaging |
| Bottleneck | Low | High | Secure supply: buffer stock, second source, redesign | Specialty fastener from one supplier |
| Routine | Low | Low | Simplify: catalogues, purchasing cards, automation | Office supplies, cleaning products |
Supplier selection uses the factor-rating method from lesson 2, with criteria such as total cost, quality (certifications such as ISO 9001 and measured defect rates), delivery reliability, capacity, financial stability, technical capability, location and risk, and environmental and social performance. Supplier relationships range from arm's-length transactions to long-term partnerships with shared forecasts, joint improvement projects and supplier development programs. Supplier scorecards track performance over time. Single sourcing simplifies relationships and can deepen collaboration but concentrates risk; dual or multiple sourcing spreads risk at some cost in scale and coordination.
Logistics and landed cost
Logistics moves and stores goods through the supply chain. The choice of transport mode trades cost against speed, reliability and flexibility. Third-party logistics providers (3PLs) operate warehouses and transport for many firms, and freight forwarders and customs brokers arrange international shipments. Warehousing decisions include the number and location of distribution centres (lesson 5) and practices such as cross-docking, in which inbound goods are sorted and loaded onto outbound trucks with little or no storage.
| Mode | Relative cost per unit of distance | Speed | Best suited to |
|---|---|---|---|
| Ocean shipping | Lowest | Slowest (weeks for intercontinental routes) | Large volumes of non-urgent goods between continents |
| Rail | Low | Moderate | Heavy, bulky goods over long land distances, intermodal containers |
| Truck | Moderate | Fast and flexible | Door-to-door delivery, regional and cross-border freight |
| Air | Highest | Fastest | High-value, urgent or perishable goods |
| Pipeline | Very low once built | Continuous | Oil, natural gas and some chemicals |
Decisions about sourcing locations should compare total landed cost, not just the purchase price. Landed cost includes the purchase price, freight, insurance, duties and tariffs, customs brokerage and fees, the cost of carrying pipeline inventory during long transit times (lesson 9), extra safety stock to cover longer and less reliable lead times, quality costs and the risks of disruption. Studies of reshoring decisions repeatedly find that firms that compared only unit prices underestimated the true cost of distant suppliers.
Worked problem
Comparing landed cost (illustrative figures)
An importer can buy a pump housing from a North American supplier at $40.00 (CUSMA-qualifying, so no duty), with freight $3.00, insurance $0.20, brokerage $0.50 and 10 days in transit; or from an overseas supplier at $32.00, with freight $5.00, insurance $0.30, a duty of 8 % on the $32 price, brokerage $0.50, 60 days in transit and an extra $0.90 per unit of safety stock cost. Inventory carrying cost is 25 % a year. Compare landed costs, and test the effect of an additional 25 % tariff on the overseas part.
Show solution
- Nearby carrying cost in transit = 40 × 0.25 × 10 ÷ 365 ≈ $0.27; landed cost = 40 + 3 + 0.20 + 0 + 0.50 + 0.27 ≈ $43.97.
- Overseas duty = 0.08 × 32 = $2.56; carrying cost = 32 × 0.25 × 60 ÷ 365 ≈ $1.32.
- Overseas landed cost = 32 + 5 + 0.30 + 2.56 + 0.50 + 1.32 + 0.90 ≈ $42.58, only $1.39 (about 3 %) below the nearby option despite a 20 % lower price.
- With an extra 25 % tariff on the $32 price (+$8.00), the overseas landed cost rises to about $50.58, now $6.61 more than the nearby part.
Answer: A 20 % price advantage shrinks to about 3 % on a landed-cost basis, and disappears under a tariff increase. Given trade uncertainty, the nearby supplier may be the safer choice even before quality and responsiveness are counted.
Trade agreements and tariffs
Tariffs and trade rules have become central to supply chain decisions in North America. The Canada–United States–Mexico Agreement (CUSMA, called USMCA in the United States), in force since 2020, allows qualifying goods to cross the three borders duty-free. To qualify, goods must meet rules of origin, which for many products require that a minimum share of value or specified processing occur within the region; automobiles, for example, face regional value content rules for vehicles and core parts and rules on steel, aluminum and wages. Importers must hold documentation to support claims of origin, and customs authorities audit them. The agreement provides for a joint review by the three countries in 2026, adding uncertainty for long-term investments.
Since early 2025, trade between Canada and the United States has been disrupted by successive rounds of US tariffs and Canadian countermeasures, and the rules have changed frequently. In February 2026, the US Supreme Court ruled that the International Emergency Economic Powers Act does not authorize tariffs, striking down one set of measures, but the US government has continued to impose tariffs under other trade laws. As of late September 2026, the Trade Commissioner Service summarized US tariffs on Canadian goods as including national security tariffs under Section 232 on steel, aluminum and copper products (15 to 50 %, applied to the full value of covered goods), on autos and trucks (25 %, with US content in CUSMA-compliant vehicles exempt), on softwood lumber and on several other product groups, plus broader tariffs under other statutes, some of which exempt CUSMA-qualifying goods and some of which do not. Canada applied new counter-tariffs on targeted US products from September 8, 2026, alongside earlier countermeasures on US light vehicles. Because rates and exemptions change often, operations managers should check Finance Canada, the Canada Border Services Agency and the Trade Commissioner Service before making sourcing decisions, and use landed-cost scenarios rather than a single tariff assumption.
The bullwhip effect
The bullwhip effect is the tendency for the variability of orders to increase as one moves upstream in a supply chain. Consumer demand for a product may be fairly steady, yet the retailer's orders to the wholesaler vary more, the wholesaler's orders to the manufacturer vary more still, and the manufacturer's orders to its suppliers swing wildly. Procter & Gamble famously found that orders for diapers swung far more than babies' use of them. The MIT 'beer game', a classroom simulation of a four-stage supply chain, reproduces the effect almost every time it is played.
Four main causes have been identified. Demand signal processing: each stage forecasts from the orders it receives and adjusts safety stock and order-up-to levels, amplifying changes. Order batching: ordering in large, infrequent batches to save ordering or transport costs turns smooth demand into lumpy orders. Price fluctuations: promotions and discounts encourage forward buying, creating artificial peaks and troughs. Rationing and shortage gaming: when supply is short, customers inflate orders to get a bigger share of rationed supply, then cancel when supply recovers, as happened with many goods during the pandemic.
import random, statistics as st
random.seed(230)
# Bullwhip effect: four stages each forecast with a 4-period moving average
# and use an order-up-to policy with a 2-period lead time.
T, L, N = 200, 2, 4
demand = [max(0, round(random.gauss(100, 10))) for _ in range(T)]
stages = ["retailer", "wholesaler", "distributor", "factory"]
incoming = demand
print(f"{'stage':<12}{'orders placed: std dev':>24}{'ratio to demand':>17}")
print(f"{'customers':<12}{st.pstdev(demand[20:]):>24.1f}{1:>17.2f}")
for s in stages:
    orders, prev_target = [], None
    for t in range(T):
        hist = incoming[max(0, t - N + 1):t + 1]
        target = (L + 1) * sum(hist) / len(hist)          # order-up-to level
        order = incoming[t] + (target - prev_target if prev_target is not None else 0)
        orders.append(max(0, order)); prev_target = target
    sd = st.pstdev(orders[20:])
    print(f"{s:<12}{sd:>24.1f}{sd / st.pstdev(demand[20:]):>17.2f}")
incoming = ordersstage orders placed: std dev ratio to demand customers 9.9 1.00 retailer 18.9 1.91 wholesaler 40.2 4.07 distributor 78.5 7.95 factory 145.3 14.71
In the simulation, customer demand is steady, varying randomly around 100 units a period. Each stage behaves sensibly by its own lights, forecasting from recent orders and keeping enough stock to cover the lead time, yet the variability of orders roughly doubles at each stage, so the factory sees order swings more than fourteen times as large as the swings in consumer demand. Nothing in the consumer market caused those swings; they are created by the structure of the chain.
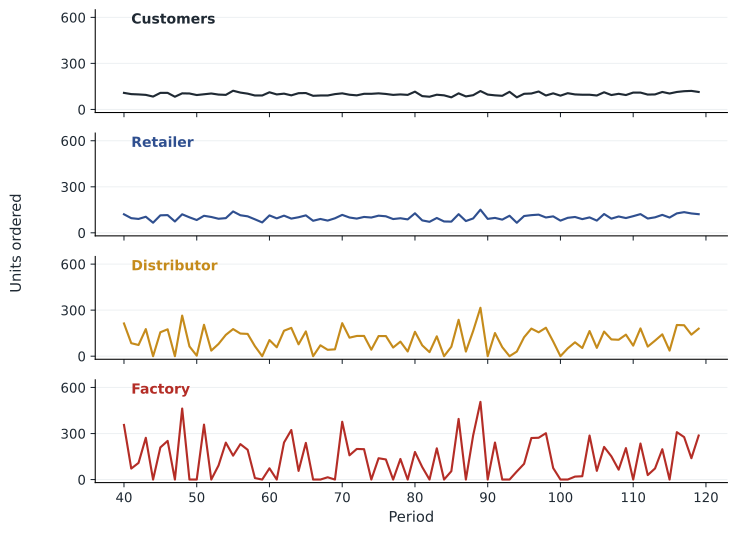
Remedies address the causes. Sharing point-of-sale data and inventory positions across the chain lets upstream firms see real demand rather than inferring it from orders; vendor-managed inventory and CPFR (lessons 6 and 9) go further. Shorter lead times reduce the amplification from forecasting. Smaller, more frequent orders, made economic by lower ordering costs and mixed truckloads, reduce batching. Everyday low pricing reduces forward buying. Allocating scarce supply by past sales rather than current orders discourages shortage gaming.
Supply chain risk and resilience
Recent years have provided a crash course in supply chain risk: a pandemic, semiconductor shortages, a container ship blocking the Suez Canal, war in Ukraine, attacks on Red Sea shipping, drought-restricted traffic in the Panama Canal, wildfires and floods that cut rail lines in western Canada, cyberattacks on logistics firms and abrupt tariff changes. Supply chain resilience is the ability to prepare for, absorb, adapt to and recover from such disruptions. It begins with visibility: mapping suppliers several tiers deep to find hidden concentrations, such as many tier 1 suppliers depending on the same tier 3 chip maker.
Useful measures include time to recover (how long a supplier or site would take to return to full operation after a disruption) and time to survive (how long the firm could continue meeting demand without that supplier, using inventory and alternatives). Where time to recover exceeds time to survive, the firm is exposed and should act. Strategies include holding strategic buffer stock of critical items, qualifying second sources in different regions, designing products to use common or substitutable components, building flexible capacity that can switch between products, nearshoring, and agreeing contingency plans with key suppliers. Resilience costs money, so firms focus it on the items and suppliers whose failure would do the most damage, a natural application of the Kraljic matrix.
Sustainability in supply chains
For most companies, the largest share of environmental impact lies outside their own walls. The Greenhouse Gas Protocol divides emissions into Scope 1 (direct emissions from sources the company owns or controls, such as its boilers and vehicles), Scope 2 (indirect emissions from purchased electricity, steam, heating and cooling) and Scope 3 (all other indirect emissions in the value chain, including purchased goods, transport, business travel, use of sold products and end-of-life treatment). For many manufacturers and retailers, Scope 3 accounts for the large majority of total emissions, so reducing emissions means working with suppliers and customers.
Disclosure expectations are evolving. In Canada, the Canadian Sustainability Standards Board published Canadian versions of the international sustainability and climate disclosure standards in December 2024 for voluntary use, while securities regulators paused work on mandatory climate disclosure rules in 2025; federally regulated banks and insurers face climate risk expectations from their regulator, OSFI. Many large Canadian companies report Scope 1, 2 and some Scope 3 emissions voluntarily or because customers, lenders and investors ask. Operations levers include energy efficiency, electrification and clean power, lighter and recyclable packaging, fuller trucks and modal shifts from truck to rail, supplier emissions targets, and designing products for repair, reuse and recycling, the circular economy.
Reverse logistics manages the flow of products back from customers for returns, repair, refurbishment, remanufacturing and recycling. Returns are a major cost in e-commerce, and extended producer responsibility rules in many jurisdictions require producers to fund the collection and recycling of packaging, electronics and other products. Well-designed reverse supply chains can recover significant value, as with remanufactured engines and refurbished phones.
Forced labour and human rights in supply chains
The International Labour Organization estimates that tens of millions of people are in forced labour worldwide, many in supply chains for goods such as cotton, electronics, solar panels, seafood and agricultural products. Governments increasingly require companies to look beyond their tier 1 suppliers.
| Measure | What it requires | Operations implications |
|---|---|---|
| Fighting Against Forced Labour and Child Labour in Supply Chains Act (in force 2024) | Large entities and government institutions report each year, by May 31, on steps taken to prevent and reduce the risk of forced and child labour in their supply chains; fines for non-compliance can reach $250,000 | Map suppliers, assess risk, add contract clauses, train buyers and track remediation |
| Customs Tariff import prohibition (since 2020) | Goods mined, manufactured or produced wholly or partly by forced labour are prohibited from import | Shipments can be detained; importers need traceability evidence |
| US rules affecting Canadian exporters | The US Uyghur Forced Labor Prevention Act presumes goods made in Xinjiang or by listed entities use forced labour | Canadian exporters to the US must trace inputs such as cotton, polysilicon and aluminum |
In practice, compliance requires supply chain mapping, risk assessment by country and commodity, supplier codes of conduct, audits and worker interviews, traceability systems, grievance mechanisms, and plans to remediate problems rather than simply cutting off suppliers. These are operations capabilities as much as legal ones.
Capstone: improving operations at Lakeshore Paddle Co.
The capstone applies the course to one invented company. Lakeshore Paddle Co. makes recreational kayaks by rotational moulding: plastic resin is heated in a rotating mould in an oven, cooled, trimmed and fitted with seats, hatches and deck lines. It sells through outdoor retailers and online. Demand is strongly seasonal, peaking in spring. Its performance has slipped: on-time delivery to retailers is 78 %, average order lead time is six weeks, inventory turns only four times a year, warranty returns are 5 % of units, and margins are falling because of overtime and expedited freight in the peak season. Resin comes from a single overseas supplier, and the firm's largest market is across the border, so tariffs are a concern.
Worked problem
Capstone diagnosis and plan
Using data gathered by a student consulting team, diagnose Lakeshore's problems and recommend improvements. Key data: the oven takes 12 minutes per kayak, trimming 9 minutes and fitting 10 minutes, each with one station, running two 8-hour shifts; peak demand is 95 kayaks a day and annual demand 12,000; mould changeovers take 90 minutes and the oven runs 6 models in weekly batches; returns are 46 % hatch leaks, 28 % hull blemishes, 26 % other; quarterly demand indices are 1.6, 1.3, 0.6 and 0.5; resin lead time is 10 weeks.
Show solution
- Process analysis (lessons 3 and 4): oven capacity = 60 ÷ 12 × 16 hours = 80 kayaks a day, the bottleneck; trimming (106) and fitting (96) have spare capacity. Peak demand of 95 a day exceeds oven capacity by about 19 %.
- Lean (lesson 11): applying SMED to mould changes (preheating moulds, standard clamps) cuts changeovers from 90 to about 25 minutes, recovering oven time and allowing smaller, levelled batches of each model instead of weekly batches.
- Capacity (lesson 4): a second oven arm or a third weekday shift on the oven alone in the peak season would lift effective capacity above 95 a day; a decision tree comparing a second oven with seasonal shifts should include demand uncertainty.
- Forecasting and planning (lessons 6 and 10): with seasonal indices of 1.6 and 1.3 in the first two quarters, a level production plan that builds inventory in quarters 3 and 4 can cover the spring peak without overtime, agreed monthly through S&OP with sales.
- Quality (lessons 7 and 8): a Pareto analysis puts hatch leaks first; a fishbone and capability study of the hatch rim moulding, followed by poka-yoke fixtures for hatch fitting, targets most returns; control charts on oven temperature address blemishes.
- Inventory and supply chain (lessons 9 and 12): ABC analysis focuses safety stock on resin and hatches; landed-cost scenarios under tariff changes, plus the 10-week single-source resin lead time, justify qualifying a second, North American resin supplier.
- Sustainability: oven energy per kayak and scrap rates are tracked, and trim scrap is reground into resin for non-visible parts.
Answer: The oven is the binding constraint and quality problems are concentrated in two causes. Set-up reduction, levelled production with seasonal build-ahead, targeted quality fixes and a second resin source address the main problems at modest cost; a second oven should be evaluated only after these quicker gains are measured.
| Measure | Current | Target after 12 months | Main levers |
|---|---|---|---|
| On-time delivery to retailers | 78 % | 95 % | Oven capacity, levelled schedule, S&OP |
| Order lead time | 6 weeks | 2 weeks | Smaller batches, WIP limits, finished-goods buffer |
| Inventory turnover | 4 | 6 | Smaller batches, ABC policies, better forecasts |
| Warranty return rate | 5 % | 2 % | Hatch fixture, rim capability, oven SPC |
| Peak-season overtime and expedited freight | High | Halved | Level plan with build-ahead |
| Resin supply risk | Single overseas source | Two qualified sources | Supplier development, landed-cost scenarios |
A strong capstone report states the problem with data, shows the analysis behind each recommendation, quantifies expected benefits and costs, sequences actions (quick wins first, then capital investments), names owners and measures, and notes the risks and assumptions. It also recognizes the trade-offs that run through this course: cost versus responsiveness, efficiency versus resilience, standardization versus flexibility, and short-term savings versus long-term capability. Operations management is the discipline of making those trade-offs deliberately, measuring the results and improving continuously.
Common mistakes
MistakeChoosing suppliers on unit price alone.
InsteadCompare total landed cost, quality, reliability and risk.
MistakeUsing the same supply chain design for every product.
InsteadMatch efficient chains to functional products and responsive chains to innovative products.
MistakeReacting to every change in orders with bigger changes in your own orders.
InsteadShare demand data, shorten lead times and order in smaller batches to dampen the bullwhip effect.
MistakeAssuming tier 1 suppliers are the only risk.
InsteadMap suppliers several tiers deep to find hidden dependencies.
MistakePlanning around a single tariff assumption.
InsteadRun landed-cost scenarios for several trade outcomes.
MistakeTreating forced-labour compliance as paperwork.
InsteadBuild traceability, supplier engagement and remediation into sourcing processes.
Summary and key terms
- Supply chain management coordinates material, information and money flows across firms.
- Efficient supply chains suit functional products; responsive chains suit innovative products.
- Make-or-buy decisions combine break-even analysis with strategic factors.
- The Kraljic matrix tailors purchasing approaches to profit impact and supply risk.
- Total landed cost includes freight, duties, tariffs, pipeline and safety stock and risk, not just price.
- CUSMA rules of origin and frequently changing tariffs require scenario analysis.
- The bullwhip effect amplifies order variability upstream; information sharing and shorter lead times dampen it.
- Resilience requires multi-tier visibility, buffers, second sources and flexible capacity.
- Scope 3 emissions and forced-labour laws extend operations responsibility deep into the supply chain.
- Supply chain
- The network of organizations and flows that delivers a product from raw materials to customers.
- SCOR model
- A reference model organizing supply chain processes into plan, source, make, deliver, return and enable.
- Make-or-buy decision
- The choice between producing an item internally or buying it from a supplier.
- Kraljic matrix
- A tool classifying purchases by profit impact and supply risk.
- Landed cost
- The total cost of a purchased item delivered to the buyer's location.
- Rules of origin
- Criteria that determine whether goods qualify for preferential treatment under a trade agreement.
- Bullwhip effect
- The increase in order variability as one moves upstream in a supply chain.
- Time to recover
- The time a supplier or site would take to return to full operation after a disruption.
- Scope 3 emissions
- Indirect greenhouse gas emissions in a company's value chain outside Scopes 1 and 2.
- Reverse logistics
- Managing the flow of products back from customers for return, repair or recycling.
Practice problems
Work each problem on paper first, then reveal the answer to check.
Give an example of a functional and an innovative product and the supply chain each needs.
Show answer
Toothpaste: efficient chain; a new gaming console: responsive chain.
Making costs $50,000 a year plus $8 a unit; buying costs $13. Find the break-even volume.
Show answer
10,000 units.
Classify in the Kraljic matrix: a single-source specialty sensor that is cheap but essential.
Show answer
Bottleneck item.
Name four elements of landed cost besides the purchase price.
Show answer
Freight, duties, carrying cost of pipeline inventory and safety stock (also insurance, brokerage, risk).
A part costs $20 and spends 45 days in transit; carrying cost is 30 % a year. What is the pipeline carrying cost per unit?
Show answer
20 × 0.30 × 45 ÷ 365 ≈ $0.74.
Name the four causes of the bullwhip effect.
Show answer
Demand signal processing, order batching, price fluctuations and shortage gaming.
A supplier would take 12 weeks to recover from a fire; the firm could survive 4 weeks without it. What should the firm do?
Show answer
Act: build buffer stock, qualify a second source or redesign, because time to recover exceeds time to survive.
Classify as Scope 1, 2 or 3: fuel in company trucks; purchased electricity; emissions from making purchased steel.
Show answer
Scope 1; Scope 2; Scope 3.
What does the rebuttable presumption in the UFLPA mean for importers?
Show answer
Goods linked to Xinjiang or listed entities are presumed to involve forced labour unless the importer proves otherwise.
Portfolio task: write a two-page operations improvement plan for an organization you know, using at least four tools from this course.
Show answer
Answers vary; include data, analysis, recommendations, targets and owners.
Lesson quiz · 5 questions
Score 60% or more to complete this lesson.
Create a free account to save your progress, take quizzes and earn a certificate.