
BIOL-367 · Lesson 3 of 12 · 28 min
The global state of biodiversity and extinction
How fast is biodiversity being lost? The question sounds simple but answering it requires careful thought about what is being measured. Extinction counts the complete loss of species, which is final but slow to document. Population declines measure changes in abundance, which happen faster and matter more for ecosystems but are harder to aggregate. Extinction risk assessments estimate how likely species are to be lost in the future. This lesson examines the three main global yardsticks, the Living Planet Index, the IUCN Red List and estimates of extinction rates, together with the major global assessments that synthesize them, and then looks at the status of species in Canada and the United States.
The IPBES global assessment
In 2019 the Intergovernmental Science-Policy Platform on Biodiversity and Ecosystem Services (IPBES), an independent body with more than 140 member states that plays a role for biodiversity similar to that of the Intergovernmental Panel on Climate Change for climate, published its Global Assessment Report on Biodiversity and Ecosystem Services. Prepared by about 145 expert authors drawing on some 15,000 sources, including Indigenous and local knowledge, it remains the most comprehensive synthesis of the state of nature. Its headline findings were that about one million animal and plant species, out of an estimated eight million, are threatened with extinction, many within decades; that human actions have significantly altered about 75 per cent of the land surface and 66 per cent of the ocean area; that more than 85 per cent of wetland area present in 1700 had been lost by 2000; and that the global rate of species extinction is already at least tens to hundreds of times higher than the average over the past ten million years and is accelerating.
The assessment ranked the direct drivers of change. On land, changes in land and sea use, mostly the expansion of agriculture, had the largest impact; in the ocean, direct exploitation, mainly fishing, came first. Climate change, pollution and invasive alien species followed. These direct drivers are in turn driven by indirect drivers: population growth, consumption, trade, technology and governance. The report concluded that business as usual would not meet global goals, but that transformative change across economic, social, political and technological factors could still reverse declines.
The Living Planet Index
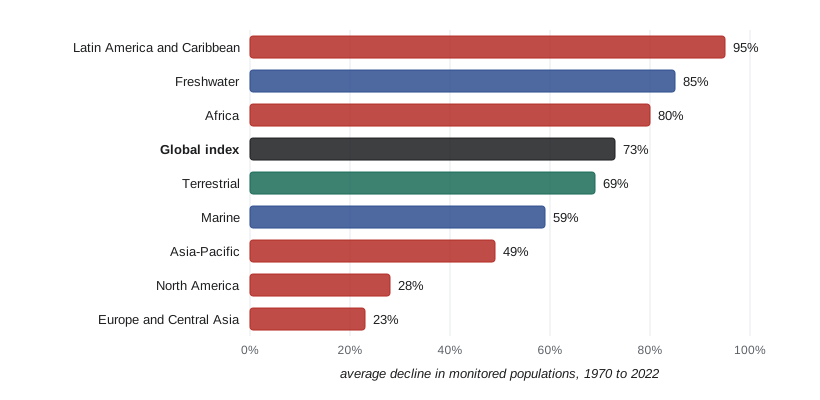
The Living Planet Index (LPI), maintained by the Zoological Society of London and published every two years by WWF in the Living Planet Report, tracks the average change in the size of monitored populations of vertebrates: mammals, birds, reptiles, amphibians and fishes. The 2026 report, released in October 2026, found an average decline of about 73 per cent in monitored populations between 1970 and 2022, roughly 2.5 per cent a year on average. Freshwater populations showed the steepest decline, about 85 per cent, followed by terrestrial populations at about 69 per cent and marine populations at about 59 per cent. Among regions, Latin America and the Caribbean showed the largest average decline, about 95 per cent, and Africa about 80 per cent, while North America showed about 28 per cent and Europe and Central Asia about 23 per cent.
The LPI is often misreported as meaning that 73 per cent of all wild animals have disappeared. It does not mean that. The index is the geometric mean of population trends: it averages the relative change in each monitored population, so a population that falls from 100 to 10 animals and one that falls from 1,000,000 to 100,000 count equally. It is therefore an index of the average rate of change, not a measure of total animal numbers lost. The 2026 report also noted that about half of the monitored populations were stable or increasing; the average decline is driven by populations that have fallen steeply. And the index is biased toward well-studied regions and groups, since it can include only populations with repeated counts. Smaller regional declines in North America and Europe do not mean those ecosystems are healthy; much of their wildlife had already been lost before 1970, the baseline year.
import math
# How the Living Planet Index aggregates trends: the geometric mean of relative change.
# Five invented populations counted in 1970 and 2022.
pops = {"large fish stock": (2_000_000, 1_500_000), "frog A": (400, 20),
        "songbird": (12_000, 6_000), "river turtle": (900, 90), "seal colony": (3_000, 4_500)}
ratios = [end / start for start, end in pops.values()]
for (name, (s, e)), r in zip(pops.items(), ratios):
    print(f"{name:17s} {s:>10,} -> {e:>10,}  ratio {r:5.2f}")
geo = math.exp(sum(math.log(r) for r in ratios) / len(ratios))
total_start = sum(s for s, e in pops.values()); total_end = sum(e for s, e in pops.values())
print(f"index (geometric mean of ratios): {geo:.3f}, an average decline of {1 - geo:.0%}")
print(f"change in total individuals: {total_end / total_start:.3f}, a decline of {1 - total_end / total_start:.0%}")large fish stock 2,000,000 -> 1,500,000 ratio 0.75 frog A 400 -> 20 ratio 0.05 songbird 12,000 -> 6,000 ratio 0.50 river turtle 900 -> 90 ratio 0.10 seal colony 3,000 -> 4,500 ratio 1.50 index (geometric mean of ratios): 0.309, an average decline of 69% change in total individuals: 0.749, a decline of 25%
In this invented example the index shows an average decline of about 70 per cent, because three of the five populations fell steeply, yet the total number of animals fell by only about a quarter, because the largest population, a fish stock, declined modestly. Neither number is wrong; they answer different questions. The LPI asks how populations are faring on average, which is a sensitive warning signal. Total abundance asks how much wildlife is left, which matters for ecosystem function. Both are needed.
The IUCN Red List
The IUCN Red List of Threatened Species, maintained by the International Union for Conservation of Nature since 1964, is the world's most widely used system for assessing extinction risk. Since 1994 it has used quantitative criteria, revised in 2001, that can be applied to any species except microorganisms. The July 2026 update listed 175,909 assessed species, of which 49,505, about 28 per cent, were classified as threatened with extinction. Assessments are far from complete: only a small fraction of described species have been assessed, and coverage is much better for vertebrates and some plant groups than for insects and fungi. Nonetheless the Red List shows that about 41 per cent of amphibians, about a quarter of mammals, about 44 per cent of reef-building corals, more than a third of sharks and rays, and about one in eight birds are threatened.
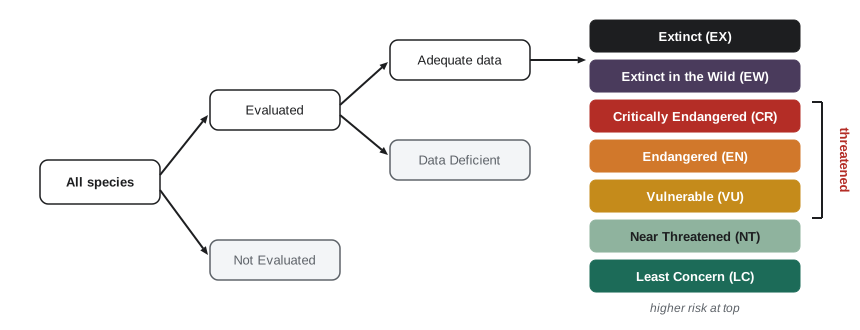
The Red List places each assessed species in one of nine categories. Extinct (EX) means there is no reasonable doubt that the last individual has died. Extinct in the Wild (EW) means the species survives only in cultivation, captivity or as a naturalized population outside its past range. Critically Endangered (CR), Endangered (EN) and Vulnerable (VU) are the three threatened categories, indicating extremely high, very high and high risk of extinction in the wild. Near Threatened (NT) species are close to qualifying, Least Concern (LC) species are widespread and abundant, Data Deficient (DD) species lack enough information for an assessment, and Not Evaluated (NE) species have not been assessed.
The five criteria
A species qualifies for a threatened category if it meets any one of five criteria, labelled A to E. The thresholds for each criterion differ among the three threatened categories, and an assessment uses the highest category for which any criterion is met.
| Criterion | What it measures | Critically Endangered | Endangered | Vulnerable |
|---|---|---|---|---|
| A. Population reduction | Decline over 10 years or 3 generations, whichever is longer (A2 to A4: causes may not have ceased) | ≥ 80% | ≥ 50% | ≥ 30% |
| B. Geographic range | Extent of occurrence (B1) or area of occupancy (B2), plus at least two of: severe fragmentation or few locations, continuing decline, extreme fluctuations | EOO < 100 km² or AOO < 10 km² | EOO < 5,000 km² or AOO < 500 km² | EOO < 20,000 km² or AOO < 2,000 km² |
| C. Small population and decline | Number of mature individuals with continuing decline | < 250 | < 2,500 | < 10,000 |
| D. Very small population | Number of mature individuals (or, for VU, very restricted AOO or few locations) | < 50 | < 250 | < 1,000 |
| E. Quantitative analysis | Probability of extinction in the wild, for example from a population viability analysis | ≥ 50% in 10 years or 3 generations | ≥ 20% in 20 years or 5 generations | ≥ 10% in 100 years |
For criterion A1, which applies when the causes of decline are understood, reversible and have ceased, the thresholds are higher: 90, 70 and 50 per cent. Criterion A uses generation length because a decline of 30 per cent over ten years is far more serious for a long-lived tortoise, whose generation time may be several decades, than for a mouse; using three generations scales the time window to the species' biology, up to a maximum of 100 years. Criterion B targets species with small ranges that are also fragmented or declining; extent of occurrence is the area of the smallest convex polygon containing all known sites, while area of occupancy is the area actually occupied, measured on a grid of 2 kilometre by 2 kilometre cells. Criterion E is used rarely, because it requires a population model good enough to estimate the probability of extinction, a topic for lesson 6.
import math
# Criterion A2: estimate the decline over three generations from survey counts.
# Invented counts of mature individuals of a long-lived turtle; generation length 25 years.
years = [1990, 1996, 2001, 2007, 2012, 2018, 2024]
counts = [3100, 2850, 2400, 2200, 1900, 1650, 1500]
gen = 25
window = max(10, 3 * gen)                       # 75 years
# least-squares fit of log(count) on year gives an exponential rate of change
n = len(years); xm = sum(years) / n; ym = sum(math.log(c) for c in counts) / n
slope = sum((x - xm) * (math.log(c) - ym) for x, c in zip(years, counts)) / sum((x - xm) ** 2 for x in years)
print(f"estimated rate of change: {slope * 100:.2f}% per year (exponential)")
decline = 1 - math.exp(slope * window)
print(f"projected decline over {window} years (3 generations): {decline:.0%}")
cat = "CR" if decline >= 0.8 else "EN" if decline >= 0.5 else "VU" if decline >= 0.3 else "not threatened under A"
print("criterion A2 category:", cat)estimated rate of change: -2.23% per year (exponential) projected decline over 75 years (3 generations): 81% criterion A2 category: CR
The surveys cover 34 years, less than half of the 75-year assessment window, so the decline must be projected using an assumed model, here an exponential decline at a constant rate. The IUCN guidelines allow such projections, including combinations of past and future periods (criterion A4), but the choice of model matters: if the decline were linear rather than exponential, the projection would differ. Here the projected decline of about 81 per cent lies just above the Critically Endangered threshold of 80 per cent, so a slightly different model or a few more years of data could move the species to Endangered; assessors document such assumptions and often report a range of plausible categories, here EN to CR. Note also that a decline of about half over 34 years would look serious on any time scale, but it is the three-generation window that places this species in a high category.
Extinction rates
How does the present rate of extinction compare with the past? Paleontologists estimate that the average lifespan of a species in the fossil record is about one to ten million years, which implies a background extinction rate of roughly 0.1 to 1 extinction per million species per year, often written E/MSY. With about 8 million species, a background rate of 1 E/MSY would mean about eight extinctions a year worldwide. Since 1500, more than 900 species have been documented as extinct by the IUCN, and the true number is certainly far higher because most species are unknown and extinctions are hard to confirm. For well-studied groups such as birds and mammals, studies such as those of Stuart Pimm and colleagues in 2014 and Gerardo Ceballos and colleagues in 2015 estimated current extinction rates at roughly 100 to 1,000 times the background rate.
Earth has experienced five mass extinctions, events in which roughly three quarters or more of species disappeared within a geologically short time, most recently at the end of the Cretaceous 66 million years ago. Many scientists argue that a sixth mass extinction is under way or imminent. Others caution that current documented losses, while alarming, are still far smaller than the past mass extinctions, and that the term should be used carefully; but they agree that the rate of loss is far above background and that if current trends continue, losses would reach mass-extinction levels within centuries. The distinction matters less than the trajectory, and the trajectory can still be changed.
A further complication is extinction debt, a term introduced by David Tilman and colleagues in 1994. When habitat is destroyed, some species do not disappear immediately; they persist for decades or centuries in populations that are no longer viable. Their eventual extinction is a debt that has already been incurred. Extinction debt means that today's extinctions reflect habitat loss that happened long ago, and that the full consequences of recent losses have not yet appeared. It also offers an opportunity: species in debt still exist and can sometimes be saved by restoring habitat in time.
North American losses
North America has its own record of extinctions since European colonization. The great auk, a flightless seabird of the North Atlantic, was hunted to extinction by 1844; the last known birds were killed off Iceland, but large colonies had existed on Funk Island off Newfoundland. The Labrador duck disappeared by about 1878. The passenger pigeon, once probably the most abundant bird in North America with a population in the billions, was reduced by market hunting and forest clearing; the last individual, named Martha, died in the Cincinnati Zoo in 1914. The Carolina parakeet, the only parrot native to the eastern United States, followed in 1918. Freshwater species have fared especially badly: dozens of species of freshwater mussels, snails and fishes in the southeastern United States have disappeared as rivers were dammed and polluted.
In Canada, COSEWIC has assessed several species as extinct, including the great auk, Labrador duck, passenger pigeon, sea mink, deepwater cisco of the Great Lakes, blue walleye, Banff longnose dace and eelgrass limpet, and many more as extirpated, meaning they no longer exist in the wild in Canada but survive elsewhere. Examples of extirpated species include the greater prairie-chicken, the paddlefish and, at times, the black-footed ferret and swift fox, both later reintroduced. Canada's periodic Wild Species reports on the general status of species, prepared jointly by federal, provincial and territorial governments, have found that roughly one in five assessed species is at some level of risk nationally, while most species in the country's vast northern regions remain secure.
Signs of hope
Global status assessments are not uniformly grim. The Red List includes many species whose status has improved because of conservation action, and a 2024 study in Science by Penny Langhammer and colleagues, a meta-analysis of 186 studies, found that conservation interventions improved the state of biodiversity or slowed its decline in about two thirds of cases, compared with no action. Examples include the recovery of the bald eagle and peregrine falcon after DDT was banned, the return of humpback whales after commercial whaling ended, and the improvement of the numbat in Australia from Endangered to Near Threatened in the 2026 Red List update after programs to control introduced cats and foxes. The message of the global assessments is not that conservation fails, but that it has been applied at too small a scale relative to the pressures.
Worked problem
Applying criterion D and C together
A plant is known from four sites with a combined total of 180 mature individuals. Counts over two generations show a continuing decline of about 15 per cent. Which threatened category, if any, does it qualify for under criteria C and D?
Show solution
- Criterion D: fewer than 250 mature individuals qualifies as Endangered (fewer than 50 would be Critically Endangered).
- Criterion C: fewer than 250 mature individuals with continuing decline also meets the Critically Endangered threshold for population size, but the CR subcriteria require either a decline of at least 25 per cent in one generation or a specific population structure.
- Without information on subpopulation structure, C1 for CR (25 per cent in one generation) is not met, but C1 for EN (20 per cent in two generations) is close and C2 conditions should be checked.
- The species therefore qualifies as at least Endangered under D, and further data on subpopulation sizes could raise it to Critically Endangered under C2.
Answer: At least Endangered (criterion D). Red List assessments use the highest category met by any criterion, so the assessor should check C2 before finalizing.
Common mistakes
MistakeReading the Living Planet Index as the share of all animals lost.
InsteadIt is the average relative change across monitored populations; total abundance can change by a different amount.
MistakeAssuming documented extinctions measure real losses.
InsteadMost species are undescribed and extinctions are hard to confirm, so documented totals are large underestimates.
MistakeUsing a fixed ten-year window for every species under criterion A.
InsteadUse ten years or three generations, whichever is longer, up to 100 years.
MistakeThinking a species is safe once its decline stops.
InsteadExtinction debt means populations below viable size may still disappear decades later.
MistakeConcluding that global trends prove conservation does not work.
InsteadMeta-analyses show most interventions help; the problem is scale relative to pressures.
Summary and key terms
- The 2019 IPBES assessment found about one million species threatened and identified land and sea use change as the top direct driver.
- The 2026 Living Planet Index reported an average 73 per cent decline in monitored vertebrate populations from 1970 to 2022, steepest in freshwater and Latin America.
- The LPI is a geometric mean of population trends, not a count of animals lost.
- The July 2026 Red List update assessed 175,909 species and classed 49,505 as threatened.
- Red List criteria A to E use population reduction, range, small population size with decline, very small size and quantitative risk.
- Current extinction rates for well-studied groups are roughly 100 to 1,000 times background; extinction debt delays losses.
- Conservation actions have improved outcomes in most evaluated cases, but at insufficient scale.
- IPBES
- The Intergovernmental Science-Policy Platform on Biodiversity and Ecosystem Services.
- Living Planet Index
- An index of the average change in monitored vertebrate population sizes since 1970.
- IUCN Red List
- The global inventory of extinction risk for assessed species.
- threatened
- In the Red List, a species classed as Critically Endangered, Endangered or Vulnerable.
- extent of occurrence
- The area of the smallest polygon enclosing all known sites of a species.
- area of occupancy
- The area actually occupied by a species, measured on a standard grid.
- generation length
- The average age of parents of the current cohort, used to scale Red List time windows.
- background extinction rate
- The typical rate of extinction in the fossil record, roughly 0.1 to 1 E/MSY.
- extinction debt
- Future extinctions already set in motion by past habitat loss.
- extirpated
- No longer existing in the wild in a region but surviving elsewhere.
- mass extinction
- A geologically brief loss of roughly three quarters or more of species.
Practice problems
Work each problem on paper first, then reveal the answer to check.
What did the 2019 IPBES assessment identify as the leading direct driver of biodiversity loss on land?
Show answer
Changes in land use, mainly agricultural expansion.
What does a Living Planet Index value of 0.27 mean?
Show answer
Monitored populations have declined on average by 73 per cent relative to 1970.
Name the three threatened categories of the Red List.
Show answer
Critically Endangered, Endangered and Vulnerable.
Which criterion uses extent of occurrence and area of occupancy?
Show answer
Criterion B.
A species of 800 mature individuals is otherwise stable. Which category could it qualify for?
Show answer
Vulnerable under criterion D1 (fewer than 1,000 mature individuals).
Why does criterion A use three generations?
Show answer
To scale the assessment window to the species' life history.
Convert 1 E/MSY to extinctions per year for 8 million species.
Show answer
About 8 per year.
What is extinction debt?
Show answer
Delayed extinctions of species that persist for a time after their habitat has become insufficient.
Lesson quiz · 5 questions
Score 60% or more to complete this lesson.
Create a free account to save your progress, take quizzes and earn a certificate.