
BIOL-367 · Lesson 12 of 12 · 30 min
Capstone: monitoring, evidence and a recovery plan for an invented species at risk
Conservation succeeds or fails on the ground, and the only way to know which is to measure. This final lesson brings together the tools of the course in three parts. The first examines how species and ecosystems are monitored, including the problem of imperfect detection and the methods, from camera traps to environmental DNA and community science, that address it. The second considers how conservation decisions should use evidence: evidence-based conservation, adaptive management, structured decision making and the prioritization of limited funds. The third applies everything to a worked case, a recovery plan for an invented species at risk, which follows the structure required by national law.
Why monitor?
Monitoring is the repeated measurement of a system over time to detect change. It serves several purposes: to track the status of species, as for Red List and national assessments; to detect threats early, such as the arrival of an invasive species or a disease; to evaluate whether management actions are working; and to provide the data needed to improve models such as population viability analyses. Good monitoring begins with clear questions and targets. A program designed simply to collect data, without a decision it will inform, often produces data that are too sparse, too inconsistent or measured at the wrong scale to answer the questions that matter later.
Some of the most valuable biodiversity data come from long-running programs. The Christmas Bird Count, run by the National Audubon Society and, in Canada, by Birds Canada, has been held every December since 1900 and now involves tens of thousands of volunteers across the Americas. The North American Breeding Bird Survey, begun in 1966 and run jointly by the US Geological Survey and the Canadian Wildlife Service, counts birds along thousands of roadside routes each June and provided the data for a landmark 2019 study by Kenneth Rosenberg and colleagues, which estimated that the breeding bird population of the United States and Canada had fallen by nearly three billion birds, about 29 per cent, since 1970. Without consistent long-term monitoring, a loss of this size could have gone unnoticed, because it occurred mostly among common species such as sparrows, blackbirds and warblers.
The problem of imperfect detection
A survey that fails to find a species does not prove the species is absent. Animals hide, plants are not in flower, frogs do not call in cold weather, and observers miss things. If detection probability is less than one and is ignored, surveys underestimate the proportion of sites occupied, and changes in detection, for example because of weather or observer skill, can be mistaken for changes in occupancy. In 2002 Darryl MacKenzie and colleagues published a method, now called occupancy modelling, that uses repeated visits to each site within a season to estimate both the probability that a site is occupied, \(\psi\), and the probability of detecting the species on a visit given that it is present, \(p\). The key assumption is that occupancy does not change during the season, so that a site where the species is detected on one visit but not another must be occupied with imperfect detection.
For a site visited \(K\) times, a detection history such as 0-1-0 records whether the species was found on each visit. A site with at least one detection is certainly occupied, and its likelihood is \(\psi \prod p^{d_k}(1-p)^{1-d_k}\). A site with no detections is either occupied but missed every time, or unoccupied, so its likelihood is \(\psi (1-p)^K + (1 - \psi)\). Multiplying across sites and finding the values of \(\psi\) and \(p\) that maximize the likelihood gives estimates of both.
import math
# Single-season occupancy model (MacKenzie et al. 2002) fitted by grid search.
# Invented detection histories of a butterfly at 30 sites, 3 visits each.
histories = (["111"] * 2 + ["110"] * 3 + ["101"] * 2 + ["011"] * 2 + ["100"] * 3 +
             ["010"] * 3 + ["001"] * 2 + ["000"] * 13)
K = 3
def loglik(psi, p):
    ll = 0.0
    for h in histories:
        d = [int(c) for c in h]
        if sum(d) > 0:
            ll += math.log(psi) + sum(math.log(p) if x else math.log(1 - p) for x in d)
        else:
            ll += math.log(psi * (1 - p) ** K + (1 - psi))
    return ll
best = max(((loglik(a / 200, b / 200), a / 200, b / 200)
            for a in range(1, 200) for b in range(1, 200)))
_, psi_hat, p_hat = best
naive = sum("1" in h for h in histories) / len(histories)
print(f"sites with at least one detection (naive occupancy): {naive:.2f}")
print(f"estimated occupancy psi = {psi_hat:.2f}, detection probability per visit p = {p_hat:.2f}")
print(f"probability of missing an occupied site on all {K} visits: {(1 - p_hat) ** K:.2f}")
for k in range(1, 7):
print(f" visits = {k}: chance of detecting the species at an occupied site = {1 - (1 - p_hat) ** k:.2f}")sites with at least one detection (naive occupancy): 0.57 estimated occupancy psi = 0.67, detection probability per visit p = 0.47 probability of missing an occupied site on all 3 visits: 0.15 visits = 1: chance of detecting the species at an occupied site = 0.47 visits = 2: chance of detecting the species at an occupied site = 0.71 visits = 3: chance of detecting the species at an occupied site = 0.85 visits = 4: chance of detecting the species at an occupied site = 0.92 visits = 5: chance of detecting the species at an occupied site = 0.96 visits = 6: chance of detecting the species at an occupied site = 0.98
Seventeen of 30 sites had at least one detection, so the naive occupancy is 0.57, but the model estimates that the species occupies a larger share of sites, because its detection probability per visit is well below one and some occupied sites were missed on every visit. The last lines show how many visits would be needed to be confident of finding the species where it occurs, which is the kind of calculation used to design surveys, for example to decide how many visits are needed before a site can be declared unoccupied before a development is approved.
Tools for monitoring
Field methods have expanded greatly in recent decades. Camera traps, triggered by heat and motion, record medium and large mammals day and night with little disturbance and can be analysed with occupancy models or, for individually recognizable animals such as cougars, lynx or spotted cats, with capture–recapture models that estimate abundance. Acoustic recorders capture the calls of birds, frogs, bats and whales, and machine learning tools can now identify many species automatically from thousands of hours of recordings. Satellite and aircraft remote sensing track habitat change, such as forest loss, wetland drainage and sea ice, at continental scales. Telemetry using GPS collars and tags reveals how animals move, which habitats they use and where they die.
Environmental DNA (eDNA) methods detect species from traces of DNA shed into water, soil or air. A litre of water from a pond or stream can reveal the presence of fish, amphibians and even mammals that live in or visit it, and metabarcoding can identify many species at once from a single sample. eDNA is particularly useful for detecting rare or elusive species, such as invasive carp ahead of an invasion front or endangered salamanders, and for surveying large areas efficiently. Its limitations include false positives from contamination or DNA transported from elsewhere, false negatives when DNA degrades, and the difficulty of estimating abundance from DNA concentration.
Community science, also called citizen science, engages the public in collecting data. Platforms such as eBird, run by the Cornell Lab of Ornithology, and iNaturalist, which uses image recognition to help users identify organisms, have accumulated hundreds of millions of observations and have been used to map species distributions, track range shifts and detect invasive species. Community science data are often collected opportunistically and unevenly, concentrated near cities and roads and biased toward charismatic species, so analyses must account for variation in effort. Structured community science programs, such as breeding bird atlases and amphibian call surveys, follow standard protocols and produce more reliable trends.
Evidence-based conservation
Medicine was transformed in the late twentieth century by the movement toward evidence-based practice, in which treatments are chosen on the basis of systematic reviews of rigorous studies rather than tradition or anecdote. In 2004 William Sutherland and colleagues argued that conservation needed the same transformation, because many conservation actions were chosen on the basis of experience and intuition and were rarely evaluated. The Conservation Evidence project, based at the University of Cambridge, has since summarized the evidence for thousands of conservation actions, from installing bat boxes to removing invasive predators, and found that some widely used interventions have little evidence of effectiveness, while others are strongly supported. The Collaboration for Environmental Evidence produces systematic reviews on the model of the Cochrane Collaboration in medicine.
Evaluating conservation actions is difficult because experiments are often impossible: one cannot randomly assign species to recovery programs. Conservation scientists therefore use quasi-experimental designs such as before–after–control–impact (BACI) studies, which compare changes at treated sites with changes at similar untreated sites, and matching methods, mentioned in lesson 8 for protected areas. The 2024 meta-analysis by Penny Langhammer and colleagues, noted in lesson 3, which found that interventions improved outcomes in about two thirds of cases, drew on studies of this kind.
Adaptive management and structured decision making
Conservation decisions must often be made despite uncertainty about how a system works. Adaptive management, developed by C. S. Holling and Carl Walters in the 1970s and 1980s, treats management actions as experiments: managers state hypotheses about how the system will respond, design actions to test them, monitor the outcomes and adjust future actions in the light of what is learned. Active adaptive management deliberately tries different actions, sometimes in different places, to learn faster; passive adaptive management applies the best current action and updates it as evidence accumulates. A well-known example is the adaptive management program for the Colorado River below Glen Canyon Dam, where experimental high-flow releases since 1996 have tested whether floods can rebuild sandbars and benefit native fish.
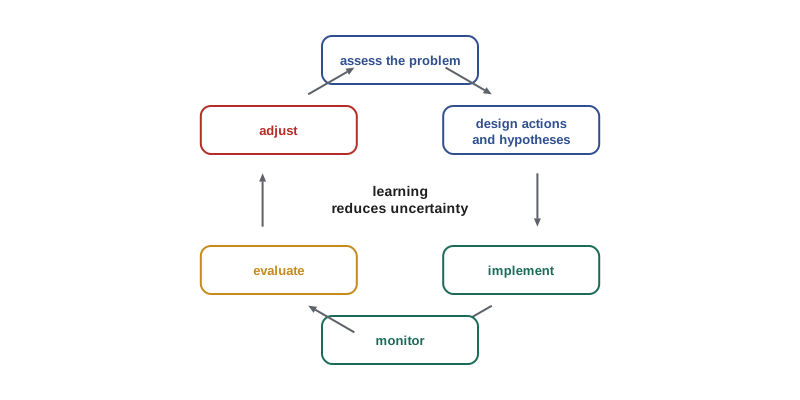
Structured decision making (SDM) is a broader approach for making complex decisions transparent. It breaks a decision into steps: define the problem, identify objectives, including social and economic ones, develop alternative actions, estimate the consequences of each alternative for each objective, evaluate trade-offs, and decide, then monitor and learn. SDM separates questions of fact, which science can address, from questions of value, which stakeholders must decide, and makes trade-offs explicit. It has been used for decisions such as setting harvest regulations for waterfowl in North America, an adaptive harvest management program run since 1995, and planning for caribou recovery.
Prioritizing limited resources
Conservation budgets are always smaller than the needs, so choices must be made about which species and actions to fund. Prioritization protocols, such as the one developed by Liana Joseph, Richard Maloney and Hugh Possingham in New Zealand in 2009, rank projects by their cost-effectiveness: the expected benefit, such as the increase in the probability that a species will persist, weighted by the species' value, for example its evolutionary distinctiveness, and multiplied by the probability that the project will succeed, divided by its cost. Explicit prioritization can protect many more species with the same budget than funding the most endangered species first. It also raises uncomfortable questions, sometimes framed as conservation triage: should money be withheld from species that are very expensive to save? Critics argue that triage accepts extinctions and that budgets should instead be increased; supporters respond that implicit triage happens anyway, and that it is better to make choices openly and on evidence.
# Cost-effectiveness ranking of recovery projects for invented species (after Joseph et al. 2009).
# benefit = increase in probability of persistence over 50 years if the project succeeds
projects = [
    # name,                       cost (thousands), benefit, prob. of success, weight (distinctiveness)
    ("dune skipper habitat",        400,             0.30,    0.8,              1.0),
    ("island frog predator control", 900,            0.45,    0.7,              1.5),
    ("orchid seed banking",           60,            0.10,    0.95,             1.0),
    ("river turtle nest protection", 250,            0.20,    0.9,              1.2),
    ("alpine marmot captive program",1800,           0.50,    0.6,              1.3),
    ("prairie bird grazing plans",   300,            0.15,    0.85,             1.0),
]
budget = 1500
scored = sorted(projects, key=lambda x: -(x[2] * x[3] * x[4] / x[1]))
spent, funded = 0, []
print("project                          cost   expected benefit   per 100k")
for name, cost, b, ps, w in scored:
    eb = b * ps * w
    flag = ""
    if spent + cost <= budget:
        spent += cost; funded.append(name); flag = "  funded"
    print(f"{name:31s} {cost:5d}   {eb:16.3f}   {100 * eb / cost:8.3f}{flag}")
print(f"spent {spent} of {budget}; funded {len(funded)} of {len(projects)} projects")project cost expected benefit per 100k orchid seed banking 60 0.095 0.158 funded river turtle nest protection 250 0.216 0.086 funded dune skipper habitat 400 0.240 0.060 funded island frog predator control 900 0.473 0.052 prairie bird grazing plans 300 0.128 0.043 funded alpine marmot captive program 1800 0.390 0.022 spent 1010 of 1500; funded 4 of 6 projects
In this invented portfolio, the cheapest projects with high success probability rank highest, and the expensive captive breeding program ranks last and is not funded, even though its potential benefit is among the largest. The island frog project ranks fourth but is skipped because it would exceed the remaining budget, and the simple rule of funding projects in order leaves almost a third of the budget unspent; real prioritization uses optimization methods that choose the best combination of projects within the budget. Whether that outcome is acceptable is a value judgement; the ranking makes the trade-off visible. Real prioritization exercises also consider uncertainty in costs and benefits, interactions between projects and the possibility of raising more money.
A recovery plan for an invented species
To bring the course together, consider the dune-ridge skipper (an invented species), a small butterfly whose larvae feed only on a native bunchgrass that grows on partly stabilized sand dunes. In this scenario it occurs only in the sand hills of southwestern Saskatchewan and southeastern Alberta, in 14 known colonies on private ranchland, provincial Crown land and one federal community pasture. COSEWIC has assessed it as endangered, and it has been listed on Schedule 1 of the Species at Risk Act. Surveys suggest a decline of about 60 per cent over the past ten years, which, with a generation time of one year, uses a ten-year window under the Red List criteria.
The threats, identified through field studies and interviews with ranchers and Indigenous land users, are the complete stabilization of dunes, because fire and heavy grazing by bison no longer disturb the sand and the bunchgrass is crowded out by other plants; conversion of sandy grassland to irrigated cropland; invasive grasses such as crested wheatgrass and smooth brome; insecticide drift from nearby fields; and climate change, which brings more frequent drought years when adult numbers crash. A population viability analysis built from five years of transect counts suggests a 35 per cent probability that the species will fall below 500 adults within 20 years without action.
| Plan element | What it contains for the dune-ridge skipper |
|---|---|
| Species status and needs | Biology, distribution in 14 colonies, habitat needs: active and semi-stabilized dunes with the host bunchgrass |
| Threats | Dune stabilization, conversion, invasive grasses, insecticide drift, drought |
| Population and distribution objectives | At least 20 colonies with at least 300 adults each in 15 of 20 years; occupancy of at least 70 per cent of suitable dune complexes |
| Critical habitat | Active and semi-stabilized dunes within 500 metres of occupied colonies, mapped by remote sensing and field survey |
| Broad strategies | Restore dune disturbance with prescribed fire and managed grazing; prevent conversion through conservation easements; control invasive grasses; establish spray buffers |
| Action plan and monitoring | Annual occupancy surveys with repeat visits; adult counts on transects; habitat mapping every five years; review every five years |
| Partners | Ranchers, First Nations and Métis communities, provincial governments, the federal government, land trusts, universities |
Several lessons of the course shape this plan. Lesson 2's rarity framework identifies the skipper as rare in all three senses, small range, narrow habitat and small local populations, which explains its vulnerability. Lesson 3's criteria explain its endangered status. Lesson 4's analysis of habitat loss and lesson 7's metapopulation thinking imply that the colonies must be managed as a network, with empty but suitable dunes protected for recolonization, and that the extinction threshold may be reached before all habitat is gone. Lesson 6's population viability analysis guides the objectives and shows which actions most reduce risk; in this case, adult survival in drought years and the number of colonies, which provides redundancy, matter most. Lesson 8's planning principles suggest where to place easements, using complementarity to protect the dune complexes that add most to the network. Lesson 9's law determines the plan's legal structure. Lesson 10's restoration ecology informs the reintroduction of disturbance by fire and grazing, perhaps including bison, and possible translocation of skippers to restored dunes. Lesson 11's emphasis on people means that ranchers, whose grazing can either harm or help the skipper, and Indigenous communities, whose knowledge of fire and of the sand hills is long, are partners rather than obstacles.
Finally, this lesson's monitoring and adaptive management complete the plan. Occupancy surveys with repeat visits will estimate trends while accounting for detection; managers will test whether prescribed fire or grazing restores host plants more effectively by applying each to different dune complexes in a BACI design; and the plan will be reviewed every five years, with objectives and actions adjusted as evidence accumulates. Recovery will take decades, if it succeeds at all, and its progress will depend on stable funding, the trust of landowners and continued scientific attention.
Worked problem
Designing the skipper monitoring program
Pilot surveys estimate that the dune-ridge skipper is detected on 45 per cent of visits to occupied sites during the flight season. How many visits per site are needed to be at least 95 per cent sure of detecting it at an occupied site, and what does this imply for the program?
Show solution
- The probability of missing an occupied site on all \(K\) visits is \((1 - 0.45)^K = 0.55^K\).
- We need \(0.55^K \le 0.05\), so \(K \ge \ln 0.05 / \ln 0.55 \approx 5.0\).
- Five visits per site during the short flight season are needed, which limits the number of sites one team can survey.
- The program could survey fewer sites more intensively, use occupancy models with three visits and accept wider uncertainty, or add eDNA or other methods if they prove reliable for the species.
Answer: About five visits are needed per site. Monitoring design involves trade-offs between the number of sites, the number of visits and cost, which occupancy models allow managers to evaluate explicitly.
Common mistakes
MistakeTreating non-detection as proof of absence.
InsteadDetection is imperfect; occupancy models with repeat visits estimate both occupancy and detection probability.
MistakeCollecting monitoring data without a decision in mind.
InsteadGood monitoring starts with clear questions and targets tied to management decisions.
MistakeChoosing conservation actions on intuition alone.
InsteadEvidence syntheses show some popular actions have little support; use systematic evidence.
MistakeTreating adaptive management as trial and error.
InsteadIt requires explicit hypotheses, monitoring designed to test them and planned adjustment.
MistakeFunding the most endangered species first regardless of cost and feasibility.
InsteadCost-effectiveness prioritization can protect more species with the same budget, though value judgements remain.
Summary and key terms
- Monitoring tracks status, detects threats, evaluates actions and improves models; long-term programs revealed a loss of nearly three billion North American birds since 1970.
- Imperfect detection biases naive occupancy; occupancy models with repeat visits estimate occupancy and detection.
- Camera traps, acoustic recorders, remote sensing, telemetry, eDNA and community science expand monitoring.
- Evidence-based conservation uses systematic reviews and quasi-experimental designs such as BACI.
- Adaptive management treats actions as experiments; structured decision making separates facts from values.
- Cost-effectiveness prioritization ranks projects by expected benefit per unit cost, raising triage debates.
- A recovery plan integrates status, threats, objectives, critical habitat, actions, monitoring and partners.
- monitoring
- Repeated measurement of a system over time to detect change.
- detection probability
- The probability of detecting a species on a survey given that it is present.
- occupancy
- The proportion of sites occupied by a species, often written psi.
- environmental DNA
- DNA shed by organisms into water, soil or air, used to detect species.
- community science
- Participation by members of the public in collecting scientific data.
- evidence-based conservation
- Choosing conservation actions on the basis of systematically reviewed evidence.
- BACI design
- Before–after–control–impact: comparing changes at treated and untreated sites.
- adaptive management
- Management that treats actions as experiments and adjusts in light of monitoring.
- structured decision making
- A stepwise, transparent process for making decisions with multiple objectives.
- conservation triage
- Allocating limited resources among species based on cost, benefit and likelihood of success.
- recovery plan
- A document setting out objectives, threats, actions and monitoring for recovering a species.
Practice problems
Work each problem on paper first, then reveal the answer to check.
Why can naive occupancy underestimate true occupancy?
Show answer
Some occupied sites are missed on every visit when detection probability is less than one.
What is the likelihood contribution of a site with history 000 visited three times?
Show answer
psi(1 − p)^3 + (1 − psi).
Name two limitations of eDNA surveys.
Show answer
False positives from contamination or transport and difficulty estimating abundance.
What did Rosenberg and colleagues find in 2019?
Show answer
North American breeding bird populations had fallen by nearly three billion birds, about 29 per cent, since 1970.
What is a BACI design?
Show answer
A comparison of changes before and after an action at treated and untreated sites.
Distinguish active and passive adaptive management.
Show answer
Active deliberately tests alternative actions to learn; passive applies the best current action and updates it.
How is cost-effectiveness calculated in project prioritization?
Show answer
Expected benefit times probability of success times species weight, divided by cost.
Name four elements of a recovery plan.
Show answer
Status and threats, objectives or delisting criteria, critical habitat, actions and monitoring.
Lesson quiz · 5 questions
Score 60% or more to complete this lesson.
Create a free account to save your progress, take quizzes and earn a certificate.