
BIOL-108 · Lesson 6 of 12 · 26 min
Reading and building phylogenetic trees
A phylogenetic tree is a diagram of evolutionary relationships: who shares a more recent common ancestor with whom. Trees are the main way biologists organize the diversity of life, and they now appear everywhere from tracking virus variants during a pandemic to identifying the source of a food-borne outbreak or a poached ivory shipment. This lesson teaches how to read trees correctly, how classification relates to them, and how trees are built from anatomical and molecular data using distance and parsimony methods.
Anatomy of a tree
A tree has tips (also called leaves or terminal taxa), which represent the species or groups being compared; branches, which represent lineages through time; and nodes, where branches split, which represent common ancestors. The root is the common ancestor of everything on the tree. Two groups that split from the same node are sister groups.
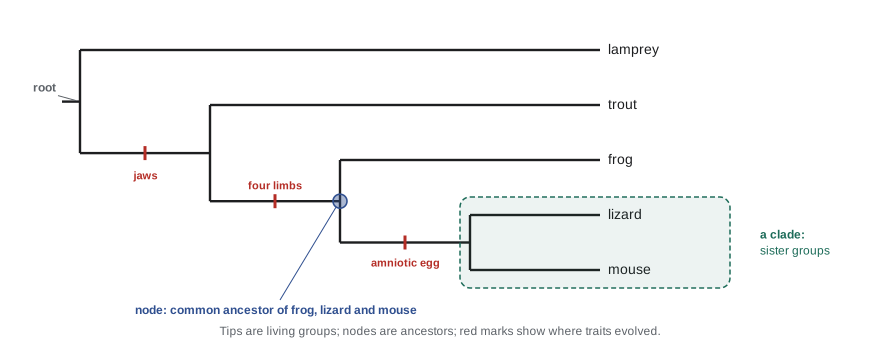
The most important rule for reading a tree is that relatedness is shown by how recently groups share a common ancestor, not by how close their tips sit on the page. Branches can rotate around any node, like a hanging mobile, without changing the relationships. A tree with mouse next to lizard and one with mouse next to frog may show exactly the same relationships if the nodes are the same. Read trees by tracing back from tips to nodes.
A second common error is to read a tree as a ladder of progress, from primitive on one side to advanced on the other. Every living species at the tips has been evolving for exactly the same amount of time since the root. A lamprey is not an ancestor of a mouse; both are modern species. A lamprey has simply retained more of the features that the common ancestor of all vertebrates probably had.
Clades and classification
A clade, or monophyletic group, contains an ancestor and all of its descendants. Clades are the units of modern classification. On a tree, you can cut out a clade with a single snip of a branch. Groups that do not meet this standard are called paraphyletic (an ancestor and only some of its descendants) or polyphyletic (organisms from different lineages, not including their common ancestor).
| Group type | Definition | Example |
|---|---|---|
| Monophyletic (clade) | An ancestor and all of its descendants | Mammals; birds; vertebrates; land plants |
| Paraphyletic | An ancestor and some but not all descendants | Reptiles in the traditional sense, which excludes birds even though birds descend from reptile ancestors |
| Polyphyletic | Members from different lineages, excluding their common ancestor | Warm-blooded animals, if defined as birds plus mammals |
Traditional Linnaean classification uses nested ranks: domain, kingdom, phylum, class, order, family, genus and species. A wolf is Animalia, Chordata, Mammalia, Carnivora, Canidae, Canis, Canis lupus. The ranks are still widely used and convenient, but phylogenetic thinking has changed what they mean: a valid named group should be a clade. That is why many biologists now say birds are reptiles, or more precisely a group within the dinosaurs, and why the old kingdom Protista has been abandoned as a formal group (lesson 8).
Characters: homology, analogy and shared derived traits
Trees are inferred from characters: heritable features that vary among organisms, such as the presence of hair, the number of limb bones or the base at a given position in a DNA sequence. Only homologous characters, those inherited from a common ancestor, are useful; analogous similarities from convergent evolution mislead. Convergent evolution is common. The streamlined shapes of sharks, ichthyosaurs and dolphins, the eyes of octopuses and vertebrates, and the wings of birds, bats and pterosaurs all evolved independently.
Not all homologous characters are equally useful either. A shared derived character, or synapomorphy, is a trait that evolved in the common ancestor of a clade and is shared by its members. Hair is a synapomorphy of mammals. A shared ancestral character, by contrast, is inherited from a more distant ancestor and does not define the group: having a backbone is shared by all mammals, but also by fish, so it cannot show that mammals form a clade. The method of grouping organisms by shared derived characters is called cladistics, developed by the German entomologist Willi Hennig in the 1950s.
To tell which state of a character is ancestral, biologists compare with an outgroup: a lineage known to have split off before the group being studied (the ingroup). A character state found in both the outgroup and some ingroup members is probably ancestral; a state found only within the ingroup is probably derived.
Building trees from distances
Molecular data now dominate tree-building. Sequences of the same gene are aligned across species, and differences are counted. Distance methods first turn sequence comparisons into a matrix of pairwise distances, then build a tree that fits them. The simplest algorithm is UPGMA (unweighted pair group method with arithmetic mean): repeatedly join the two closest groups, place their common ancestor at half their distance, and replace them with a merged group whose distance to every other group is the average.
Worked problem
One step of UPGMA
Distances (per cent sequence difference) are: A–B 2, A–C 6, B–C 6, A–D 10, B–D 10, C–D 10. Which taxa are joined first, and what are the new distances?
Show solution
- The smallest distance is A–B = 2, so A and B are joined first; their ancestor sits at height 2/2 = 1.
- Distance from (AB) to C = average of A–C and B–C = (6 + 6)/2 = 6.
- Distance from (AB) to D = (10 + 10)/2 = 10.
- Next the smallest distance is (AB)–C = 6, joined at height 3; finally D joins at height 5.
Answer: The tree is (((A,B),C),D): A and B are sisters, C is their next relative, and D is the outgroup.
# UPGMA: build a tree from a distance matrix (illustrative % sequence differences)
names = ["human", "chimpanzee", "gorilla", "orangutan", "gibbon"]
D = [[0.0, 1.2, 1.7, 3.1, 4.4],
     [1.2, 0.0, 1.6, 3.0, 4.3],
     [1.7, 1.6, 0.0, 3.2, 4.5],
     [3.1, 3.0, 3.2, 0.0, 4.6],
     [4.4, 4.3, 4.5, 4.6, 0.0]]
clusters = {n: [n] for n in names}
dist = {(a, b): D[i][j] for i, a in enumerate(names) for j, b in enumerate(names) if i < j}

def d(a, b):
    return dist.get((a, b), dist.get((b, a)))

while len(clusters) > 1:
    a, b = min(((x, y) for x in clusters for y in clusters if x < y), key=lambda p: d(*p))
    new = f"({a},{b})"
    print(f"join {a} + {b} at height {d(a, b)/2:.2f}")
    for c in clusters:
        if c not in (a, b):
            na, nb = len(clusters[a]), len(clusters[b])
            dist[(new, c)] = (na * d(a, c) + nb * d(b, c)) / (na + nb)
    clusters[new] = clusters.pop(a) + clusters.pop(b)
print("tree:", next(iter(clusters)))join chimpanzee + human at height 0.60 join (chimpanzee,human) + gorilla at height 0.82 join ((chimpanzee,human),gorilla) + orangutan at height 1.55 join (((chimpanzee,human),gorilla),orangutan) + gibbon at height 2.22 tree: ((((chimpanzee,human),gorilla),orangutan),gibbon)
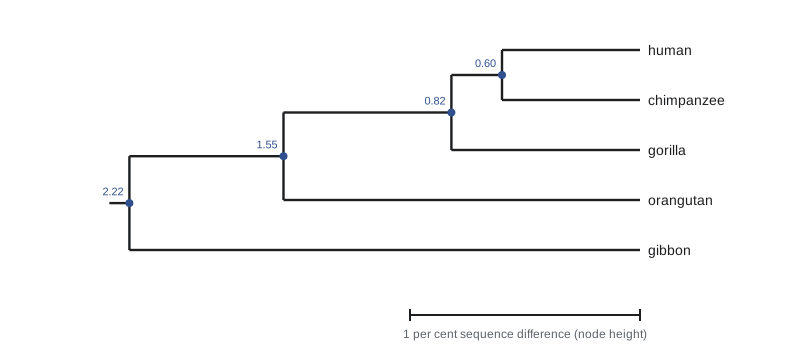
The result matches the conclusion of many independent genetic studies: chimpanzees and bonobos are humans' closest living relatives, followed by gorillas, then orangutans, with gibbons more distant. UPGMA assumes that all lineages change at the same rate, which is often not true, so modern studies use more sophisticated methods such as neighbour-joining, maximum likelihood and Bayesian inference, run on thousands of genes. But the logic is the same: more similar sequences mean more recent common ancestry.
Building trees by parsimony
Parsimony methods choose the tree that requires the fewest evolutionary changes to explain the data. The idea, borrowed from the principle that simpler explanations are preferred, is that shared character states are more likely inherited from a common ancestor than evolved twice. For four taxa there are only three possible unrooted trees, so we can simply count changes on each.
# Parsimony: count changes needed on each of the three unrooted trees for four taxa
# Characters coded 0/1 (1 = derived state); data are illustrative
taxa = {"frog":   "100010",
        "lizard": "110101",
        "mouse":  "111101",
        "salmon": "000010"}
trees = {"((frog,lizard),(mouse,salmon))": (("frog", "lizard"), ("mouse", "salmon")),
         "((frog,mouse),(lizard,salmon))": (("frog", "mouse"), ("lizard", "salmon")),
         "((frog,salmon),(lizard,mouse))": (("frog", "salmon"), ("lizard", "mouse"))}

def fitch(x, y):              # Fitch step for two child state sets
    common = x & y
    return (common, 0) if common else (x | y, 1)

for label, (p1, p2) in trees.items():
    steps = 0
    for k in range(6):
        s1, c1 = fitch({taxa[p1[0]][k]}, {taxa[p1[1]][k]})
        s2, c2 = fitch({taxa[p2[0]][k]}, {taxa[p2[1]][k]})
        _, c3 = fitch(s1, s2)
        steps += c1 + c2 + c3
print(f"{label}: {steps} changes")((frog,lizard),(mouse,salmon)): 10 changes ((frog,mouse),(lizard,salmon)): 10 changes ((frog,salmon),(lizard,mouse)): 6 changes
The tree grouping lizard with mouse (and frog with salmon on the other side of the unrooted tree) needs only 6 changes, against 10 for each of the other two, so parsimony prefers it. Rooted with salmon as the outgroup, it says frogs branched off next and lizards and mice share the most recent common ancestor, matching the vertebrate tree in the figure at the start of the lesson. With many taxa the number of possible trees explodes (for 20 taxa there are more than \(10^{20}\) rooted trees), so computer programs use clever search strategies rather than checking every tree.
Molecular clocks
If a gene accumulates changes at a roughly constant rate, the number of differences between two species can estimate how long ago they diverged. This is a molecular clock. The clock must be calibrated with fossils or geological events of known age, and rates differ between genes and lineages, so estimates come with wide uncertainty. Because both lineages accumulate changes after a split, the distance between two species is about twice the change along each branch:
where \(d\) is the proportion of sites that differ and \(r\) is the rate of change per site per year along one lineage.
# Molecular clock: divergence time t = d / (2r)
rate = 1.0e-9          # substitutions per site per year per lineage (illustrative)
pairs = {"human-chimpanzee": 0.012, "human-gorilla": 0.017, "human-orangutan": 0.031}
for pair, d in pairs.items():
    t = d / (2 * rate)
print(f"{pair:<17} d = {d:.3f} -> about {t/1e6:.1f} million years")human-chimpanzee d = 0.012 -> about 6.0 million years human-gorilla d = 0.017 -> about 8.5 million years human-orangutan d = 0.031 -> about 15.5 million years
With this illustrative rate, the human–chimpanzee split comes out at about 6 million years ago, close to estimates from fossils and from more careful genomic studies that account for mutation rates and generation times (roughly 6 to 7 million years). Molecular clocks have also dated the origins of HIV from a chimpanzee virus in central Africa in the early twentieth century and the spread of SARS-CoV-2 variants during the COVID-19 pandemic.
Trees in practice
Phylogenetic methods are now everyday tools. Public health laboratories sequence pathogens and build trees to trace outbreaks: whether cases of salmonella or listeria are linked, where an influenza strain came from, how a virus moved between countries. Wildlife forensics uses trees to identify the species and origin of seized products such as ivory or shark fin. Conservation biologists use them to identify evolutionarily distinct lineages worth special protection.
In Canada, the National Microbiology Laboratory in Winnipeg sequences pathogen genomes from across the country and shares them through PulseNet Canada to link food-borne illness cases, and wildlife forensic laboratories at Environment and Climate Change Canada use DNA to enforce wildlife trade laws.
Common mistakes
MistakeTips that are next to each other on a tree are the most closely related.
InsteadRelatedness is shown by the most recent shared node; branches can rotate without changing relationships.
MistakeLiving species on the left of a tree are ancestors of those on the right.
InsteadAll tips are modern; ancestors are at the nodes, not the tips.
MistakeAny shared trait shows that species are closely related.
InsteadOnly shared derived homologous traits indicate clades; ancestral traits and convergent traits mislead.
MistakeHumans evolved from chimpanzees.
InsteadHumans and chimpanzees share a common ancestor; both lineages have evolved since they split.
MistakeA molecular clock gives an exact date.
InsteadClocks need fossil calibration and rates vary, so dates carry wide uncertainty.
Summary and key terms
- Trees show common ancestry through nodes; tips are modern taxa, and branches can rotate without changing relationships.
- Clades (monophyletic groups) include an ancestor and all descendants; paraphyletic and polyphyletic groups do not.
- Shared derived characters (synapomorphies) define clades; outgroups show which states are ancestral.
- Convergent evolution produces analogous traits that can mislead tree-building.
- Distance methods such as UPGMA join the most similar groups first; parsimony chooses the tree with the fewest changes.
- Molecular clocks estimate divergence times as t = d/(2r), calibrated with fossils.
- Trees are used in outbreak tracing, wildlife forensics and conservation.
- phylogenetic tree
- A branching diagram showing evolutionary relationships among organisms.
- node
- A branching point on a tree representing a common ancestor.
- sister groups
- Two lineages that share an immediate common ancestor.
- clade
- An ancestor and all of its descendants; a monophyletic group.
- paraphyletic group
- A group containing an ancestor and only some of its descendants.
- synapomorphy
- A shared derived character that defines a clade.
- outgroup
- A lineage that branched off before the group being studied, used to determine ancestral character states.
- convergent evolution
- The independent evolution of similar traits in different lineages.
- parsimony
- Choosing the tree that requires the fewest evolutionary changes.
- molecular clock
- Using rates of molecular change to estimate times of divergence.
Practice problems
Work each problem on paper first, then reveal the answer to check.
On a tree, how do you decide whether A is more closely related to B or to C?
Show answer
Find which pair shares the more recent common ancestor (the closer node), regardless of tip order.
Classify: a group containing all descendants of the first mammal.
Show answer
Monophyletic (a clade).
Why is “fish” in the traditional sense paraphyletic?
Show answer
It includes the common ancestor of all vertebrates with fins but excludes its tetrapod descendants.
Is a backbone a useful character for showing that mammals form a clade? Why or why not?
Show answer
No; it is a shared ancestral character also found in fish, amphibians and reptiles.
Distances: P–Q 4, P–R 8, Q–R 8. Which pair joins first in UPGMA, and at what height?
Show answer
P and Q, at height 2.
After joining P and Q, what is the distance from (PQ) to R?
Show answer
(8 + 8)/2 = 8.
Why does parsimony prefer trees with fewer changes?
Show answer
Shared states are more likely inherited than evolved independently several times.
Two species differ at 2 per cent of sites; the rate is 1 × 10^−9 per site per year per lineage. Estimate divergence time.
Show answer
t = 0.02 / (2 × 10^−9) = 10 million years.
Give two examples of convergent evolution.
Show answer
Wings of birds and bats; streamlined bodies of sharks and dolphins; eyes of octopuses and vertebrates.
How do public health labs use phylogenetic trees?
Show answer
They compare pathogen genomes to tell whether cases are linked and to trace the source and spread of outbreaks.
Lesson quiz · 5 questions
Score 60% or more to complete this lesson.
Create a free account to save your progress, take quizzes and earn a certificate.