
ARCH-450 · Lesson 10 of 12 · 22 min
Embodied carbon and reuse
Mei Takahashi, the life cycle assessment consultant who taught the students to count the carbon in building materials, arrives in the tenth week with a spreadsheet and a provocation. 'Your client's board has asked a fair question,' she says. 'Greenway Homes could build forty-six new homes on an empty lot for about the same money as converting this warehouse. New homes would be airtight, well insulated and all-electric. Old homes in a brick warehouse will leak more heat for as long as they stand. So which is better for the climate? You have heard the slogan that the greenest building is the one already built. This week you find out whether it is true for this building.'
Two kinds of carbon
A building's contribution to climate change comes from two sources. Operational carbon is the greenhouse gas emitted by the energy used to heat, cool, light and run the building over its life. Embodied carbon is the greenhouse gas emitted in making, transporting, installing, maintaining, replacing and eventually disposing of the building's materials. For most of the past half century, energy codes and green building programs focused on operational carbon, because it was the larger share for most buildings. As buildings have become more efficient and electricity grids cleaner, embodied carbon has become a growing share of the total, and for a new, efficient building on a clean grid it can be the majority of the building's emissions over decades.
Life cycle assessment divides a building's life into stages, using a scheme standardized in Europe and now used worldwide. The product stage, called A1 to A3, covers extracting raw materials, transporting them and manufacturing building products. The construction stage, A4 and A5, covers transport to site and construction itself. The use stage, B1 to B7, covers maintenance, repair, replacement and refurbishment of materials, and the operational energy and water used by the building. The end-of-life stage, C1 to C4, covers demolition, transport, waste processing and disposal. A further module, D, reports potential benefits beyond the building's life, such as materials reused or recycled. The emissions released before a building is occupied, stages A1 to A5, are often called upfront carbon, and they matter especially because they are released now, when reducing emissions quickly matters most.
What reuse saves
When an existing building is reused, its structure, foundations and most of its envelope are kept, and the carbon spent making them, long ago, is not spent again. The upfront carbon of the project is only the carbon of the new materials: the new partitions, finishes, services, insulation, windows, roofing and, in the Stanfield's case, the steel for the addition and the topping on the floors. Structure and envelope typically account for the largest share of a new building's upfront carbon, because they contain the most concrete, steel, masonry and glass. So a renovation that keeps them usually has much lower upfront carbon than a new building of the same size, often less than half, depending on how much new material it adds.
Demolition adds its own emissions: the energy of demolition itself, the transport of the debris and the disposal of materials that are not reused or recycled. Construction and demolition debris is one of the largest waste streams in North America, and a brick warehouse like the Stanfield, once demolished, would mostly go to landfill or be crushed for fill, with only a small share of its timber and brick salvaged. Its materials would also be lost as a resource. The century-old Douglas fir in its floors, for example, could not be replaced at any price today in the sizes and quality the building contains.
The evidence on reuse
The most cited study of the carbon value of reuse is The Greenest Building, published in 2011 by the National Trust for Historic Preservation's Preservation Green Lab in the United States. It compared the life cycle impacts of reusing and retrofitting existing buildings with demolishing them and building new ones, for several building types in several American cities. Its central finding was that, for buildings of the same size and function, reuse almost always produced lower environmental impacts than new construction, and that a new building designed to be more efficient than the existing building it replaced would take from ten to eighty years to overcome, through its lower operating emissions, the climate impact of its construction. For most building types and climates, the period was twenty to thirty years. The study also found that renovations requiring large quantities of new materials could reduce or even cancel the benefits of reuse.
The finding is now repeated widely, and many architects quote the line coined by the preservation architect Carl Elefante, that the greenest building is the one that is already built. Takahashi warns the students that the line, like any slogan, can be misused. Its truth depends on how much new material a renovation adds, how much better the new building would perform, how clean the energy grid is, how long the building will last and how long the comparison runs. A reuse project that strips a building to its frame and rebuilds everything else may save little; a new building on a clean grid with low-carbon materials may pay back its upfront carbon faster than the old studies assumed. The way to know is to count.
Embodied carbon policy
Policy on embodied carbon has advanced quickly in Canada. Since 2022 the federal government has required embodied carbon disclosure and reductions for concrete in its major construction projects under the Standard on Embodied Carbon in Construction, and an update in 2025 extended it to structural steel and to whole-building life cycle assessment. Toronto's Green Standard caps the upfront carbon of the structure and envelope of new city-owned buildings, below 350 kilograms of carbon dioxide equivalent per square metre for stages A1 to A5, and offers the same level as a voluntary tier for private development. Vancouver requires reporting of embodied carbon for many new buildings. The 2025 National Model Codes introduced an objective for greenhouse gas emissions, focused at first on operational emissions. None of these policies yet credits reuse directly, but whole-building assessment makes the savings of reuse visible and countable.
Counting the Stanfield
Takahashi helps the students build a simple model of the two options for Greenway's board. Option 1 is the conversion of the Stanfield, with the addition, as designed. Option 2 is demolition of the Stanfield and construction of a new mid-rise building of the same floor area on the same lot, built with a concrete podium and mass timber above, all-electric, to a high efficiency standard. For each, the model estimates the upfront carbon and the annual operational carbon, and then finds the year in which the new building's lower operating emissions would make up for its higher upfront emissions, if ever.
# Reuse vs demolish-and-replace for the Stanfield: carbon payback (metres, kg CO2e)
area = 4400 + 520                     # m2: existing floors plus the addition
# upfront carbon A1-A5, kg CO2e per m2 (typical values, to be replaced by the project LCA)
reuse_upfront = 140                   # new services, finishes, toppings, windows, roof, addition steel
demolition = 25                       # demolition, transport and disposal of the old building
new_upfront = 420                     # concrete podium + mass timber, envelope, services, finishes
# operational energy, kWh per m2 per year (all-electric in both options)
reuse_eui, new_eui = 95, 70
for grid_name, grid in {"Manitoba grid (mostly hydro)": 0.002, "a fossil-heavy grid": 0.45}.items():
    up_reuse = reuse_upfront * area
    up_new = (new_upfront + demolition) * area
    op_reuse = reuse_eui * area * grid
    op_new = new_eui * area * grid
    saved_per_year = op_reuse - op_new
    print(grid_name)
    print(f"  upfront: reuse {up_reuse / 1000:,.0f} t, new {up_new / 1000:,.0f} t")
    print(f"  operating: reuse {op_reuse / 1000:,.1f} t/yr, new {op_new / 1000:,.1f} t/yr")
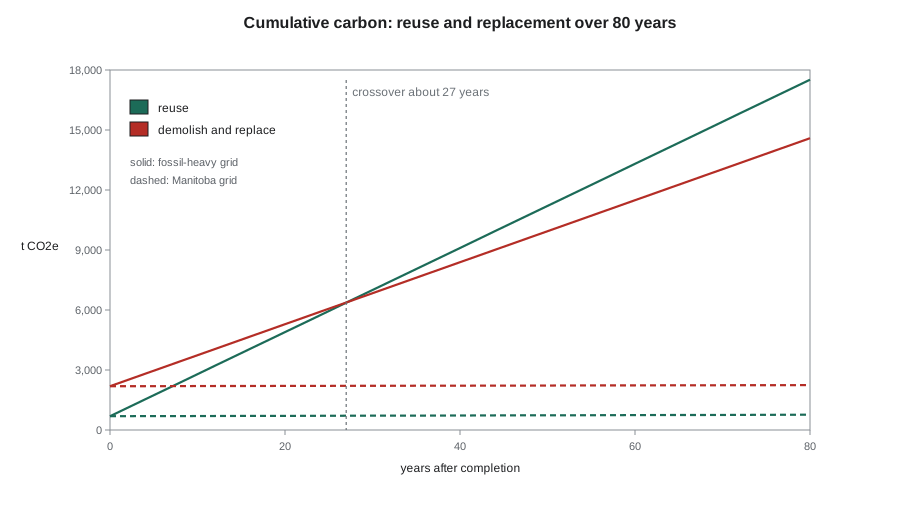
print(f" years for new to catch up: {(up_new - up_reuse) / saved_per_year:,.0f}")Manitoba grid (mostly hydro) upfront: reuse 689 t, new 2,189 t operating: reuse 0.9 t/yr, new 0.7 t/yr years for new to catch up: 6,100 a fossil-heavy grid upfront: reuse 689 t, new 2,189 t operating: reuse 210.3 t/yr, new 155.0 t/yr years for new to catch up: 27
The result is striking. Reuse saves well over a thousand tonnes of upfront carbon, roughly two thirds of what the new building would emit before anyone moved in. On a grid like Manitoba's, which generates almost all its electricity from hydro, the new building's better efficiency saves almost nothing in carbon each year, and it would take thousands of years to make up the difference, which is to say never. Even on a fossil-heavy grid, the new building would need almost three decades to catch up, close to the twenty to thirty years The Greenest Building found typical. For the Stanfield, in this city, reuse is clearly the lower-carbon choice.
Takahashi points out the assumptions that could change the answer and asks the students to test them. If the renovation required much more new material, for example replacing all the floors with concrete, the reuse upfront figure would rise and the gap would narrow. If the reused building were much less efficient, the operating gap would widen. If the new building were built with very low-carbon materials, its upfront carbon would fall. But for a building with a sound structure and envelope, on a clean or cleaning grid, the advantage of reuse is large and robust, and it comes when it matters most, now rather than decades from now.
Making the reuse lower carbon still
Counting carbon does more than settle the argument with the board. It shows the students where the carbon of the conversion lies and how to reduce it. Takahashi's breakdown of the reuse option shows that the largest items are the steel for the addition, the floor topping, the new windows and storefront, the services and the finishes. The students respond with a list of changes. The addition's structure is redesigned in mass timber on steel columns, reducing its steel. The floor topping is specified in a gypsum-based or low-cement mix, and its thickness reduced where acoustic needs allow. Original windows are repaired rather than replaced, as Lesson 6 recommended, saving the carbon of new units. Salvaged timber from the light court is reused in the building. Finishes are kept minimal, with exposed brick and timber in place of new linings. Heat pumps are chosen with low-impact refrigerants and their refrigerant charge counted, because leaking refrigerants can add significantly to a building's emissions.
These choices also serve the conservation goals of the project. Repairing windows keeps original fabric, exposing brick and timber keeps the building's character, and reusing salvaged material keeps the building's own material in the building. Bérubé notes that conservation and carbon reduction are not always aligned, the risk of interior insulation to the masonry being one example, but on most questions they point the same way: keep what exists, repair it, add as little as necessary.
Worked problem
Testing the payback with different assumptions
On the fossil-heavy grid in the model, how long does the new building take to catch up, and how does that change if the renovation's upfront carbon turns out 50% higher than designed?
Show solution
- Annual operating saving of the new building: (95 − 70) × 4,920 m² × 0.45 kg ≈ 55 t per year.
- Upfront gap as designed: 445 × 4,920 ≈ 2,190 t for the new building against 140 × 4,920 ≈ 690 t for reuse, a gap of about 1,500 t.
- Payback as designed: 1,500 ÷ 55 ≈ 27 years.
- With 50% more upfront carbon in the renovation, reuse rises to about 1,030 t and the gap falls to about 1,160 t, so the payback falls to about 21 years.
- On a clean grid the annual saving is a small fraction of these figures, and the payback runs to centuries or more in either case.
Answer: The comparison is most sensitive to the grid: on a fossil-heavy grid a material-intensive renovation narrows the margin to about two decades, while on a clean grid reuse wins by a wide margin whatever the renovation's scope.
Exercise 10: counting carbon
- Estimate the upfront carbon of a renovation of a building near the school, listing the new materials it would need.
- Run the payback model with your own values for upfront carbon, energy use and grid intensity, and find the crossover year.
- Identify the three largest sources of upfront carbon in the Stanfield conversion and propose a reduction for each.
- Explain to a lay audience, in one paragraph, why reuse can be better for the climate than a new efficient building.
Self-check
- Do I distinguish between operational, embodied and upfront carbon?
- Have I counted the carbon of demolition as well as new construction?
- Have I tested how the answer changes with the grid, the amount of new material and the building's efficiency?
- Have I used the carbon breakdown to improve the design?
Common mistakes
MistakeComparing only operating energy when choosing between reuse and new construction.
InsteadCount upfront carbon, including demolition, as well as operating emissions over a stated period.
MistakeTreating the slogan about the greenest building as proof.
InsteadRun the numbers for the project, because the result depends on the grid, the scope of work and the building.
MistakeStripping a building to its frame and still calling it low-carbon reuse.
InsteadKeep as much structure, envelope and fabric as possible, and count the new material honestly.
MistakeIgnoring refrigerants.
InsteadCount refrigerant leakage in heat pump systems and choose low-impact refrigerants.
MistakeAssuming every efficiency upgrade lowers carbon.
InsteadWeigh the embodied carbon of upgrades against their operating savings, especially on a clean grid.
Summary and key terms
- A building's emissions come from operational carbon and from embodied carbon, which includes upfront carbon released before occupation.
- Life cycle assessment divides a building's life into stages A1 to A5, B, C and D.
- Reuse keeps the structure and envelope, which hold most of a new building's upfront carbon, and avoids demolition.
- The Greenest Building study found new efficient buildings take ten to eighty years, typically twenty to thirty, to overcome their construction impact.
- For the Stanfield on Manitoba's hydro grid, a new building would effectively never catch up; reuse is clearly lower in carbon.
- Operational carbon
- Emissions from the energy used to operate a building.
- Embodied carbon
- Emissions from making, transporting, installing, maintaining and disposing of a building's materials.
- Upfront carbon
- Embodied emissions released before a building is occupied, stages A1 to A5.
- Life cycle assessment
- A method of counting the environmental impacts of a building or product over its life.
- Carbon payback
- The time a more efficient new building needs to offset, through lower operating emissions, its higher upfront emissions.
Practice problems
Work each problem on paper first, then reveal the answer to check.
Which life cycle stages make up upfront carbon?
Show answer
A1 to A5: product, transport to site and construction.
Why does reuse save so much upfront carbon?
Show answer
The structure, foundations and envelope, which hold most of a new building's upfront carbon, are kept.
What range of payback periods did The Greenest Building find?
Show answer
Ten to eighty years, with twenty to thirty typical for most building types and climates.
How does a cleaner electricity grid affect the payback of a new efficient building?
Show answer
It lengthens it, because the operating savings in carbon shrink.
Name two ways the students reduced the upfront carbon of the Stanfield conversion.
Show answer
Repairing original windows, reusing salvaged timber, reducing steel in the addition, a lower-carbon floor topping and minimal finishes.
Lesson quiz · 5 questions
Score 60% or more to complete this lesson.
Create a free account to save your progress, take quizzes and earn a certificate.