
AI-320 · Lesson 3 of 12 · 31 min
Graphical models
A probabilistic model of a realistic problem involves many variables: symptoms and diseases, words and topics, pixels and objects, sensor readings and hidden machine states. Writing down their joint distribution directly is hopeless. Twenty binary variables already have \(2^{20} - 1\), about a million, free probabilities, and inference by summing over the table is equally impossible. Graphical models make large models tractable by exploiting structure: most variables interact directly with only a few others. A graph records which variables depend directly on which, the joint distribution factorizes accordingly, and inference algorithms work on the graph. This lesson covers directed models (Bayesian networks), conditional independence and d-separation, undirected models, exact inference by variable elimination and message passing, and hidden Markov models as a worked example.
Bayesian networks
A Bayesian network is a directed acyclic graph (DAG) whose nodes are random variables, together with a conditional distribution for each node given its parents. The joint distribution is the product of these local conditionals:
The chain rule of probability always allows a joint distribution to be written as a product of conditionals, \(p(x_1)p(x_2 \mid x_1)p(x_3 \mid x_1, x_2)\cdots\). The graph's contribution is to drop most of the conditioning variables, asserting that each variable depends directly only on its parents. That assertion is what saves parameters and computation.
A classic small example concerns a wet lawn. Cloudy weather (C) makes rain (R) more likely and makes it less likely that the sprinkler (S) is switched on; both rain and the sprinkler can make the grass wet (W). The joint distribution factorizes as \(p(C)\,p(S \mid C)\,p(R \mid C)\,p(W \mid S, R)\). With binary variables, the full table needs 15 free numbers; the network needs \(1 + 2 + 2 + 4 = 9\). For large networks, the saving is exponential: a node with \(k\) binary parents needs \(2^k\) numbers, so a network in which every node has at most three parents grows linearly with the number of nodes rather than exponentially.
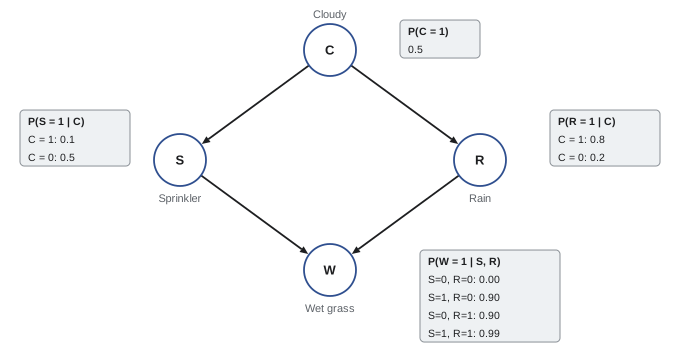
Bayesian networks are often built from causal knowledge, drawing arrows from causes to effects, which makes them easy for domain experts to specify and interpret. Strictly, though, a Bayesian network encodes only conditional independence; giving the arrows a causal meaning, so that the network predicts the effect of interventions, is an additional assumption studied in causal inference.
Inference by enumeration
Inference means computing the distribution of some variables given observed values of others, such as \(P(R = 1 \mid W = 1)\): given that the grass is wet, how likely is it that it rained? The direct method sums the joint distribution over all unobserved variables, then normalizes.
import itertools

pC = {1: 0.5, 0: 0.5}
pS = {1: {1: 0.1, 0: 0.9}, 0: {1: 0.5, 0: 0.5}}          # pS[c][s]
pR = {1: {1: 0.8, 0: 0.2}, 0: {1: 0.2, 0: 0.8}}          # pR[c][r]
pW1 = {(0, 0): 0.0, (1, 0): 0.9, (0, 1): 0.9, (1, 1): 0.99}  # P(W=1 | s, r)

def joint(c, s, r, w):
    pw = pW1[(s, r)] if w == 1 else 1 - pW1[(s, r)]
    return pC[c] * pS[c][s] * pR[c][r] * pw

def prob(query, evidence):
    num = den = 0.0
    for c, s, r, w in itertools.product([0, 1], repeat=4):
        x = dict(C=c, S=s, R=r, W=w)
        if all(x[k] == v for k, v in evidence.items()):
            p = joint(c, s, r, w)
            den += p
            if all(x[k] == v for k, v in query.items()):
                num += p
    return num / den

print(f"P(R=1)             = {prob(dict(R=1), dict()):.3f}")
print(f"P(R=1 | W=1)       = {prob(dict(R=1), dict(W=1)):.3f}")
print(f"P(R=1 | W=1, S=1)  = {prob(dict(R=1), dict(W=1, S=1)):.3f}")
print(f"P(S=1 | W=1)       = {prob(dict(S=1), dict(W=1)):.3f}")
print(f"P(S=1 | W=1, R=1) = {prob(dict(S=1), dict(W=1, R=1)):.3f}")P(R=1) = 0.500 P(R=1 | W=1) = 0.708 P(R=1 | W=1, S=1) = 0.320 P(S=1 | W=1) = 0.430 P(S=1 | W=1, R=1) = 0.194
Observing wet grass raises the probability of rain from 0.5 to about 0.71. Learning that the sprinkler was on then lowers it again, to about 0.32: the sprinkler explains the wet grass, so rain is no longer needed as an explanation. Likewise, learning that it rained lowers the probability that the sprinkler was on. This pattern, in which two causes of a common effect become dependent once the effect is observed, is called explaining away. It is one of the reasoning patterns that graphical models capture naturally and that simple rule-based systems get wrong.
Conditional independence and d-separation
The graph structure implies conditional independence relationships that hold for any choice of the conditional probability tables. They follow from three basic patterns of three nodes:
- Chain, \(A \to B \to C\): \(A\) and \(C\) are dependent, but independent given \(B\). Observing the middle variable blocks the flow of information.
- Fork (common cause), \(A \leftarrow B \to C\): \(A\) and \(C\) are dependent, because they share a cause, but independent given \(B\). Ice cream sales and drownings are correlated through summer weather; given the weather, they are not.
- Collider (common effect), \(A \to B \leftarrow C\): \(A\) and \(C\) are independent, but become dependent given \(B\), or given any descendant of \(B\). This is explaining away; it is also the source of selection bias, such as Berkson's paradox, in which conditioning on admission to a hospital creates a spurious negative correlation between two unrelated diseases.
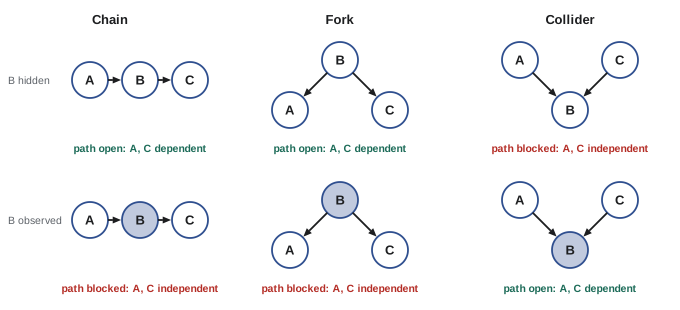
D-separation extends these rules to whole graphs. A path between two nodes is blocked by a set of observed nodes \(Z\) if it contains a chain or fork whose middle node is in \(Z\), or a collider whose middle node is not in \(Z\) and has no descendant in \(Z\). If every path between \(X\) and \(Y\) is blocked, then \(X\) and \(Y\) are d-separated by \(Z\), and they are conditionally independent given \(Z\) in every distribution that factorizes according to the graph.
A useful consequence is the Markov blanket: a node is conditionally independent of all other nodes given its parents, its children and its children's other parents. Only the Markov blanket matters when updating one variable, which is what makes Gibbs sampling (Lesson 7) efficient on graphical models.
Worked problem
Reading independence from a graph
In the sprinkler network, decide whether each statement holds: (a) S and R are independent; (b) S and R are independent given C; (c) S and R are independent given C and W.
Show solution
- (a) Paths from S to R: S ← C → R (a fork through unobserved C, open) and S → W ← R (a collider at unobserved W, blocked). One open path: S and R are dependent.
- (b) Given C, the fork is blocked and the collider remains blocked: S and R are independent given C.
- (c) Given C and W, the fork is blocked but the collider at W is now open: S and R are dependent.
Answer: (a) No, (b) yes, (c) no. Case (c) is explaining away: once the grass is known to be wet, knowing about one cause changes belief in the other, even when the weather is known.
Undirected models: Markov random fields
Some dependencies have no natural direction: neighbouring pixels in an image, adjacent atoms in a magnetic material, or words that tend to co-occur. A Markov random field (MRF) uses an undirected graph and defines the joint distribution as a normalized product of non-negative potential functions over the cliques (fully connected subsets) of the graph:
Potentials are not probabilities; they express compatibility, with larger values for configurations that are more likely. Writing \(\psi_c = \exp(-E_c)\) gives the energy-based form \(p(\mathbf x) \propto \exp(-E(\mathbf x))\). The Ising model, with binary spins on a grid and an energy that rewards neighbours agreeing, is the classic MRF; image denoising models use the same structure to prefer smooth images. Conditional independence in an MRF is simpler than in a Bayesian network: two sets of nodes are independent given a third if every path between them passes through the third.
The normalizing constant \(Z\), the partition function, is a sum over all configurations and is generally intractable. This makes learning MRF parameters harder than learning Bayesian network tables, which can be estimated by counting. Conditional random fields (CRFs), which model \(p(\mathbf y \mid \mathbf x)\) as an MRF over labels \(\mathbf y\) given inputs \(\mathbf x\), were the standard model for sequence labelling before neural sequence models and are still used as output layers on top of them.
Both directed and undirected models can be converted to factor graphs, bipartite graphs with one node per variable and one node per factor, connected when the factor involves the variable. Factor graphs are the natural setting for the message-passing algorithms below.
Exact inference
Variable elimination
Enumeration costs time exponential in the number of variables. Variable elimination does much better by pushing sums inside the product and summing out one variable at a time. For a chain \(A \to B \to C \to D\), the marginal of \(D\) is
Computing the innermost sum gives a table over \(b\), which is then used in the next sum, and so on: each step costs \(k^2\) operations for variables with \(k\) states, so the chain costs \(O(nk^2)\) instead of \(O(k^n)\). In a general graph, summing out a variable creates a new factor over all its neighbours, and the cost depends on the largest such factor created. The best possible elimination order gives a cost exponential in the treewidth of the graph. Trees and chains have treewidth 1 and are easy; grids and densely connected graphs have large treewidth, and exact inference becomes intractable. In general, exact inference in Bayesian networks is NP-hard, which motivates the approximate methods of Lessons 7 and 9.
import numpy as np

rng = np.random.default_rng(0)
n, k = 10, 4                                   # chain of 10 variables with 4 states each
p0 = rng.dirichlet(np.ones(k))
T = [rng.dirichlet(np.ones(k), size=k) for _ in range(n - 1)]   # T[i][a, b] = p(x_{i+1}=b | x_i=a)

# variable elimination: push the sums inward, one variable at a time
msg = p0.copy()
ops_ve = 0
for t in T:
    msg = msg @ t
    ops_ve += k * k
print("marginal of last variable (elimination):", np.round(msg, 4))

# brute force: build the full joint table over all 4**10 configurations
joint = p0.copy()
for t in T:
    joint = joint[..., None] * t.reshape((1,) * (joint.ndim - 1) + (k, k))
brute = joint.reshape(-1, k).sum(axis=0)
print("marginal of last variable (brute force):", np.round(brute, 4))
print(f"table entries: elimination {ops_ve}, brute force {k ** n:,}")marginal of last variable (elimination): [0.149 0.3362 0.1665 0.3483] marginal of last variable (brute force): [0.149 0.3362 0.1665 0.3483] table entries: elimination 144, brute force 1,048,576
Belief propagation
On a tree-structured graph, all marginals can be computed at once by passing messages along the edges. The message from node \(i\) to neighbour \(j\) summarizes everything on \(i\)'s side of the edge:
where \(\phi_i\) is the local evidence at node \(i\). After messages have passed from the leaves to a root and back, each node's marginal is proportional to its local evidence times all incoming messages. This sum-product algorithm costs twice a single variable elimination but delivers every marginal. Replacing sums by maximizations gives the max-product algorithm, which finds the most probable joint configuration. On graphs with cycles, the same updates can be iterated anyway; this loopy belief propagation is not guaranteed to converge or to be exact, but it works remarkably well in some applications, notably the decoding of turbo and LDPC error-correcting codes used in mobile and Wi-Fi communication.
Hidden Markov models
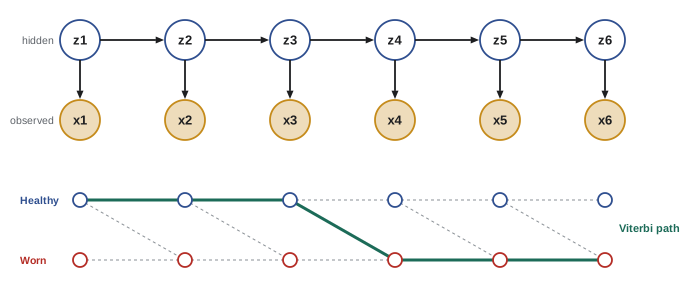
A hidden Markov model (HMM) is a Bayesian network for sequences. A hidden state \(z_t\) evolves as a Markov chain with transition matrix \(A_{ij} = p(z_{t+1} = j \mid z_t = i)\), and at each step emits an observation \(x_t\) with distribution \(p(x_t \mid z_t)\). The joint distribution is
HMMs model speech (hidden phonemes, observed acoustics), gene sequences (hidden coding regions, observed bases), machine condition monitoring (hidden health states, observed vibration levels) and many other sequential problems. The graph is a chain, so exact inference is efficient. The forward algorithm computes \(\alpha_t(j) = p(x_1, \ldots, x_t, z_t = j)\) recursively, \(\alpha_{t+1}(j) = p(x_{t+1} \mid j)\sum_i \alpha_t(i)A_{ij}\), giving the likelihood of the whole sequence in \(O(TK^2)\) time for \(K\) states. A backward pass gives the smoothed marginals \(p(z_t \mid \mathbf x)\), and the Viterbi algorithm, the max-product version, finds the most probable state sequence.
import numpy as np

# Machine health: state 0 = healthy, 1 = worn. Observation: vibration level 0 = low, 1 = medium, 2 = high.
pi = np.array([0.95, 0.05])
A = np.array([[0.90, 0.10],
              [0.00, 1.00]])                 # wear does not repair itself
B = np.array([[0.70, 0.25, 0.05],            # B[state, observation]
              [0.10, 0.40, 0.50]])
x = [0, 0, 1, 0, 1, 2, 1, 2, 2]

# forward algorithm with scaling, giving filtered probabilities p(z_t | x_1..t)
alpha = pi * B[:, x[0]]
loglik = np.log(alpha.sum()); alpha /= alpha.sum()
filtered = [alpha[1]]
for obs in x[1:]:
    alpha = (alpha @ A) * B[:, obs]
    loglik += np.log(alpha.sum()); alpha /= alpha.sum()
    filtered.append(alpha[1])
print("P(worn | data so far):", np.round(filtered, 3))
print(f"log-likelihood of sequence: {loglik:.3f}")

# Viterbi: most probable state sequence (log domain)
with np.errstate(divide="ignore"):
    lA, lB, lpi = np.log(A), np.log(B), np.log(pi)
delta = lpi + lB[:, x[0]]; back = []
for obs in x[1:]:
    scores = delta[:, None] + lA
    back.append(scores.argmax(axis=0))
    delta = scores.max(axis=0) + lB[:, obs]
path = [int(delta.argmax())]
for b in reversed(back):
    path.append(int(b[path[-1]]))
print("Viterbi path (0 healthy, 1 worn):", path[::-1])P(worn | data so far): [0.007 0.017 0.172 0.047 0.209 0.802 0.881 0.988 0.999] log-likelihood of sequence: -8.280 Viterbi path (0 healthy, 1 worn): [0, 0, 0, 0, 1, 1, 1, 1, 1]
The filtered probability of wear rises as medium and high vibration readings accumulate and dips after a low reading, while the Viterbi path commits to a single change point. Because the model forbids recovery, the Viterbi path switches from healthy to worn exactly once, at the fifth reading, even though the filtered probability of wear there is only 0.21: Viterbi uses the whole sequence, including the high readings that follow, whereas filtering uses only the past. In practice the parameters are rarely known and are learned from data with the EM algorithm of Lesson 5 (in the HMM case called the Baum-Welch algorithm).
Naive Bayes as a graphical model
The naive Bayes classifier is the simplest useful Bayesian network: a class variable \(y\) with arrows to every feature, \(p(y, \mathbf x) = p(y)\prod_j p(x_j \mid y)\). The graph asserts that features are independent given the class, which is rarely true, yet naive Bayes classifies surprisingly well, particularly for text, because classification only requires the correct class to score highest, not calibrated probabilities. Its probability estimates, however, are typically overconfident, because correlated features are counted as independent evidence. Seeing it as a graphical model also shows how to relax the assumption, by adding edges between features (tree-augmented naive Bayes) or latent variables (Lesson 5).
Lesson 4 continues with learning the structure and parameters of graphical models, approximate inference in graphs with loops, and causal models; Lesson 11 extends hidden Markov models to continuous states with the Kalman filter.
Common mistakes
MistakeAssuming two causes stay independent when their common effect is observed.
InsteadObserving a collider (or its descendant) makes its parents dependent: explaining away.
MistakeReading the arrows of a Bayesian network as causal without justification.
InsteadThe graph encodes conditional independence; causal interpretation needs extra assumptions.
MistakeRunning exact inference by enumerating the joint table.
InsteadUse variable elimination or message passing; cost depends on treewidth, not on the number of variables.
MistakeRunning the forward algorithm without scaling or logs.
InsteadProbabilities underflow on long sequences; normalize at each step or work in the log domain.
MistakeTrusting naive Bayes probabilities as calibrated.
InsteadCorrelated features are double-counted, making probabilities overconfident; calibrate if probabilities matter.
Summary and key terms
- Graphical models represent large joint distributions as products of local factors.
- Bayesian networks: DAGs with \(p(\mathbf x) = \prod_i p(x_i \mid \mathrm{pa}(x_i))\); parameters grow with the number of parents, not exponentially in the number of nodes.
- Chains and forks are blocked by observing the middle node; colliders are opened by it (explaining away).
- D-separation reads all implied conditional independencies from the graph; the Markov blanket shields a node from the rest.
- Markov random fields use potentials on cliques, normalized by an often intractable partition function.
- Variable elimination pushes sums inward; its cost is exponential in treewidth, and exact inference is NP-hard in general.
- Belief propagation computes all marginals on trees by message passing; loopy BP is an approximation.
- HMMs are chain-structured: forward filtering, smoothing and Viterbi decoding run in \(O(TK^2)\).
- Naive Bayes is a simple Bayesian network that classifies well but gives overconfident probabilities.
- Bayesian network
- A directed acyclic graph with a conditional distribution for each node given its parents.
- Conditional probability table
- The table of a discrete node's distribution for each combination of parent values.
- Explaining away
- Dependence induced between two causes when their common effect is observed.
- Collider
- A node with two incoming arrows on a path.
- D-separation
- A graphical criterion for conditional independence in a Bayesian network.
- Markov blanket
- A node's parents, children and children's other parents.
- Markov random field
- An undirected graphical model defined by clique potentials.
- Partition function
- The normalizing constant of an undirected model.
- Factor graph
- A bipartite graph of variables and the factors that involve them.
- Variable elimination
- Exact inference by summing out variables one at a time.
- Treewidth
- A graph property governing the cost of exact inference.
- Belief propagation
- Message passing that computes marginals exactly on trees.
- Hidden Markov model
- A Markov chain of hidden states, each emitting an observation.
- Viterbi algorithm
- Dynamic programming for the most probable hidden state sequence.
Practice problems
Work each problem on paper first, then reveal the answer to check.
How many free parameters does a full joint table over 10 binary variables have? A network where each node has at most 2 binary parents?
Show answer
2¹⁰ − 1 = 1023; at most 10 × 2² = 40.
Write the factorization of a network with edges A → C, B → C, C → D.
Show answer
p(a) p(b) p(c | a, b) p(d | c).
In that network, are A and B independent? Given D?
Show answer
Independent marginally (C is an unobserved collider); dependent given D, a descendant of the collider.
Give a real example of a fork and explain why conditioning removes the correlation.
Show answer
Shoe size and reading ability in children, both caused by age; given age, they are unrelated.
What is the Markov blanket of C in the network A → C, B → C, C → D, E → D?
Show answer
Parents A, B; child D; child's other parent E.
For a chain of 50 variables with 10 states each, compare the cost of enumeration and variable elimination.
Show answer
Enumeration ~10⁵⁰ terms; elimination ~50 × 10² = 5000 operations.
Why is the partition function a problem for learning MRFs but not Bayesian networks?
Show answer
Bayesian network factors are normalized conditionals estimated locally by counting; MRF potentials share a global normalizer that couples all parameters and is a sum over all configurations.
An HMM has 20 states and sequences of length 1000. How many operations does the forward algorithm need, roughly?
Show answer
T K² = 1000 × 400 = 400,000.
Why do HMM implementations scale α at each step?
Show answer
Products of many probabilities underflow floating point; scaling (or logs) keeps values representable, and the scale factors give the log-likelihood.
Why are naive Bayes probabilities often overconfident?
Show answer
Correlated features are treated as independent evidence, so their contributions multiply as if they were separate confirmations.
Lesson quiz · 5 questions
Score 60% or more to complete this lesson.
Create a free account to save your progress, take quizzes and earn a certificate.