
AI-320 · Lesson 7 of 12 · 30 min
Monte Carlo sampling
Almost every quantity of interest in Bayesian inference is an expectation under the posterior: the posterior mean is \(\mathbb E[\theta \mid D]\), a predictive probability is \(\mathbb E[p(\tilde x \mid \theta)]\), a credible interval comes from posterior quantiles, and the probability that B beats A is \(\mathbb E[\mathbf 1(p_B > p_A)]\). Lessons 1 and 3 computed these exactly for conjugate models and small discrete networks. Realistic models have posteriors with no closed form, over thousands or millions of dimensions, where exact integration is impossible. Monte Carlo methods replace integrals by averages over random samples. This lesson covers basic Monte Carlo estimation, direct sampling methods, importance sampling, Markov chain Monte Carlo (MCMC) with the Metropolis-Hastings and Gibbs algorithms, convergence diagnostics, and Hamiltonian Monte Carlo, the engine of modern probabilistic programming.
Monte Carlo estimation
If \(x^{(1)}, \ldots, x^{(S)}\) are independent samples from \(p(x)\), then for any function \(f\)
The estimate is unbiased, and by the central limit theorem its standard error is \(\sigma_f/\sqrt S\), where \(\sigma_f\) is the standard deviation of \(f(x)\). Two facts make Monte Carlo powerful: the error does not depend on the dimension of \(x\), unlike grid-based numerical integration, whose cost grows exponentially with dimension; and the error can be estimated from the samples themselves. The price is slow convergence: each extra decimal digit of accuracy costs 100 times as many samples.
import numpy as np

rng = np.random.default_rng(0)
for S in [100, 10_000, 1_000_000]:
    pts = rng.uniform(-1, 1, size=(S, 2))
    inside = (pts ** 2).sum(axis=1) <= 1
    est = 4 * inside.mean()
    se = 4 * inside.std(ddof=1) / np.sqrt(S)
    print(f"S = {S:>9,}:  pi estimate {est:.5f}  standard error {se:.5f}  actual error {abs(est - np.pi):.5f}")

# the same estimator in 20 dimensions: fraction of the cube inside the unit ball
d, S = 20, 1_000_000
pts = rng.uniform(-1, 1, size=(S, d))
print(f"fraction of 20-D cube inside the ball: {np.mean((pts ** 2).sum(axis=1) <= 1):.2e} (exact 2.46e-08)")S = 100: pi estimate 2.92000 standard error 0.17848 actual error 0.22159 S = 10,000: pi estimate 3.16360 standard error 0.01627 actual error 0.02201 S = 1,000,000: pi estimate 3.14152 standard error 0.00164 actual error 0.00007 fraction of 20-D cube inside the ball: 0.00e+00 (exact 2.46e-08)
The standard error shrinks by a factor of 10 for every 100-fold increase in samples, and it correctly predicts the typical size of the actual error. The second experiment shows the catch: the error is independent of dimension only relative to the standard deviation of \(f\). In 20 dimensions, the unit ball fills only \(2.5 \times 10^{-8}\) of the cube, so not one of a million uniform samples lands inside it and the estimate is exactly zero. Sampling from the wrong distribution wastes nearly all samples, which is why the rest of this lesson is about drawing samples from the distribution that matters.
Sampling from simple distributions
Inverse transform sampling
If \(u\) is uniform on (0, 1) and \(F\) is a cumulative distribution function, then \(x = F^{-1}(u)\) has distribution \(F\). For the exponential distribution with rate \(\lambda\), \(F(x) = 1 - e^{-\lambda x}\), so \(x = -\log(1 - u)/\lambda\). Inverse transforms are exact and efficient when \(F^{-1}\) is available; standard libraries use them, along with specialized transformations such as the Box-Muller method for normal variables, to sample all the common distributions.
Rejection sampling
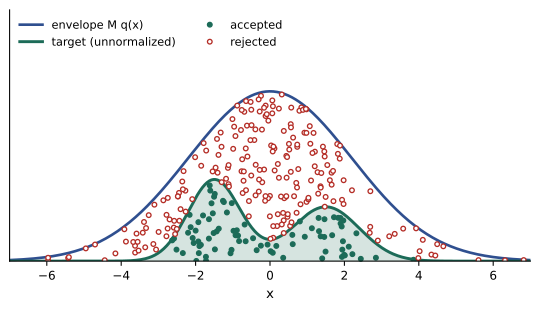
To sample from a density \(p(x) = \tilde p(x)/Z\) known only up to its normalizing constant, choose a proposal \(q(x)\) that is easy to sample and a constant \(M\) with \(\tilde p(x) \le Mq(x)\) everywhere. Draw \(x \sim q\) and \(u \sim U(0, 1)\), and accept \(x\) if \(u < \tilde p(x)/(Mq(x))\). Accepted samples are exact draws from \(p\). The acceptance rate is \(Z/M\), so rejection sampling works only when \(q\) matches \(p\) closely. In high dimensions even small mismatches compound across dimensions, \(M\) becomes astronomically large, and almost every proposal is rejected.
Importance sampling
Instead of rejecting samples, importance sampling keeps them all and weights them. For samples \(x^{(s)} \sim q\),
If \(p\) is known only up to a constant, the self-normalized estimator divides by \(\sum_s w_s\) instead of \(S\). Importance sampling is valuable for rare events, where a good proposal places samples in the important region, and for reweighting samples from one distribution to answer questions about another, as in off-policy evaluation in reinforcement learning. Its weakness is weight degeneracy: if \(q\) has lighter tails than \(p\) or is poorly matched, a few samples carry nearly all the weight and the estimate is unreliable. The effective sample size, \(\mathrm{ESS} = (\sum w_s)^2/\sum w_s^2\), measures how many equally weighted samples the weighted set is worth.
import numpy as np
from scipy.stats import norm

rng = np.random.default_rng(1)
S = 10_000
exact = norm.sf(4.5)                                     # P(X > 4.5) for X ~ N(0, 1)

x = rng.normal(size=S)                                   # naive Monte Carlo
naive = np.mean(x > 4.5)

y = rng.normal(loc=4.5, size=S)                          # proposal centred on the rare region
w = norm.pdf(y) / norm.pdf(y, loc=4.5)
vals = w * (y > 4.5)
imp = vals.mean()
se = vals.std(ddof=1) / np.sqrt(S)
ess = w.sum() ** 2 / (w ** 2).sum()

print(f"exact               {exact:.3e}")
print(f"naive MC            {naive:.3e}  (number of hits: {int(np.sum(x > 4.5))})")
print(f"importance sampling {imp:.3e}  +/- {se:.1e}")
print(f"ESS of the weights for estimating the whole distribution: {ess:.1f} of {S}")exact 3.398e-06 naive MC 0.000e+00 (number of hits: 0) importance sampling 3.464e-06 +/- 7.8e-08 ESS of the weights for estimating the whole distribution: 8.5 of 10000
Naive Monte Carlo with 10,000 samples almost never sees an event with probability \(3.4 \times 10^{-6}\), while importance sampling with a shifted proposal estimates it to within about 2%, consistent with its reported standard error. The tiny ESS shows the other side: the same weighted samples would be useless for estimating anything about the bulk of \(p\). A proposal must be matched to the question being asked.
Markov chain Monte Carlo
Rejection and importance sampling need a proposal that already resembles the target, which is impractical for complex posteriors in many dimensions. MCMC takes a different approach: it constructs a Markov chain that wanders through the parameter space and whose long-run distribution of states is the target \(p(x)\). Each state depends on the previous one, so the samples are correlated, but averages over a long run still converge to expectations under \(p\).
A Markov chain with transition kernel \(T(x' \mid x)\) leaves \(p\) invariant if \(\int T(x' \mid x)\,p(x)\,dx = p(x')\). A simple sufficient condition is detailed balance:
meaning that, at equilibrium, the flow of probability from \(x\) to \(x'\) equals the flow back. If the chain also can reach every region (irreducibility) and does not cycle periodically, it converges to \(p\) from any starting point.
Metropolis-Hastings
The Metropolis-Hastings algorithm builds such a chain from any proposal distribution \(q(x' \mid x)\). From the current state \(x\), propose \(x' \sim q(x' \mid x)\) and accept it with probability
otherwise stay at \(x\) (and count \(x\) again as the next sample). Only the ratio \(\tilde p(x')/\tilde p(x)\) is needed, so the normalizing constant, which is the hard part of Bayesian inference, cancels. With a symmetric proposal such as a Gaussian random walk, \(q\) cancels too, giving the original Metropolis algorithm: always move uphill, and move downhill with probability equal to the density ratio.
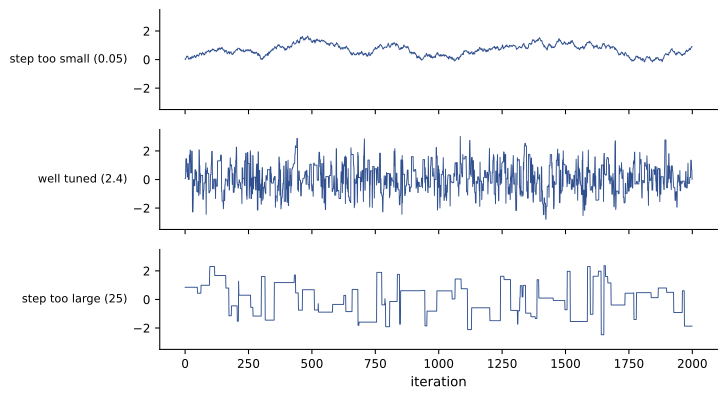
The proposal scale controls efficiency. Tiny steps are almost always accepted but explore slowly, like a random walk with short strides; huge steps propose distant points that are almost always rejected, so the chain sits still. For random-walk Metropolis in high dimensions, theory suggests tuning the scale for an acceptance rate around 23%, and around 44% in one dimension.
import numpy as np

def log_target(x):                       # correlated 2-D Gaussian, correlation 0.9
    P = np.linalg.inv(np.array([[1.0, 0.9], [0.9, 1.0]]))
    return -0.5 * x @ P @ x

def ess(chain):                          # effective sample size from autocorrelations
    x = chain - chain.mean(); n = len(x)
    acf = np.correlate(x, x, mode="full")[n - 1:] / (x @ x)
    s = 0.0
    for k in range(1, n // 2, 2):        # sum pairs while positive (Geyer)
        pair = acf[k] + acf[k + 1]
        if pair < 0: break
        s += pair
    return n / (1 + 2 * s)

rng = np.random.default_rng(2)
for step in [0.05, 0.5, 1.2, 5.0]:
    x = np.zeros(2); lp = log_target(x); chain = []; acc = 0
    for _ in range(20_000):
        prop = x + step * rng.normal(size=2)
        lp_prop = log_target(prop)
        if np.log(rng.uniform()) < lp_prop - lp:
            x, lp = prop, lp_prop; acc += 1
        chain.append(x[0])
    chain = np.array(chain[2000:])
    print(f"step {step:4.2f}: acceptance {acc / 20_000:5.1%}  mean {chain.mean():+.3f}  "
f"var {chain.var():.3f} ESS {ess(chain):7.0f} of {len(chain)}")step 0.05: acceptance 94.7% mean -0.109 var 0.709 ESS 5 of 18000 step 0.50: acceptance 53.9% mean -0.042 var 0.998 ESS 273 of 18000 step 1.20: acceptance 25.8% mean -0.019 var 0.964 ESS 823 of 18000 step 5.00: acceptance 3.4% mean -0.020 var 1.025 ESS 229 of 18000
The true mean is 0 and the variance is 1. The smallest step accepts almost every proposal but moves so little that 18,000 samples are worth only a handful of independent ones, and its estimates are poor. The largest step rejects nearly everything. The intermediate scales, with acceptance rates of about 25 to 55%, give far more effective samples, and the best of the four, at 26% acceptance, is close to the theoretical optimum. Even the best scale yields an ESS far below the chain length, because the strong correlation forces small steps along the narrow direction; this is the motivation for the gradient-based methods below.
Gibbs sampling
Gibbs sampling updates one variable (or block of variables) at a time by sampling it from its full conditional distribution given all the others, \(x_i \sim p(x_i \mid \mathbf x_{-i})\). It is a special case of Metropolis-Hastings whose acceptance probability is always 1. In a graphical model, the full conditional depends only on the variable's Markov blanket (Lesson 3), and in conjugate models it often has a standard form, so Gibbs sampling needs no tuning. It was the workhorse of Bayesian computation for decades, through software such as BUGS and JAGS, and is still used for topic models and many hierarchical models.
Its weakness is strongly correlated variables: updating one coordinate at a time with the other held fixed allows only tiny moves along a narrow ridge, so the chain mixes slowly.
import numpy as np

rng = np.random.default_rng(3)
for rho in [0.0, 0.9, 0.99]:
    x = y = 0.0; xs = []
    sd = np.sqrt(1 - rho ** 2)
    for _ in range(20_000):
        x = rng.normal(rho * y, sd)          # x | y ~ N(rho y, 1 - rho^2)
        y = rng.normal(rho * x, sd)          # y | x ~ N(rho x, 1 - rho^2)
        xs.append(x)
    xs = np.array(xs[1000:])
    lag1 = np.corrcoef(xs[:-1], xs[1:])[0, 1]
    print(f"rho = {rho:4.2f}: lag-1 autocorrelation {lag1:.3f}  (theory {rho ** 2:.3f})  "
f"sample variance {xs.var():.3f}")rho = 0.00: lag-1 autocorrelation -0.001 (theory 0.000) sample variance 0.988 rho = 0.90: lag-1 autocorrelation 0.807 (theory 0.810) sample variance 0.993 rho = 0.99: lag-1 autocorrelation 0.980 (theory 0.980) sample variance 0.969
For the bivariate normal, the lag-1 autocorrelation of the Gibbs chain is \(\rho^2\). At \(\rho = 0.99\) it is 0.98, so roughly 100 iterations are needed per effectively independent sample. Reparameterizing to reduce posterior correlations, or updating correlated variables together in blocks, are the standard remedies.
Diagnosing convergence
An MCMC run produces numbers whatever happens, so checking that they represent the target is essential. Standard practice:
- Burn-in (warm-up): discard the early part of each chain, before it reaches the high-probability region from its arbitrary starting point. Modern samplers also use warm-up to tune step sizes.
- Trace plots: plot each parameter against iteration. A healthy chain looks like stationary noise ("a fuzzy caterpillar"); trends, long flat stretches or slow wandering indicate problems.
- Multiple chains from dispersed starting points: if they agree, there is some confidence they have found the same distribution. The potential scale reduction factor \(\hat R\) compares the variance between chains with the variance within them; values above about 1.01 signal that the chains have not mixed.
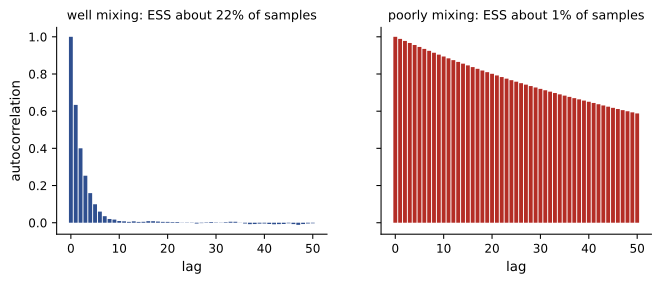
- Effective sample size: because samples are autocorrelated, \(S\) correlated draws carry the information of \(\mathrm{ESS} = S/(1 + 2\sum_k \rho_k)\) independent ones, where \(\rho_k\) is the lag-\(k\) autocorrelation. The Monte Carlo standard error of a posterior mean is \(\sigma/\sqrt{\mathrm{ESS}}\). A few hundred effective samples per quantity is usually enough for means and central intervals; tail quantiles need more.
Diagnostics can show that something is wrong but never prove that a chain has converged: a multimodal posterior can trap every chain in one mode, and all diagnostics then look perfect. Thinning (keeping every \(k\)th sample) saves storage but does not improve estimates.
Worked problem
Effective sample size and standard error
A chain of 10,000 samples of a parameter has lag-\(k\) autocorrelations approximately \(0.8^k\). The posterior standard deviation is 2.0. Estimate the ESS and the Monte Carlo standard error of the posterior mean.
Show solution
- \(\sum_{k \ge 1} 0.8^k = 0.8/(1 - 0.8) = 4\).
- \(\mathrm{ESS} = 10{,}000/(1 + 2 \times 4) = 10{,}000/9 = 1111\).
- Standard error: \(2.0/\sqrt{1111} = 0.060\).
Answer: About 1100 effective samples and a Monte Carlo standard error of 0.06, small compared with the posterior standard deviation of 2.0, so the posterior mean is estimated adequately.
Hamiltonian Monte Carlo
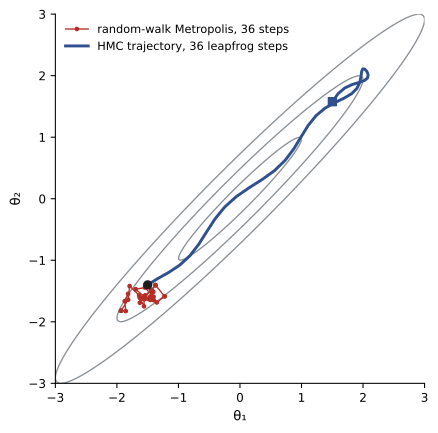
Random-walk proposals explore by diffusion, so the number of steps needed to cross a distribution grows with the square of its width relative to the step size, and in \(d\) dimensions the step size must shrink as dimension grows. Hamiltonian Monte Carlo (HMC) uses the gradient of the log density to make long, directed moves. It introduces an auxiliary momentum variable \(\mathbf r\) and treats \(-\log\tilde p(\mathbf x)\) as a potential energy surface: a frictionless particle with random initial momentum slides across the surface, following Hamilton's equations, and its end point is the proposal.
The dynamics are simulated with the leapfrog integrator for \(L\) steps of size \(\epsilon\), and a Metropolis test corrects for integration error. Because the simulated trajectory nearly conserves \(H\), proposals far from the start are accepted with high probability. HMC scales much better with dimension than random-walk methods and handles correlated posteriors well, especially when the mass matrix \(M\) is adapted to the posterior covariance during warm-up.
The No-U-Turn Sampler (NUTS) chooses the trajectory length automatically by extending it until it starts to double back, and with step-size adaptation it makes HMC essentially tuning-free. NUTS is the default sampler in Stan, PyMC and NumPyro, which let users write a model in a few lines and obtain posterior samples together with diagnostics such as \(\hat R\), ESS and divergent-transition warnings, which flag regions of high curvature where the sampler cannot be trusted. HMC requires continuous parameters and differentiable log densities; discrete latent variables must be summed out or handled with other samplers.
Sequential Monte Carlo
Some problems require updating a posterior repeatedly as data arrive, such as tracking a moving object or estimating a machine's hidden state from streaming sensor data. Particle filters represent the posterior over the current state by a weighted set of samples (particles): each new observation reweights them by its likelihood (importance sampling), and resampling replaces low-weight particles with copies of high-weight ones to avoid degeneracy. Particle filters generalize the HMM forward algorithm of Lesson 3 to continuous and non-linear state spaces, and sequential Monte Carlo methods built on the same ideas also estimate marginal likelihoods.
Lesson 8 applies these samplers to Bayesian regression and hierarchical models, Lesson 10 places them inside probabilistic programming systems and the Bayesian workflow, and Lesson 11 develops particle filters in detail.
Common mistakes
MistakeReporting MCMC results without checking convergence.
InsteadRun several chains, inspect traces, and check R-hat and effective sample size for every quantity of interest.
MistakeTreating MCMC samples as independent when computing standard errors.
InsteadUse the effective sample size; correlated samples carry less information.
MistakeTuning random-walk proposals for a very high acceptance rate.
InsteadHigh acceptance usually means tiny steps and slow mixing; aim for roughly 25 to 45%, or use HMC/NUTS.
MistakeUsing importance sampling with a light-tailed proposal.
InsteadThe proposal must cover the target's tails; monitor the weight ESS.
MistakeIgnoring divergent transitions reported by HMC.
InsteadDivergences indicate regions the sampler cannot explore; reparameterize the model.
Summary and key terms
- Monte Carlo estimates expectations by sample averages with standard error \(\sigma_f/\sqrt S\), independent of dimension but slow.
- Inverse transform and rejection sampling draw exact samples but fail in high dimensions.
- Importance sampling reweights samples from a proposal; weight degeneracy is measured by the ESS.
- MCMC builds a Markov chain whose stationary distribution is the target; detailed balance ensures invariance.
- Metropolis-Hastings needs only density ratios, so the normalizing constant cancels; the step size controls mixing.
- Gibbs sampling updates each variable from its full conditional; it mixes slowly when variables are strongly correlated.
- Diagnose with burn-in, trace plots, multiple chains, R-hat and effective sample size.
- HMC uses gradients for long, directed proposals; NUTS automates tuning in Stan, PyMC and NumPyro.
- Particle filters apply importance sampling and resampling sequentially to streaming data.
- Monte Carlo estimate
- An average of a function over random samples approximating an expectation.
- Inverse transform sampling
- Sampling by applying the inverse CDF to uniform random numbers.
- Rejection sampling
- Exact sampling by accepting proposals under a scaled envelope.
- Importance sampling
- Estimating expectations with weighted samples from a proposal distribution.
- Effective sample size
- The number of independent samples equivalent to a weighted or correlated set.
- Markov chain Monte Carlo
- Sampling by simulating a Markov chain with the target as its stationary distribution.
- Detailed balance
- A condition under which a Markov chain leaves the target distribution invariant.
- Metropolis-Hastings
- An MCMC algorithm that accepts proposals with a probability based on density ratios.
- Gibbs sampling
- MCMC that samples each variable from its full conditional distribution.
- Burn-in
- Initial samples discarded before the chain reaches equilibrium.
- R-hat
- A diagnostic comparing between-chain and within-chain variance.
- Hamiltonian Monte Carlo
- MCMC that uses simulated Hamiltonian dynamics driven by the gradient of the log density.
- NUTS
- The No-U-Turn Sampler, an adaptive form of HMC.
- Particle filter
- Sequential importance sampling with resampling for state-space models.
Practice problems
Work each problem on paper first, then reveal the answer to check.
A Monte Carlo estimate with 10,000 samples has standard error 0.02. How many samples give 0.002?
Show answer
100 times as many: 1,000,000.
Give the inverse-transform formula for sampling an exponential distribution with rate 3.
Show answer
x = −ln(1 − u)/3, with u uniform on (0, 1).
A rejection sampler uses M = 50 with a normalized target. What is the acceptance rate?
Show answer
1/50 = 2%.
Five importance weights are 1, 1, 1, 1 and 20. What is the ESS?
Show answer
(24)²/(4 + 400) = 576/404 = 1.43.
Why does the normalizing constant not matter in Metropolis-Hastings?
Show answer
The acceptance probability uses the ratio p̃(x′)/p̃(x), in which Z cancels.
A random-walk Metropolis chain accepts 98% of proposals. What does this suggest?
Show answer
The step size is too small; the chain moves slowly and has a low ESS. Increase the step.
For a Gibbs sampler on a bivariate normal with ρ = 0.95, what is the lag-1 autocorrelation and the approximate ESS of 10,000 samples (assume ρ_k = ρ^{2k})?
Show answer
Lag-1 = 0.9025; Σρ_k = 0.9025/0.0975 = 9.26; ESS = 10,000/19.5 ≈ 510.
Four chains give R-hat = 1.15 for a parameter. What should you do?
Show answer
The chains disagree; run longer, check traces for multimodality or poor mixing, and consider reparameterizing.
What does HMC need that random-walk Metropolis does not?
Show answer
Gradients of the log density (continuous, differentiable parameters).
What problem does resampling solve in a particle filter?
Show answer
Weight degeneracy: after several updates a few particles carry all the weight; resampling concentrates particles where the posterior mass is.
Lesson quiz · 5 questions
Score 60% or more to complete this lesson.
Create a free account to save your progress, take quizzes and earn a certificate.