
AI-320 · Lesson 5 of 12 · 28 min
Latent variables and EM
Many patterns in data are best explained by quantities we never observe. Customers belong to segments that no database records; a document is about topics that are not labelled; an image of a digit was written in one of several styles; a machine is in a health state that can only be inferred from its vibration. Latent variable models make these hidden quantities explicit as random variables, which turns vague notions such as "clusters" or "topics" into precise probabilistic models that can be fitted, compared and used for prediction. The difficulty is that the likelihood of the observed data involves a sum or integral over the latent variables, which is awkward to maximize directly. The expectation-maximization (EM) algorithm solves this elegantly. This lesson develops mixture models, the EM algorithm and why it works, practical issues such as initialization and choosing the number of components, and extensions to missing data and other latent variable models.
Mixture models
A mixture model assumes that each data point was generated by first choosing one of \(K\) components at random, then drawing from that component's distribution. Introducing a latent variable \(z_n \in \{1, \ldots, K\}\) for each point \(x_n\):
This is a Gaussian mixture model (GMM). Summing out the latent variable gives the marginal density of an observation, a weighted sum of Gaussians:
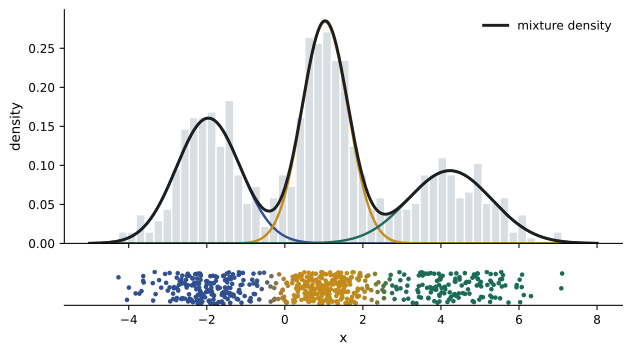
Mixtures are flexible density estimators: with enough components a GMM can approximate any smooth density. They also provide soft clustering, because Bayes' theorem gives the posterior probability that point \(n\) came from component \(k\), called its responsibility:
Unlike k-means, which assigns each point wholly to one cluster, a GMM expresses uncertainty about points between clusters, allows clusters of different sizes and shapes through the covariances, and gives a likelihood that can be used to compare models.
Why direct maximization is hard
The log-likelihood of the data is
The logarithm of a sum does not simplify, so setting derivatives to zero gives coupled equations without a closed-form solution. If the latent assignments \(z_n\) were known, the problem would be easy: the log-likelihood would split into separate terms for each component, and each \(\mu_k\) would be the mean of its points, each \(\Sigma_k\) their covariance and each \(\pi_k\) the fraction of points assigned. EM exploits this by alternating between guessing the assignments (softly) and solving the easy problem.
Maximum likelihood for GMMs also has a pathology: if one component's mean sits exactly on a data point and its variance shrinks toward zero, the likelihood goes to infinity. Practical implementations add a small value to the diagonal of each covariance (a regularizer that can be seen as a weak prior), or use a Bayesian treatment.
The EM algorithm
EM alternates two steps until the log-likelihood stops improving:
- E-step: with the current parameters, compute the responsibilities \(r_{nk}\) for every point and component.
- M-step: re-estimate the parameters as if the responsibilities were fractional counts of assignments.
For a GMM, with \(N_k = \sum_n r_{nk}\) the effective number of points in component \(k\), the M-step is
These are exactly the weighted versions of the formulas for known assignments.
import numpy as np
from scipy.stats import norm

rng = np.random.default_rng(3)
x = np.concatenate([rng.normal(-2, 0.8, 200), rng.normal(1, 0.6, 250), rng.normal(4, 1.2, 150)])

K = 3
pi = np.full(K, 1 / K); mu = np.array([-1.0, 0.0, 1.0]); sd = np.ones(K)
for it in range(1, 61):
    dens = pi * norm.pdf(x[:, None], mu, sd)          # N x K
    ll = np.log(dens.sum(axis=1)).sum()
    r = dens / dens.sum(axis=1, keepdims=True)         # E-step: responsibilities
    Nk = r.sum(axis=0)                                 # M-step
    pi = Nk / len(x)
    mu = (r * x[:, None]).sum(axis=0) / Nk
    sd = np.sqrt((r * (x[:, None] - mu) ** 2).sum(axis=0) / Nk + 1e-6)
    if it in (1, 2, 5, 10, 20, 40, 60):
print(f"iter {it:2d} loglik {ll:9.3f} mu {np.round(mu, 2)} sd {np.round(sd, 2)} pi {np.round(pi, 2)}")iter 1 loglik -2043.914 mu [-1.74 0.23 2.63] sd [1.2 1.43 1.83] pi [0.3 0.22 0.49] iter 2 loglik -1375.300 mu [-1.8 0.35 2.59] sd [1.12 1.36 1.9 ] pi [0.29 0.23 0.48] iter 5 loglik -1350.276 mu [-2.08 0.71 2.6 ] sd [0.79 0.98 1.98] pi [0.28 0.25 0.47] iter 10 loglik -1303.856 mu [-2.04 0.95 2.99] sd [0.76 0.52 1.95] pi [0.31 0.31 0.39] iter 20 loglik -1293.553 mu [-1.95 0.97 3.71] sd [0.83 0.52 1.49] pi [0.34 0.36 0.3 ] iter 40 loglik -1285.837 mu [-1.96 1.03 4.23] sd [0.82 0.59 1.07] pi [0.33 0.42 0.24] iter 60 loglik -1285.835 mu [-1.96 1.03 4.23] sd [0.82 0.59 1.07] pi [0.33 0.42 0.24]
The log-likelihood rises at every iteration, quickly at first and then slowly, and the parameters converge close to those used to generate the data (means −2, 1 and 4; standard deviations 0.8, 0.6 and 1.2; weights 0.33, 0.42 and 0.25). The monotone increase is not a coincidence, and it is the best test of an EM implementation: if the log-likelihood ever decreases, there is a bug.
Why EM works
For any distribution \(q(z)\) over the latent variables, Jensen's inequality gives a lower bound on the log-likelihood of one data point:
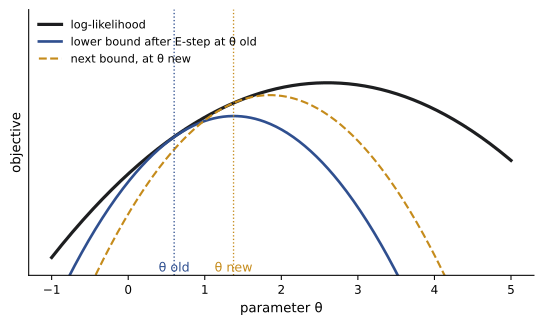
The gap between the two sides is exactly the Kullback-Leibler divergence \(\mathrm{KL}(q(z)\,\|\,p(z \mid x, \theta))\), which is non-negative and zero only when \(q\) equals the posterior. So \(\log p(x \mid \theta) = \mathcal L(q, \theta) + \mathrm{KL}(q \,\|\, p(z \mid x, \theta))\). EM is coordinate ascent on the lower bound \(\mathcal L\):
- The E-step sets \(q(z) = p(z \mid x, \theta^{\mathrm{old}})\), which makes the KL term zero, so the bound touches the log-likelihood at the current parameters.
- The M-step maximizes \(\mathcal L(q, \theta)\) over \(\theta\) with \(q\) fixed, which amounts to maximizing the expected complete-data log-likelihood \(\mathbb{E}_q[\log p(x, z \mid \theta)]\), usually easy because it has the same form as the known-assignment problem.
Since the bound equals the log-likelihood after the E-step and the M-step can only raise the bound, the log-likelihood cannot decrease. This lower bound, the evidence lower bound or ELBO, is also the starting point of variational inference in Lesson 9, where \(q\) is restricted to a tractable family because the exact posterior is unavailable.
Practical issues
Local optima and initialization
EM converges to a local maximum (or saddle point) of the likelihood, and mixture likelihoods have many: components can split a true cluster in two while another component covers two true clusters. Results depend on initialization. Standard practice is to initialize from k-means (itself initialized with k-means++), to run EM from several starting points and keep the solution with the highest log-likelihood, and to check that solutions make sense.
import numpy as np
from sklearn.mixture import GaussianMixture

rng = np.random.default_rng(7)
centres = np.array([[0, 0], [5, 0], [0, 5], [5, 5], [2.5, 9]])
X = np.vstack([c + rng.normal(scale=0.9, size=(120, 2)) for c in centres])

print("single initializations from random data points (K=5):")
for seed in range(8):
    g = GaussianMixture(5, init_params="random_from_data", n_init=1, random_state=seed, max_iter=500).fit(X)
    print(f"  seed {seed}: average loglik per point {g.score(X):.4f}, converged in {g.n_iter_} iterations")
g = GaussianMixture(5, init_params="kmeans", n_init=10, random_state=0).fit(X)
print(f"k-means init, best of 10: {g.score(X):.4f}")single initializations from random data points (K=5): seed 0: average loglik per point -4.2367, converged in 12 iterations seed 1: average loglik per point -4.2930, converged in 25 iterations seed 2: average loglik per point -4.2384, converged in 11 iterations seed 3: average loglik per point -4.2336, converged in 11 iterations seed 4: average loglik per point -4.2797, converged in 7 iterations seed 5: average loglik per point -4.1010, converged in 16 iterations seed 6: average loglik per point -4.3308, converged in 16 iterations seed 7: average loglik per point -4.1010, converged in 12 iterations k-means init, best of 10: -4.1010
Only two of the eight random starts reach the best solution, with an average log-likelihood of about −4.10 per point; the others stop at clearly worse local optima, in which two true clusters share one component while another true cluster is split between two. Initializing from k-means and keeping the best of several runs finds the good solution reliably.
Choosing the number of components
The likelihood always increases with more components, so it cannot choose \(K\) by itself. Common approaches are held-out likelihood (fit on training data, evaluate on validation data) and information criteria that penalize parameters. The Bayesian information criterion is
where \(p\) is the number of free parameters; lower is better. BIC approximates \(-2\) times the log marginal likelihood of Lesson 1 for large \(N\), so it inherits the Bayesian Occam penalty. For a GMM in \(d\) dimensions with full covariances, \(p = K(d + d(d+1)/2) + K - 1\).
import numpy as np
from sklearn.mixture import GaussianMixture

rng = np.random.default_rng(7)
centres = np.array([[0, 0], [5, 0], [0, 5], [5, 5], [2.5, 9]])
X = np.vstack([c + rng.normal(scale=0.9, size=(120, 2)) for c in centres])
rng.shuffle(X)
train, valid = X[:450], X[450:]

for K in range(1, 9):
    g = GaussianMixture(K, n_init=5, random_state=0).fit(train)
    p = K * (2 + 3) + K - 1
    print(f"K={K}: params {p:2d}  BIC {g.bic(train):8.1f}  train loglik/pt {g.score(train):7.3f}  "
f"valid loglik/pt {g.score(valid):7.3f}")K=1: params 5 BIC 4509.2 train loglik/pt -4.976 valid loglik/pt -4.997 K=2: params 11 BIC 4304.2 train loglik/pt -4.708 valid loglik/pt -4.772 K=3: params 17 BIC 4033.2 train loglik/pt -4.366 valid loglik/pt -4.521 K=4: params 23 BIC 3928.2 train loglik/pt -4.208 valid loglik/pt -4.337 K=5: params 29 BIC 3850.5 train loglik/pt -4.082 valid loglik/pt -4.184 K=6: params 35 BIC 3877.4 train loglik/pt -4.071 valid loglik/pt -4.206 K=7: params 41 BIC 3911.3 train loglik/pt -4.068 valid loglik/pt -4.211 K=8: params 47 BIC 3944.5 train loglik/pt -4.064 valid loglik/pt -4.210
Training likelihood keeps rising with \(K\), but BIC reaches its minimum at the true value of five, and validation likelihood stops improving there. In real data there is rarely a single true \(K\); different criteria may disagree, and the choice should also reflect the purpose, such as the number of customer segments a marketing team can act on.
Relationship to k-means
If all components share a covariance \(\sigma^2 I\) and \(\sigma \to 0\), the responsibilities become hard 0-or-1 assignments to the nearest mean, the E-step becomes the k-means assignment step and the M-step becomes the k-means update. K-means is thus the zero-variance limit of EM for a GMM. This explains its implicit assumptions: spherical clusters of similar size and spread.
Worked problem
One EM step by hand
A two-component 1D mixture has \(\pi = (0.5, 0.5)\), \(\mu = (0, 4)\) and \(\sigma = (1, 1)\). Compute the responsibilities of the points \(x = 1\) and \(x = 2\), and the updated mean of component 1 if these are the only points along with \(x = -1\) (responsibility essentially 1 for component 1).
Show solution
- For \(x = 1\): the density ratio is \(\exp(-1/2)/\exp(-9/2) = e^{4} = 54.6\), so \(r_1 = 54.6/55.6 = 0.982\).
- For \(x = 2\): both distances are 2, so \(r_1 = 0.5\).
- For \(x = -1\): \(r_1 \approx 1\).
- New \(\mu_1 = (1 \times (-1) + 0.982 \times 1 + 0.5 \times 2)/(1 + 0.982 + 0.5) = 0.982/2.482 = 0.40\).
Answer: Responsibilities 0.982 and 0.5; the mean of component 1 moves from 0 to 0.40, pulled by the fractional membership of the point at 2.
EM beyond mixtures
EM applies whenever the complete-data likelihood is easy and the latent variables can be inferred:
- Missing data: treat missing entries as latent. For multivariate Gaussian data, the E-step fills in the conditional expectations of the missing values (and their covariance), and the M-step recomputes the mean and covariance, giving maximum likelihood estimates without discarding incomplete rows. This is far better than mean imputation, which shrinks variances and distorts correlations.
- Hidden Markov models: the Baum-Welch algorithm uses the forward-backward algorithm of Lesson 3 for the E-step, giving expected state occupancies and transition counts, and re-estimates the transition and emission probabilities in the M-step.
- Factor analysis and probabilistic PCA: continuous latent variables \(\mathbf z \sim \mathcal N(0, I)\) generate observations \(\mathbf x = W\mathbf z + \boldsymbol\mu + \boldsymbol\epsilon\). EM fits \(W\) without computing a full covariance eigendecomposition and handles missing values naturally; probabilistic PCA recovers ordinary PCA as the noise goes to zero.
- Topic models: latent Dirichlet allocation represents each document as a mixture of topics and each topic as a distribution over words; its posterior is intractable, so it is fitted with variational EM (Lesson 9) or Gibbs sampling (Lesson 7).
Variants extend EM when the steps are hard: generalized EM only improves (rather than maximizes) the bound in the M-step; stochastic and online EM update with mini-batches; and Monte Carlo EM approximates the E-step by sampling. When the E-step posterior itself is intractable, variational EM replaces it with the best approximation from a tractable family, which is the subject of Lesson 9.
The ELBO introduced here returns in Lesson 9 as the objective of variational inference, and Lesson 11 uses EM to learn the noise parameters of state-space models.
Common mistakes
MistakeTrusting a single EM run.
InsteadEM finds local optima; use k-means initialization and several restarts, keeping the best log-likelihood.
MistakeChoosing the number of components by training likelihood.
InsteadLikelihood always increases with K; use BIC, held-out likelihood or the application's needs.
MistakeLetting component variances collapse.
InsteadAdd a small regularizer to covariances or use a prior; a variance near zero makes the likelihood unbounded.
MistakeIgnoring a decrease in log-likelihood during EM.
InsteadEM guarantees monotone improvement; a decrease indicates a bug.
MistakeReplacing missing values with means before fitting.
InsteadTreat missing values as latent and use EM, which preserves variances and correlations.
Summary and key terms
- Latent variable models explain observations through unobserved variables such as cluster memberships.
- A GMM is \(p(x) = \sum_k \pi_k \mathcal N(x \mid \mu_k, \Sigma_k)\); responsibilities give soft cluster memberships.
- The log of a sum prevents closed-form maximum likelihood; known assignments would make it easy.
- EM alternates computing responsibilities (E-step) and weighted parameter estimates (M-step).
- EM maximizes a lower bound (the ELBO) that touches the log-likelihood after each E-step, so the log-likelihood never decreases.
- EM converges to local optima: initialize with k-means and use multiple restarts.
- Choose K with BIC or held-out likelihood; training likelihood always rises.
- K-means is the zero-variance limit of EM for a GMM.
- EM extends to missing data, HMMs (Baum-Welch), factor analysis and probabilistic PCA, and topic models.
- Latent variable
- A random variable in a model that is never observed.
- Mixture model
- A model in which each observation comes from one of several component distributions.
- Gaussian mixture model
- A mixture of Gaussian components.
- Responsibility
- The posterior probability that a point was generated by a given component.
- Complete-data likelihood
- The likelihood of both observed and latent variables.
- EM algorithm
- Iterative maximum likelihood with latent variables, alternating E and M steps.
- Jensen's inequality
- For a concave function such as log, the function of an average is at least the average of the function.
- Evidence lower bound (ELBO)
- A lower bound on the log-likelihood that EM and variational inference maximize.
- BIC
- Bayesian information criterion: −2 log-likelihood plus p log N.
- k-means++
- An initialization that spreads initial centres apart probabilistically.
- Baum-Welch algorithm
- EM for hidden Markov models.
- Probabilistic PCA
- A latent Gaussian model whose maximum likelihood solution spans the principal subspace.
- Latent Dirichlet allocation
- A topic model representing documents as mixtures of topics.
Practice problems
Work each problem on paper first, then reveal the answer to check.
How many free parameters does a GMM with K = 4 full-covariance components in d = 3 dimensions have?
Show answer
Means 4 × 3 = 12; covariances 4 × 6 = 24; weights 3; total 39.
With π = (0.3, 0.7), μ = (0, 3), σ = (1, 1), compute the responsibility of component 1 for x = 1.5.
Show answer
Equal distances, so densities are equal; r₁ = 0.3/(0.3 + 0.7) = 0.3.
Why can the GMM likelihood be unbounded, and how is this prevented?
Show answer
A component centred on one point with variance → 0 has infinite density there; add a small diagonal regularizer or a prior on covariances.
State the two steps of EM in terms of the lower bound.
Show answer
E-step: set q to the posterior over latents, making the bound tight. M-step: maximize the bound (expected complete-data log-likelihood) over parameters.
Why must the log-likelihood never decrease in EM?
Show answer
After the E-step the bound equals the log-likelihood; the M-step raises the bound, and the log-likelihood is always at least the bound.
A model with log-likelihood −1200 and 20 parameters, and another with −1180 and 35 parameters, are fitted to N = 1000 points. Which has lower BIC?
Show answer
BIC₁ = 2400 + 20 × 6.91 = 2538; BIC₂ = 2360 + 35 × 6.91 = 2602; the first.
How does k-means arise from EM for a GMM?
Show answer
With shared spherical covariance σ²I and σ → 0, responsibilities become hard nearest-mean assignments.
Why is mean imputation of missing values harmful, and what does EM do instead?
Show answer
It shrinks variances and weakens correlations; EM uses conditional expectations given observed values and accounts for their uncertainty in the covariance.
What does the E-step compute in Baum-Welch?
Show answer
Expected state occupancies and expected transition counts, using the forward-backward algorithm.
Give one reason to prefer a GMM over k-means for clustering.
Show answer
Soft memberships, clusters of different shapes and sizes, a likelihood for model comparison, density estimation.
Lesson quiz · 5 questions
Score 60% or more to complete this lesson.
Create a free account to save your progress, take quizzes and earn a certificate.