
AI-220 · Lesson 10 of 12 · 30 min
Visualization and communication
Visualization serves two different purposes in a data project. Exploratory visualization is for the analyst: dozens of quick, rough plots made to understand the data, find errors and form hypotheses before any model is built. Explanatory visualization is for an audience: a few carefully designed charts that communicate a finding or a decision clearly and honestly. The first is about speed and breadth; the second about clarity, accuracy and the reader.
This lesson starts with why summary statistics are not enough, then covers how people read charts, choosing the right chart, exploratory analysis in practice, honest presentation and uncertainty, colour and accessibility, and communicating model results to people who will act on them.
Why look at the data
In 1973 the statistician Francis Anscombe published four small data sets with nearly identical summary statistics: the same means and variances of x and y, the same correlation and the same fitted regression line. Plotted, they look completely different: one is a noisy linear relationship, one a smooth curve, one a perfect line with a single outlier, and one a vertical stack of points with a single extreme point that creates the whole correlation.
import numpy as np

x123 = [10, 8, 13, 9, 11, 14, 6, 4, 12, 7, 5]
data = {
    "I":   (x123, [8.04, 6.95, 7.58, 8.81, 8.33, 9.96, 7.24, 4.26, 10.84, 4.82, 5.68]),
    "II":  (x123, [9.14, 8.14, 8.74, 8.77, 9.26, 8.10, 6.13, 3.10, 9.13, 7.26, 4.74]),
    "III": (x123, [7.46, 6.77, 12.74, 7.11, 7.81, 8.84, 6.08, 5.39, 8.15, 6.42, 5.73]),
    "IV":  ([8, 8, 8, 8, 8, 8, 8, 19, 8, 8, 8],
            [6.58, 5.76, 7.71, 8.84, 8.47, 7.04, 5.25, 12.50, 5.56, 7.91, 6.89]),
}
print("set  mean_x  var_x  mean_y  var_y   corr   fitted line")
for name, (x, y) in data.items():
    x, y = np.array(x, float), np.array(y)
    slope, intercept = np.polyfit(x, y, 1)
    print(f"{name:>3}  {x.mean():6.2f} {x.var(ddof=1):6.2f} {y.mean():7.2f} {y.var(ddof=1):6.2f}"
f" {np.corrcoef(x, y)[0, 1]:6.3f} y = {intercept:.2f} + {slope:.3f}x")set mean_x var_x mean_y var_y corr fitted line I 9.00 11.00 7.50 4.13 0.816 y = 3.00 + 0.500x II 9.00 11.00 7.50 4.13 0.816 y = 3.00 + 0.500x III 9.00 11.00 7.50 4.12 0.816 y = 3.00 + 0.500x IV 9.00 11.00 7.50 4.12 0.817 y = 3.00 + 0.500x
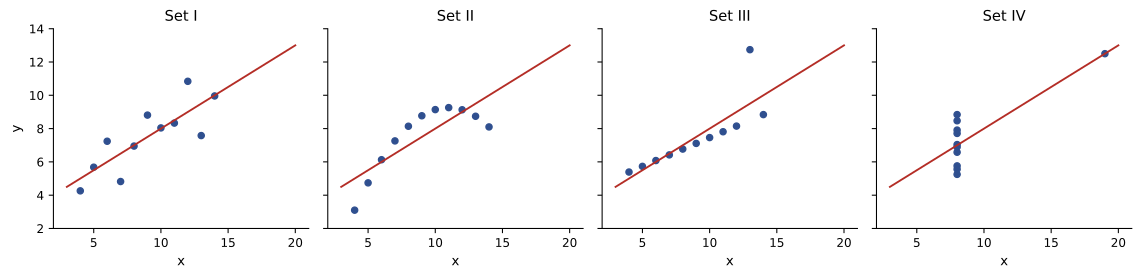
A model fit to any of these sets would produce the same line, and only set I would justify it. The lesson generalizes: summary statistics, and model metrics, compress data and can hide exactly the structure that matters. Plot distributions, relationships and errors before trusting a number.
How people read charts
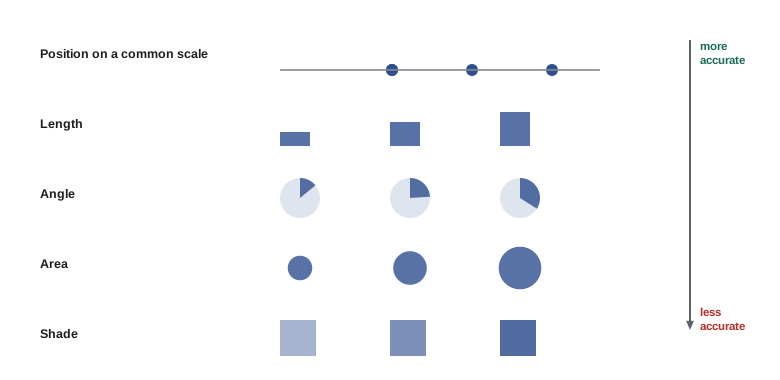
A chart encodes numbers as visual properties, and people decode some properties far more accurately than others. Experiments by William Cleveland and Robert McGill in the 1980s, since repeated many times, rank the common encodings from most to least accurate roughly as follows:
- Position along a common scale (dots or bar ends against a shared axis).
- Position along identical but unaligned scales (small multiples).
- Length, then direction and angle (pie slices).
- Area, then volume, curvature and colour saturation or hue.
The practical rule is to encode the most important comparison with position on a common axis. A bar chart beats a pie chart for comparing parts, because lengths along a shared baseline are judged more accurately than angles; a dot plot or line chart beats a bubble chart for comparing values, because areas are systematically misjudged. Colour hue is excellent for distinguishing categories but poor for showing quantities.
Choosing a chart
The question the chart must answer decides its type:
- Comparing categories: a bar chart (horizontal if labels are long), sorted by value unless the categories have a natural order. A dot plot works well for many categories or when the baseline is not zero.
- Change over time: a line chart, with time on the horizontal axis. Bars suit a few discrete periods.
- Distribution of one variable: a histogram or density plot; box plots or violin plots to compare distributions across groups.
- Relationship between two variables: a scatter plot, with transparency or hexagonal binning when there are thousands of points.
- Parts of a whole: a stacked bar, or a pie chart with no more than about three slices whose exact values do not matter.
- Many variables: a correlation heatmap, a scatter-plot matrix, or small multiples (a grid of identical small charts, one per group).
- Geography: a choropleth map for rates by region (never raw counts, which mostly show where people live), or points on a map.
Small multiples deserve special mention. Instead of overlaying ten lines in ten colours, draw ten small charts with the same axes; the eye compares shapes across panels easily, and no legend is needed.
Exploratory analysis
Exploratory data analysis (EDA) follows a rough sequence: look at each variable alone (distributions, missing values, outliers), then at pairs (relationships with the target, correlations between features), then at groups and time (does the relationship differ by segment or change over time?). The code below produces a typical first set of plots for a numeric target.
import numpy as np
import pandas as pd
import matplotlib.pyplot as plt

rng = np.random.default_rng(4)
n = 800
df = pd.DataFrame({"size_m2": rng.gamma(6, 18, n), "age": rng.integers(0, 70, n),
                   "type": rng.choice(["condo", "house", "townhouse"], n, p=[0.4, 0.4, 0.2])})
base = {"condo": 3200, "house": 2600, "townhouse": 2900}
df["price"] = (df["type"].map(base) * df["size_m2"] * (1 - 0.004 * df["age"])
               * rng.lognormal(0, 0.15, n)).round(-3)

fig, ax = plt.subplots(1, 3, figsize=(12, 3.6))
ax[0].hist(df["price"] / 1000, bins=40, color="#2f4f8f")
ax[0].set(title="Price distribution", xlabel="price ($ thousands)", ylabel="homes")
groups = ["condo", "townhouse", "house"]
ax[1].boxplot([df.loc[df.type == g, "price"] / 1000 for g in groups], tick_labels=groups)
ax[1].set(title="Price by type", ylabel="price ($ thousands)")
ax[2].scatter(df["size_m2"], df["price"] / 1000, s=8, alpha=0.35, color="#1c6b58")
ax[2].set(title="Price vs size", xlabel="size (m²)", ylabel="price ($ thousands)")
fig.tight_layout()
fig.savefig("eda.svg")

print(df[["size_m2", "age", "price"]].describe().round(0).loc[["mean", "50%", "max"]])
print(f"skew of price: {df.price.skew():.2f}; of log price: {np.log(df.price).skew():.2f}")size_m2 age price mean 108.0 35.0 272751.0 50% 100.0 34.0 249500.0 max 322.0 69.0 936000.0 skew of price: 1.07; of log price: -0.34
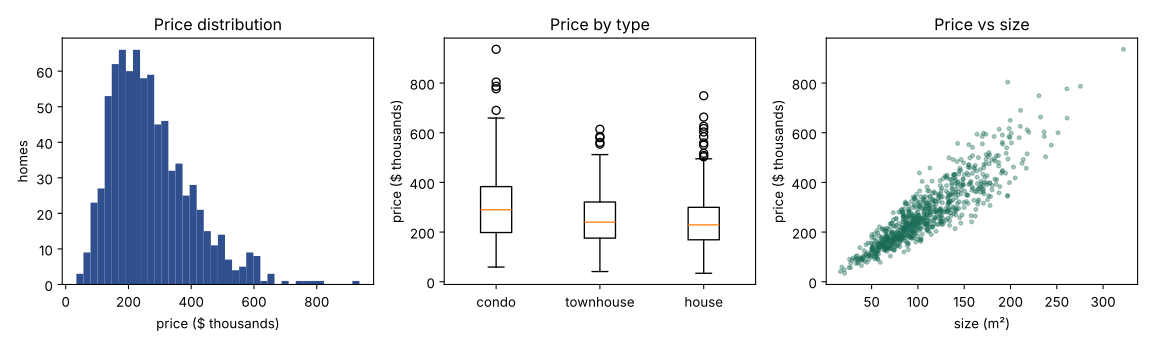
The plots suggest modelling decisions: the long right tail and the fanning scatter both suggest predicting log price, and the overlapping box plots show that type alone explains little until size is accounted for.
Honest charts
Charts can mislead even when every number is correct. The most common distortions are:
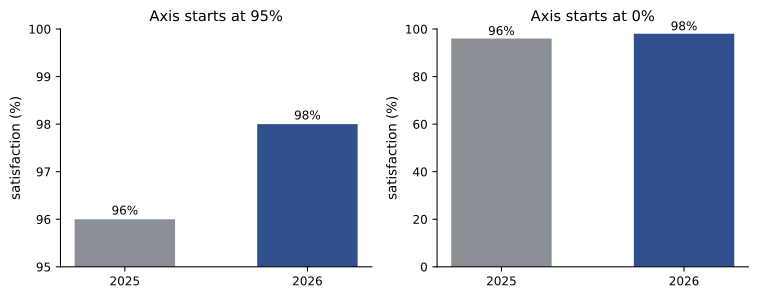
- Truncated axes on bar charts: a bar's length encodes its value, so the axis must start at zero. Line charts and dot plots, which encode position, may use a non-zero baseline if it is clearly labelled.
- Inconsistent or dual axes: two series with independently scaled vertical axes can be made to appear correlated, or to cross, at will.
- Cherry-picked ranges: starting a time series at a convenient low or high point.
- Area and 3-D effects: doubling a pictogram's height also doubles its width, so the area quadruples; 3-D perspective distorts the values of nearer and farther bars.
- Raw counts where rates are needed: more cases in larger regions or larger groups say nothing about risk.
Edward Tufte's lie factor quantifies distortion: the size of the effect shown in the graphic divided by the size of the effect in the data. An honest chart has a lie factor close to 1.
Worked problem
Lie factor of a truncated bar chart
A slide shows customer satisfaction rising from 96% to 98%, drawn as bars on an axis starting at 95%. What is the lie factor?
Show solution
- Change in the data: \((98 - 96)/96 = 2.1\%\).
- Bar heights above the 95% baseline: 1 and 3 units, so the second bar is 200% taller.
- Lie factor: \(200/2.1 = 96\).
Answer: The chart exaggerates the change about 96 times. Either start the bars at zero (and accept that the change looks small, because it is), or show the values as points on a line chart with a clearly labelled axis and state the change in the title.
Showing uncertainty
Every estimate from data has uncertainty, and a chart that shows a point estimate alone invites over-confident readings. Ways to show it include error bars or shaded bands for confidence intervals, showing the individual data points behind a summary, and showing distributions rather than averages. The bootstrap is a general way to compute intervals without formulas: resample the data with replacement many times, recompute the statistic each time, and take the middle 95% of the results.
import numpy as np

rng = np.random.default_rng(21)
a = rng.exponential(30, 60)       # session minutes, variant A (60 users)
b = rng.exponential(36, 60)       # variant B

def boot_ci(x, n=5000):
    means = rng.choice(x, size=(n, len(x)), replace=True).mean(axis=1)
    return np.percentile(means, [2.5, 97.5])

diffs = (rng.choice(b, (5000, 60)).mean(axis=1) - rng.choice(a, (5000, 60)).mean(axis=1))
for name, x in [("A", a), ("B", b)]:
    lo, hi = boot_ci(x)
    print(f"{name}: mean {x.mean():5.1f} min, 95% CI {lo:5.1f} to {hi:5.1f}")
lo, hi = np.percentile(diffs, [2.5, 97.5])
print(f"B - A: {b.mean() - a.mean():5.1f} min, 95% CI {lo:5.1f} to {hi:5.1f}")A: mean 29.1 min, 95% CI 22.2 to 36.9 B: mean 38.1 min, 95% CI 29.6 to 47.6 B - A: 8.9 min, 95% CI -2.9 to 20.8
Variant B's average looks higher, but the interval for the difference includes zero, so 60 users per variant cannot establish that B is better. A bar chart of the two means without intervals would have suggested a clear winner.
Colour and accessibility
Colour should have a job. Use a qualitative palette (distinct hues) for categories, a sequential palette (light to dark in one hue) for ordered quantities, and a diverging palette (two hues meeting at a neutral midpoint) for values above and below a meaningful centre, such as change from last year. Rainbow palettes, which run through many hues, create false boundaries where hues change and are not ordered perceptually.
About 8% of men and 0.5% of women have some form of colour vision deficiency, most often difficulty distinguishing red from green. Palettes designed for colour-blind readers (such as Okabe-Ito, or the viridis family for sequential data) avoid relying on red-green contrast. Better still, do not rely on colour alone: label lines directly at their ends instead of using a legend, use different marker shapes or line styles, and make sure the chart still works in greyscale.
Charts published on the web should also be accessible to readers who use screen readers: provide a text alternative that states what the chart shows and its key finding, and make the underlying data available as a table. In Canada, the Accessible Canada Act applies to the federal government and federally regulated organizations, and provincial laws such as Ontario's Accessibility for Ontarians with Disabilities Act (AODA) require many organizations to make web content meet the Web Content Accessibility Guidelines (WCAG) 2.0 level AA, which includes text alternatives and sufficient contrast.
Communicating results
A chart for an audience should answer one question, and its title should state the answer: "Churn fell after the price change" rather than "Monthly churn rate". Remove everything that does not help the reader decode the data (heavy gridlines, borders, shading, 3-D effects, redundant legends), label directly, and highlight the one series or bar that matters with colour while greying out the rest.
When presenting a model, translate metrics into the audience's terms. "AUC 0.87" means little to an operations manager; "if we review the 500 highest-risk claims each week, we expect to catch about 70% of fraudulent claims, and about one in four reviewed claims will be fraudulent" supports a decision. Show performance for the groups the audience cares about, and state the limitations: what data the model has not seen, how it might fail, and how it will be monitored.
Worked problem
Translating a classifier into counts
A model flags patients at risk of readmission. In a test set of 10,000 patients, 1200 were readmitted. At the chosen threshold the model has a recall (sensitivity) of 0.60 and a precision of 0.30. Describe its performance per 1000 patients for a hospital audience.
Show solution
- Per 1000 patients, 120 are readmitted.
- The model catches \(0.60 \times 120 = 72\) of them and misses 48.
- Flags in total: true positives / precision = \(72 / 0.30 = 240\) patients, of whom \(240 - 72 = 168\) would not have been readmitted.
Answer: Out of every 1000 patients, the model flags 240 for follow-up; 72 of them would have been readmitted, and it misses 48 who will be. In counts, the hospital can judge whether 240 follow-up calls to prevent some of 72 readmissions is worth it, which is a question about resources and outcomes that a single metric cannot answer.
Dashboards bring many charts together for ongoing monitoring. A good dashboard is built for specific decisions and users, puts the most important figures at the top left, shows comparisons (to targets, to last period) rather than isolated numbers, keeps the same scales across related panels, and shows when the data was last updated. A dashboard nobody acts on should be retired.
Lesson 11 applies these principles to recurring metrics and dashboards, and to the design and analysis of experiments.
Common mistakes
MistakeTrusting summary statistics or a single metric without plotting.
InsteadPlot distributions, relationships and errors; Anscombe's quartet shows how much statistics hide.
MistakeStarting a bar chart's axis above zero.
InsteadBars encode length and must start at zero; use points or lines for small differences.
MistakeUsing pie charts or bubble areas to compare values.
InsteadUse position on a common scale (bars, dots, lines) for the key comparison.
MistakeMapping raw counts by region.
InsteadMap rates per population or per unit, or the map just shows where people live.
MistakeRelying on red versus green to carry meaning.
InsteadUse colour-blind-safe palettes, direct labels and redundant shapes or styles.
MistakeShowing point estimates as if they were certain.
InsteadShow confidence intervals or the underlying data, and say when a difference is not established.
Summary and key terms
- Exploratory plots help the analyst understand data; explanatory charts communicate one finding to an audience.
- Anscombe's quartet: identical statistics, different data. Always plot.
- Position on a common scale is read most accurately; length, angle, area and colour follow.
- Choose chart type by question: bars for categories, lines for time, histograms and box plots for distributions, scatter for relationships, small multiples for groups.
- EDA proceeds from single variables to pairs to groups and time, and informs modelling choices such as log transforms.
- Avoid truncated bar axes, dual axes, cherry-picked ranges, area and 3-D distortion and raw counts; the lie factor should be near 1.
- Show uncertainty with intervals (the bootstrap computes them generally) or the underlying data.
- Use qualitative, sequential or diverging palettes as appropriate; design for colour-blind readers and screen readers.
- Title charts with the finding, remove clutter, and translate model metrics into counts and decisions.
- Exploratory data analysis (EDA)
- Visual and statistical investigation of data before modelling.
- Anscombe's quartet
- Four data sets with identical summary statistics but very different shapes.
- Visual encoding
- The mapping of a data value to a visual property such as position, length or colour.
- Small multiples
- A grid of small charts with the same axes, one per group.
- Box plot
- A chart showing the median, quartiles and outliers of a distribution.
- Choropleth map
- A map with regions shaded by a value, usually a rate.
- Lie factor
- The size of an effect shown in a graphic divided by its size in the data.
- Bootstrap
- Estimating uncertainty by recomputing a statistic on many resamples of the data.
- Confidence interval
- A range of values that, by a stated procedure, covers the true value with a given probability.
- Sequential palette
- Colours from light to dark for ordered quantities.
- Diverging palette
- Two hues diverging from a neutral midpoint, for values above and below a centre.
- WCAG
- Web Content Accessibility Guidelines, the standard for accessible web content.
Practice problems
Work each problem on paper first, then reveal the answer to check.
Which chart would you use to compare median delivery times across 25 warehouses?
Show answer
A horizontal dot plot or bar chart sorted by median (or box plots if the spread matters), with warehouse names on the vertical axis.
Why does a pie chart with eight slices perform poorly?
Show answer
Angles and areas are judged inaccurately, small slices are hard to compare, and eight hues require a legend; a sorted bar chart is clearer.
A bar chart shows sales of 40 and 50 with an axis starting at 35. What is the lie factor?
Show answer
Data change 25%; bars 5 and 15 units: 200% larger; lie factor 200/25 = 8.
A map shows the number of flu cases by county, and the largest cities are darkest. What is wrong?
Show answer
It shows population, not risk; map cases per 100,000 people instead.
What palette suits each: (a) product categories, (b) population density, (c) change in temperature from normal?
Show answer
(a) qualitative; (b) sequential; (c) diverging, centred on zero change.
A bootstrap 95% interval for a difference in means is −1.2 to 4.8. What can be concluded?
Show answer
The data are consistent with no difference (the interval includes 0); the observed difference is not established at this sample size.
Rewrite the title "Revenue by quarter, 2024–2026" as an explanatory title, given that revenue grew every quarter except one.
Show answer
For example: "Revenue grew in 11 of 12 quarters, dipping only in Q3 2025".
A model has recall 0.8 and precision 0.5 for a condition with 5% prevalence. Describe it per 1000 people.
Show answer
50 have the condition; the model catches 40 and misses 10; it flags 80 people, 40 of whom do not have the condition.
Why is a scatter plot of 200,000 points often uninformative, and what helps?
Show answer
Points overplot into a solid blob; use transparency, smaller markers, sampling, hexagonal binning or density contours.
Give three ways to make a line chart readable without colour.
Show answer
Label each line directly at its end, use different line styles or markers, and highlight one series in black with the rest in grey.
Lesson quiz · 5 questions
Score 60% or more to complete this lesson.
Create a free account to save your progress, take quizzes and earn a certificate.