
AI-220 · Lesson 1 of 12 · 32 min
Data sources and collection
A machine learning model is a summary of the data it was trained on. If the data is biased, stale, mislabelled or collected in a way that leaks the answer, no model architecture will fix it. Practitioners routinely report that most of the work in an applied machine learning project goes into finding, collecting, cleaning and understanding data rather than into modelling, and many of the most consequential failures of deployed systems trace back to data decisions made early and never revisited.
This course covers that work. This lesson is about where data comes from and how to collect it responsibly and representatively. The section at the end of this lesson shows how the remaining eleven lessons build on it. The code uses Python with pandas, NumPy, scikit-learn and Matplotlib, as introduced in AI-110, and SQL as introduced in CMPUT-291.
Kinds of data
Data comes in three broad forms, each needing different tools:
- Structured data fits in tables with fixed columns and types: transactions, sensor readings, customer records. It lives in relational databases and spreadsheets and is queried with SQL or pandas.
- Semi-structured data has structure that varies from record to record: JSON documents from web APIs, log lines, XML, event streams. It must be parsed and often flattened before analysis.
- Unstructured data has no predefined fields: free text, images, audio and video. It is the raw material of most modern deep learning, and usually needs labels or embeddings (Lesson 6) before it can be used for supervised learning.
Two further shapes deserve mention. Time series record a quantity at successive times, and their order matters for every later step, from splitting into training and test sets to computing features. Graphs record entities and the relationships between them, such as users and their connections or parts and their assemblies.
Before collecting anything, decide the unit of analysis: what one row of the final data set represents. A fraud model might predict at the level of a transaction, a customer or a merchant-day, and each choice changes what must be collected, how labels are defined and what counts as a duplicate.
Where data comes from
Most data used in industry comes from one of these sources:
- Operational databases: the systems that run the business, such as orders, accounts and inventory. They are designed for transactions, not analysis, so data is usually copied out of them into an analytical store (Lesson 8).
- Event logs and telemetry: clicks, page views, application logs, machine and sensor readings. They are high in volume and often semi-structured.
- Application programming interfaces (APIs): services that return data on request, usually as JSON, such as weather services, financial data providers and social media platforms.
- Public and open data sets: government statistics, scientific data, benchmark data sets. Their licences vary, and they may not match the population the model will serve.
- Web scraping: extracting data from web pages, which raises legal and ethical questions covered below.
- Surveys, experiments and human annotation: data created specifically for the project, which is expensive but can be designed to answer the question.
- Synthetic data: data generated by simulation or by a model, useful for testing, privacy and rare cases, but only as good as the process that generated it.
Reading common formats
Pandas reads most tabular and semi-structured formats directly. CSV is the most common exchange format, and JSON the most common API format. Nested JSON must be flattened into columns, which pandas does with json_normalize.
import io, json
import pandas as pd

csv_text = """order_id,customer,amount,order_date
1001,ana,25.50,2026-03-01
1002,ben,13.00,2026-03-01
1003,ana,7.25,2026-03-02
"""
orders = pd.read_csv(io.StringIO(csv_text), parse_dates=["order_date"])
print(orders.dtypes)
print()

api_json = """[
 {"id": 1, "name": "ana", "address": {"city": "Halifax", "country": "CA"}, "tags": ["vip"]},
 {"id": 2, "name": "ben", "address": {"city": "Denver", "country": "US"}, "tags": []}
]"""
customers = pd.json_normalize(json.loads(api_json))
print(customers)order_id int64 customer str amount float64 order_date datetime64[us] dtype: object id name tags address.city address.country 0 1 ana [vip] Halifax CA 1 2 ben [] Denver US
The output shown is from pandas 3, which stores text in a dedicated string type (str) and dates at microsecond resolution; pandas 2 reports the same columns as object and datetime64[ns]. Note that the dates were parsed as a datetime type only because parse_dates asked for it, and that json_normalize turned the nested address object into dotted column names but left the tags list as a single column of lists. Lists inside records usually need their own table, one row per tag, linked by the customer id.
Parsing logs
Log files are a common source of behavioural data. Each line follows a format that a regular expression can parse into fields. The pattern below extracts the client address, timestamp, request and status code from a web server log.
import re
import pandas as pd

log = """203.0.113.5 - - [12/Mar/2026:10:01:44 +0000] "GET /products/42 HTTP/1.1" 200 5120
198.51.100.7 - - [12/Mar/2026:10:01:45 +0000] "GET /cart HTTP/1.1" 200 812
203.0.113.5 - - [12/Mar/2026:10:01:51 +0000] "POST /checkout HTTP/1.1" 500 97
192.0.2.33 - - [12/Mar/2026:10:02:03 +0000] "GET /products/7 HTTP/1.1" 404 0
198.51.100.7 - - [12/Mar/2026:10:02:09 +0000] "POST /checkout HTTP/1.1" 200 233"""

pattern = re.compile(r"(?P<ip>\S+) - - \[(?P<ts>[^]]+)\] \"(?P<method>\w+) (?P<path>\S+) [^\"]+\" (?P<status>\d{3}) (?P<bytes>\d+)")
rows = [m.groupdict() for m in pattern.finditer(log)]
df = pd.DataFrame(rows)
df["ts"] = pd.to_datetime(df["ts"], format="%d/%b/%Y:%H:%M:%S %z")
df["status"] = df["status"].astype(int)
print(df[["ip", "method", "path", "status"]])
print()
print(df["status"].value_counts().sort_index())ip method path status 0 203.0.113.5 GET /products/42 200 1 198.51.100.7 GET /cart 200 2 203.0.113.5 POST /checkout 500 3 192.0.2.33 GET /products/7 404 4 198.51.100.7 POST /checkout 200 status 200 3 404 1 500 1 Name: count, dtype: int64
Collecting from APIs
APIs rarely return everything in one response. They paginate, returning a page of results and a cursor or page number for the next, and they enforce rate limits, rejecting requests that arrive too quickly (often with HTTP status 429). A robust collector follows the pagination to the end, retries temporary failures with exponential backoff (waiting 1, 2, 4, 8 … seconds), records when each record was collected, and saves the raw responses before transforming them, so that a bug in the transformation does not require collecting everything again. The example below simulates an API so that it runs without a network connection.
import random

random.seed(3)
DATA = [{"id": i, "value": i * i} for i in range(1, 24)]

def fake_api(cursor=0, page_size=10):
    """Return one page of results; fails randomly to mimic rate limits."""
    if random.random() < 0.3:
        return {"status": 429}
    page = DATA[cursor:cursor + page_size]
    nxt = cursor + page_size if cursor + page_size < len(DATA) else None
    return {"status": 200, "items": page, "next": nxt}

def collect():
    records, cursor, calls = [], 0, 0
    while True:
        for attempt in range(5):
            calls += 1
            r = fake_api(cursor)
            if r["status"] == 200:
                break
            wait = 2 ** attempt          # a real collector would time.sleep(wait)
            print(f"429 on cursor {cursor}, retry in {wait} s")
        else:
            raise RuntimeError("gave up")
        records.extend(r["items"])
        if r["next"] is None:
            return records, calls
        cursor = r["next"]

records, calls = collect()
print(f"{len(records)} records in {calls} calls; last = {records[-1]}")429 on cursor 0, retry in 1 s
23 records in 4 calls; last = {'id': 23, 'value': 529}Legal and ethical limits
Being able to download data does not mean being allowed to use it. Four questions should be answered before collection starts.
- Terms and licences: what do the website's terms of service or the data set's licence permit? Many open data sets allow research but not commercial use, or require attribution. A robots.txt file states which parts of a site the owner does not want crawled; it is not itself a law, but ignoring it weakens any claim of good faith and may breach the site's terms.
- Copyright: in Canada, the Copyright Act protects most text, images and other works, and allows some uses under "fair dealing" for purposes such as research, private study, education and criticism. Whether copying works to train a model is fair dealing has not been settled, and the federal government has consulted on whether to add a specific exception for text and data mining. Treat copyrighted training data as a legal question, not a technical one.
- Personal information: in Canada, private-sector collection, use and disclosure of personal information is governed by PIPEDA, or by substantially similar provincial laws in Quebec, Alberta and British Columbia. Quebec's Law 25 adds strict consent, privacy impact assessment and automated-decision transparency requirements. The core principles are that information is collected for identified purposes, with consent, limited to what is needed, and protected.
- Purpose and minimization: collect only the fields the project needs, keep them only as long as needed, and do not reuse data collected for one purpose for a different one without checking that the new use is permitted. Data that is never collected cannot leak.
Sampling and representativeness
A model learns the population its training data represents, not the one its builders had in mind. Three terms help:
- The target population: everyone or everything the model will be used on.
- The sampling frame: the list or mechanism from which data can actually be drawn, such as registered users, customers who answered a survey, or images posted online.
- The sample: the records actually collected.
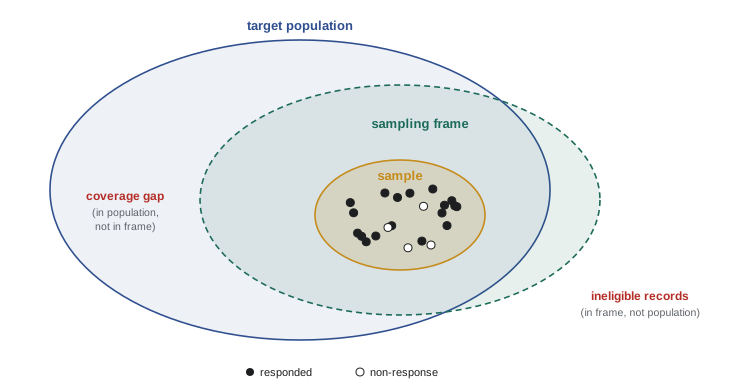
Bias enters wherever these differ. Selection bias occurs when the frame or the collection process favours some groups: a model trained on app users underrepresents people without smartphones. Non-response bias occurs when those who respond differ from those who do not. Survivorship bias occurs when only the survivors of some process are observed, such as loans that were approved (the outcomes of rejected applications are never seen). Measurement bias occurs when the recorded value systematically differs from the true value for some groups, such as a sensor that reads high in cold weather. Finally, the world changes: data collected last year may not represent next year, a problem revisited as drift in AI-410.
Simple and stratified sampling
When the data set is too large to label or process in full, a sample is drawn. A simple random sample gives every record the same chance. A stratified sample first divides records into groups (strata) and samples within each, guaranteeing that small groups are represented. Sampling the same fraction from each stratum (proportional allocation) preserves the overall mix; sampling a fixed number from each (equal allocation) oversamples small groups, which then need weights to estimate population quantities.
import numpy as np
import pandas as pd

rng = np.random.default_rng(7)
n = 100_000
region = rng.choice(["north", "south", "east", "west", "island"], size=n,
                    p=[0.40, 0.30, 0.15, 0.13, 0.02])
df = pd.DataFrame({"region": region})

simple = df.sample(n=500, random_state=1)
stratified = df.groupby("region").sample(frac=500 / n, random_state=1)

summary = pd.DataFrame({
    "population": df["region"].value_counts(normalize=True),
    "simple": simple["region"].value_counts(normalize=True),
    "stratified": stratified["region"].value_counts(normalize=True),
}).round(3)
print(summary.sort_values("population", ascending=False))
print("island rows: simple", (simple.region == "island").sum(),
"| stratified", (stratified.region == "island").sum())population simple stratified region north 0.40 0.378 0.40 south 0.30 0.342 0.30 east 0.15 0.164 0.15 west 0.13 0.100 0.13 island 0.02 0.016 0.02 island rows: simple 8 | stratified 10
The stratified sample reproduces each region's share almost exactly; the simple sample is close for large regions but its count for the small island region varies by chance from sample to sample. If the island region matters, an equal-allocation sample with, say, 100 records per region would guarantee enough examples to study it.
Worked problem
How large a sample?
A team will hand-label a random sample of support tickets to estimate the proportion that are complaints, to within ±3 percentage points with 95% confidence. How many tickets must be labelled? How many for ±1 point?
Show solution
- For a proportion, \(n = z^2 p(1-p)/E^2\), with \(z = 1.96\) for 95% confidence. With no prior estimate, use \(p = 0.5\), which gives the largest \(n\).
- \(n = 1.96^2 \times 0.25 / 0.03^2 = 0.9604 / 0.0009 = 1067.1\), so 1068 tickets.
- For \(E = 0.01\): \(n = 0.9604 / 0.0001 = 9604\).
Answer: About 1068 tickets for ±3 points, and 9604 for ±1 point. Tripling the precision needs nine times the data, because the margin of error falls with the square root of the sample size.
Worked problem
Collecting enough of a rare class
Fraudulent transactions are 0.2% of all transactions. A model needs at least 1000 fraud examples to train and another 250 to test. How many random transactions must be collected? How else could the examples be obtained?
Show solution
- Total fraud examples needed: 1250.
- Random collection: \(1250 / 0.002 = 625{,}000\) transactions.
- Alternatively, collect all known fraud cases from investigation records and a random sample of non-fraud transactions, then record the sampling rates so that the class balance can be corrected when estimating real-world precision.
Answer: About 625,000 random transactions, or far fewer with case-control sampling. Case-control sampling is efficient, but metrics like precision measured on the rebalanced data overstate real-world performance unless reweighted to the true 0.2% rate.
Leakage starts at collection
Data leakage occurs when information that would not be available at prediction time finds its way into the training data, making the model look far better in testing than it will be in use. Much leakage is created at collection time:
- Fields recorded after the outcome: a churn model given a "cancellation reason" field, or a hospital readmission model given the discharge diagnosis code assigned weeks later.
- Snapshots taken today of values that changed: a customer's current account balance used to predict whether they defaulted last year. The fix is point-in-time correct data, meaning each feature value as it was known at the moment the prediction would have been made.
- Duplicates and near-duplicates across splits: the same patient, user or document appearing in both training and test sets, which rewards memorization.
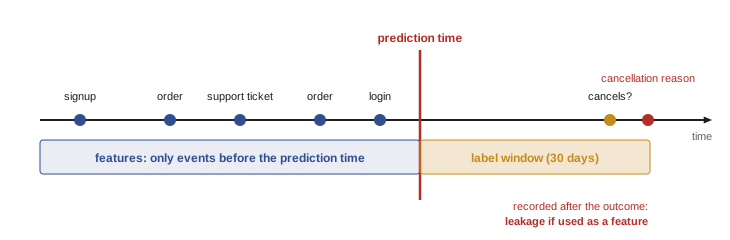
The best defence is to record, for every field, when it becomes known, and to build training examples as of a prediction time: everything before it can be a feature, and only what happens after it can be the label.
Synthetic data and augmentation
When real data is scarce, sensitive or lacks rare cases, it can be supplemented. Augmentation creates new training examples by transforming real ones, such as flipping and cropping images or paraphrasing sentences, in ways that should not change the label. Synthetic data is generated from scratch, by simulation (driving simulators, physics models) or by generative models. Both help, but neither creates information the generator lacks: a simulator that does not model sensor glare will not teach a model about glare, and a generative model trained on biased data reproduces its biases. Synthetic data should be validated by checking that models trained on it perform well on real held-out data.
How this course is organized
The course follows data from its sources to the decisions and models it supports. This lesson covers collection. Lesson 2 covers SQL for extracting data and Lesson 3 wrangling it with pandas. Lesson 4 covers cleaning and feature engineering, and Lesson 5 the special handling of text, time series, location and image data. Lesson 6 covers labelling and documenting data sets, and Lesson 7 governance, privacy and security. Lessons 8 and 9 cover pipelines and storage, and processing data at scale. Lesson 10 covers visualization and communication, Lesson 11 metrics, dashboards and experiments, and Lesson 12 the data practices that keep models working in production, ending with a complete project.
Common mistakes
MistakeCollecting data first and deciding the unit of analysis later.
InsteadDefine what one row represents, and when its prediction is made, before collecting anything.
MistakeAssuming that public or downloadable data is free to use for any purpose.
InsteadCheck licences, terms of service, copyright and privacy law before collection.
MistakeOverwriting raw data with transformed data.
InsteadKeep the raw responses immutable and transform copies, so collection never has to be repeated to fix a bug.
MistakeUsing current snapshots of changing values as historical features.
InsteadUse point-in-time correct values as known at the prediction time.
MistakeTreating a large sample as automatically representative.
InsteadA large biased sample is still biased; compare the sampling frame with the target population.
Summary and key terms
- Data quality and collection decisions limit what any model can achieve.
- Data is structured, semi-structured or unstructured; time series and graphs need special handling. Fix the unit of analysis first.
- Sources: operational databases, logs, APIs, public data, scraping, surveys and annotation, synthetic data.
- Pandas reads CSV and JSON and flattens nested records; regular expressions parse logs.
- API collectors follow pagination, back off exponentially on rate limits and keep raw responses.
- Check licences, terms, copyright and privacy law, and collect only what is needed.
- Target population, sampling frame and sample: bias enters where they differ (selection, non-response, survivorship, measurement).
- Stratified sampling guarantees representation of small groups; sample size for a proportion is \(z^2 p(1-p)/E^2\).
- Leakage often starts at collection: record when each field becomes known and build examples as of a prediction time.
- Structured data
- Data organized in tables with fixed columns and types.
- Semi-structured data
- Data with flexible, self-describing structure, such as JSON or logs.
- Unit of analysis
- What a single row of the data set represents.
- Pagination
- Splitting API results into pages retrieved by successive requests.
- Exponential backoff
- Retrying a failed request after waits that double each time.
- Sampling frame
- The list or mechanism from which a sample can actually be drawn.
- Selection bias
- Systematic difference between the sample and the target population caused by how records were selected.
- Survivorship bias
- Bias from observing only cases that passed some selection process.
- Stratified sampling
- Sampling separately within groups to control their representation.
- Data leakage
- Information unavailable at prediction time entering the training data.
- Point-in-time correctness
- Using each feature value as it was known at the moment of prediction.
- Data augmentation
- Creating new training examples by label-preserving transformations of real ones.
- Synthetic data
- Data generated by simulation or a model rather than observed.
Practice problems
Work each problem on paper first, then reveal the answer to check.
Classify each as structured, semi-structured or unstructured: a table of invoices; a folder of chest X-rays; API responses in JSON; customer reviews.
Show answer
Structured; unstructured; semi-structured; unstructured (text), possibly with structured fields such as a star rating.
How many labelled examples are needed to estimate a proportion to ±5 points at 95% confidence?
Show answer
0.9604 / 0.0025 = 384.2, so 385.
If the true proportion is known to be about 10%, how many samples give ±3 points at 95%?
Show answer
3.8416 × 0.09 / 0.0009 = 384.2, so 385: far fewer than the 1068 needed when p = 0.5.
A retry loop waits 1, 2, 4, 8 and 16 s. What is the total wait if all five retries are needed?
Show answer
31 s.
A loan default model is trained only on approved loans. What bias does this introduce?
Show answer
Survivorship (selection) bias: outcomes for rejected applicants are never observed, so the model may perform poorly on applicants unlike those previously approved.
A churn model reaches 99% accuracy. Its features include "days since last login" computed today. What is wrong?
Show answer
Leakage: churned customers have not logged in since they left, so the feature encodes the outcome. Features must be computed as of the prediction date.
A sample of 2000 is drawn with equal allocation of 400 from each of five regions whose population shares are 40, 30, 15, 13 and 2%. What weight should each island record (2%) get when estimating population totals, relative to a north record (40%)?
Show answer
Weights are proportional to share ÷ sample share: north 0.40/0.20 = 2.0, island 0.02/0.20 = 0.1, so each island record counts 1/20 as much as a north record.
Why should raw API responses be saved before transformation?
Show answer
So that transformation bugs can be fixed by reprocessing, without repeating collection (which may be slow, rate-limited, costly or no longer possible).
Give one example each of measurement bias and non-response bias.
Show answer
Measurement: a thermometer reading high in direct sun. Non-response: a satisfaction survey answered mostly by very satisfied or very unhappy customers.
How many random transactions are needed to collect 400 fraud cases at a 0.5% fraud rate?
Show answer
400 / 0.005 = 80,000.
Lesson quiz · 5 questions
Score 60% or more to complete this lesson.
Create a free account to save your progress, take quizzes and earn a certificate.