
AI-220 · Lesson 3 of 12 · 27 min
Wrangling data with pandas
Once data has been extracted, most of the work of preparing it happens in a dataframe library, and in Python that usually means pandas. Wrangling is the reshaping, combining and summarizing that turns raw tables into the form an analysis or model needs. Done carelessly it introduces errors that are hard to see: rows multiplied by a merge, values aligned to the wrong dates, groups computed across the wrong boundaries. This lesson covers tidy data and reshaping, grouped operations, merges that check their own assumptions, and the handling of dates, times and time zones, including joins that respect the moment each fact became known.
Tidy data
Data is tidy when each variable is a column, each observation is a row, and each type of observation is a table. Many sources are not tidy: spreadsheets often put years or months across the columns, survey exports put each answer option in its own column, and sensor exports put several measurements in one text field. Tidy data is easier to filter, group, plot and model, because every operation can refer to variables by name.
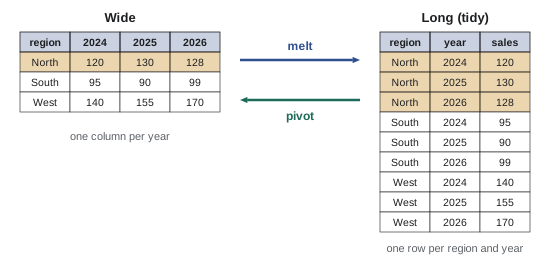
The two basic reshaping operations are:
- melt (wide to long): turn several columns into two, one naming the former column (the year, say) and one holding its value.
- pivot (long to wide): spread one column's values across new columns, for reports or for models that expect one column per feature.
import pandas as pd

# Wide: one column per year, as often found in spreadsheets
wide = pd.DataFrame({
    "region": ["North", "South", "West"],
    "2024": [120, 95, 140],
    "2025": [130, 90, 155],
    "2026": [128, 99, 170],
})
long = wide.melt(id_vars="region", var_name="year", value_name="sales")
long["year"] = long["year"].astype(int)
print(long.sort_values(["region", "year"]).to_string(index=False))

# Long data is easy to group and model
growth = long.sort_values("year").groupby("region")["sales"].agg(["first", "last"])
growth["pct"] = (100 * (growth["last"] / growth["first"] - 1)).round(1)
print(growth)

# And easy to turn back into a report table
print(long.pivot(index="year", columns="region", values="sales"))region year sales
North 2024 120
North 2025 130
North 2026 128
South 2024 95
South 2025 90
South 2026 99
West 2024 140
West 2025 155
West 2026 170
first last pct
region
North 120 128 6.7
South 95 99 4.2
West 140 170 21.4
region North South West
year
2024 120 95 140
2025 130 90 155
2026 128 99 170In the long form, the year is an ordinary variable that can be sorted, filtered and used as a feature, and a new year adds rows rather than a column, so code does not have to change when data grows.
Split, apply, combine
Grouped operations follow a pattern: split the data into groups by one or more keys, apply a function to each group, and combine the results. pandas offers three kinds of apply:
- agg: reduce each group to one row (count, sum, mean, quantiles). Named aggregation gives the output columns clear names.
- transform: compute a group statistic and broadcast it back to every row of the group, keeping the original shape. This is how to express each row relative to its group: share of the group total, difference from the group mean, rank within the group.
- filter: keep or drop whole groups based on a condition.
import numpy as np
import pandas as pd

rng = np.random.default_rng(3)
df = pd.DataFrame({
    "store": rng.choice(["A", "B", "C"], 12),
    "product": rng.choice(["tea", "coffee"], 12),
    "units": rng.integers(1, 20, 12),
    "price": rng.choice([3.5, 4.0, 4.5], 12),
})
df["revenue"] = df["units"] * df["price"]

# agg: one row per group, with named outputs
summary = df.groupby("store").agg(
    orders=("units", "size"),
    units=("units", "sum"),
    revenue=("revenue", "sum"),
    avg_price=("price", "mean"),
).round(2)
print(summary)

# transform: a group statistic broadcast back to every row
df["store_share"] = (df["revenue"] / df.groupby("store")["revenue"].transform("sum")).round(3)
df["units_vs_store_mean"] = df["units"] - df.groupby("store")["units"].transform("mean").round(1)
print(df.head(5).to_string(index=False))

# filter: keep only groups that meet a condition
big = df.groupby("store").filter(lambda g: g["revenue"].sum() > 150)
print("stores kept:", sorted(big["store"].unique())) orders units revenue avg_price
store
A 7 66 272.0 4.07
B 2 32 131.0 4.00
C 3 38 137.0 3.67
store product units price revenue store_share units_vs_store_mean
C coffee 8 4.0 32.0 0.234 -4.7
A tea 9 4.5 40.5 0.149 -0.4
A tea 13 4.5 58.5 0.215 3.6
A tea 12 3.5 42.0 0.154 2.6
A coffee 4 4.5 18.0 0.066 -5.4
stores kept: ['A']Group-relative features, like those made with transform, are among the most useful in practice: a transaction that is large for this customer, a reading that is high for this machine, a price that is low for this neighbourhood. They must be computed using only training data (and only data before each example's prediction time), or they leak information into evaluation (Lesson 4).
Worked problem
Share of group
Store A has rows with revenue 40.5, 58.5 and others, totalling 272.0. What is the store_share of the 58.5 row, and how is it computed without a loop?
Show solution
- Share: \(58.5 / 272.0 = 0.215\).
- Vectorized: divide the revenue column by df.groupby("store")["revenue"].transform("sum"), which returns 272.0 on every store A row.
Answer: 0.215, computed for all rows at once by dividing by the group total broadcast with transform.
Merging with checks
A merge (join) in pandas has the same semantics as in SQL (Lesson 2), and the same dangers. The most common error is a duplicated key on the side that is supposed to be unique: each duplicate creates an extra copy of the matching rows on the other side, inflating counts and sums without any warning. Two arguments turn hidden assumptions into checks:
- validate states the expected relationship, "one_to_one", "one_to_many" or "many_to_one", and raises an error if the keys do not satisfy it.
- indicator adds a column showing whether each row matched on both sides or only one, so unmatched rows can be counted and investigated.
import pandas as pd

customers = pd.DataFrame({"cust": [1, 2, 3, 3], "segment": ["retail", "retail", "business", "business"]})
orders = pd.DataFrame({"order": [10, 11, 12, 13], "cust": [1, 3, 3, 4], "amount": [50, 70, 30, 20]})

# A duplicated key on the "one" side silently creates extra rows
m = orders.merge(customers, on="cust", how="left")
print("rows before", len(orders), "after", len(m))

# validate= turns that silent error into an exception
try:
    orders.merge(customers, on="cust", how="left", validate="many_to_one")
except pd.errors.MergeError as e:
    print("MergeError:", str(e).splitlines()[0])

# Fix the duplicate, then merge with an indicator to see unmatched rows
customers = customers.drop_duplicates("cust")
m = orders.merge(customers, on="cust", how="left", validate="many_to_one", indicator=True)
print(m.to_string(index=False))
print(m["_merge"].value_counts().to_dict())rows before 4 after 6
MergeError: Merge keys are not unique in right dataset; not a many-to-one merge
order cust amount segment _merge
10 1 50 retail both
11 3 70 business both
12 3 30 business both
13 4 20 NaN left_only
{'both': 3, 'left_only': 1, 'right_only': 0}A good habit is to state the expected row count after every merge and assert it in code. A merge of orders to customers with how="left" and validate="many_to_one" must return exactly as many rows as there are orders; if it does not, something is wrong with the keys.
Keys that look equal but are not
Merges fail to match when keys differ in type or format: an integer 42 and a string "42", "A-001" and "a-001", trailing spaces, leading zeros dropped by a spreadsheet (postal codes, product codes). Normalize keys before merging, and check the match rate with the indicator.
Dates, times and time zones
Time is the most error-prone kind of data. A timestamp without a time zone is ambiguous; a local time around a daylight-saving change may occur twice or not at all; and different systems record events in different zones. Robust practice is:
- Store and compute in UTC; convert to local time only for display and for grouping by local calendar day.
- Parse timestamps with an explicit format and time zone, and check the result.
- Be aware that a local day can have 23 or 25 hours, and that "daily" aggregates depend on which day boundary is used.
import pandas as pd

# Meter readings recorded in UTC around the 2026 autumn clock change in Toronto
utc = pd.date_range("2026-10-31 22:00", periods=8, freq="2h", tz="UTC")
readings = pd.DataFrame({"time": utc, "kwh": [1.0, 1.2, 0.8, 0.7, 0.9, 1.4, 1.6, 1.5]})
readings["local"] = readings["time"].dt.tz_convert("America/Toronto")
print(readings[["time", "local", "kwh"]].to_string(index=False))

# Daily totals by LOCAL calendar day: resample after converting
daily = readings.set_index("local")["kwh"].resample("D").sum()
print(daily)

# Point-in-time join: attach the price in force at each reading
prices = pd.DataFrame({
    "time": pd.to_datetime(["2026-10-31 00:00", "2026-11-01 07:00"], utc=True),
    "price": [0.098, 0.151],
})
joined = pd.merge_asof(readings.sort_values("time"), prices.sort_values("time"),
                       on="time", direction="backward")
joined["cost"] = (joined["kwh"] * joined["price"]).round(3)
print(joined[["time", "kwh", "price", "cost"]].to_string(index=False)) time local kwh
2026-10-31 22:00:00+00:00 2026-10-31 18:00:00-04:00 1.0
2026-11-01 00:00:00+00:00 2026-10-31 20:00:00-04:00 1.2
2026-11-01 02:00:00+00:00 2026-10-31 22:00:00-04:00 0.8
2026-11-01 04:00:00+00:00 2026-11-01 00:00:00-04:00 0.7
2026-11-01 06:00:00+00:00 2026-11-01 01:00:00-05:00 0.9
2026-11-01 08:00:00+00:00 2026-11-01 03:00:00-05:00 1.4
2026-11-01 10:00:00+00:00 2026-11-01 05:00:00-05:00 1.6
2026-11-01 12:00:00+00:00 2026-11-01 07:00:00-05:00 1.5
local
2026-10-31 00:00:00-04:00 3.0
2026-11-01 00:00:00-04:00 6.1
Freq: D, Name: kwh, dtype: float64
time kwh price cost
2026-10-31 22:00:00+00:00 1.0 0.098 0.098
2026-11-01 00:00:00+00:00 1.2 0.098 0.118
2026-11-01 02:00:00+00:00 0.8 0.098 0.078
2026-11-01 04:00:00+00:00 0.7 0.098 0.069
2026-11-01 06:00:00+00:00 0.9 0.098 0.088
2026-11-01 08:00:00+00:00 1.4 0.151 0.211
2026-11-01 10:00:00+00:00 1.6 0.151 0.242
2026-11-01 12:00:00+00:00 1.5 0.151 0.226The conversion shows the offset changing from −04:00 to −05:00 on 1 November: the readings are evenly spaced in UTC, but local times jump. Resampling by local day after conversion puts each reading in the right calendar day for a Toronto customer.
Point-in-time joins
The last part of the example uses merge_asof, which joins each row to the most recent row of another table at or before its timestamp. This is the right tool whenever a value changes over time and each event needs the value in force when it occurred: prices, exchange rates, a customer's plan, a model version, a sensor's calibration. An ordinary merge on date would either fail to match or attach a value that was not yet known, a subtle form of leakage.
Worked problem
Choosing the direction
A fraud model needs, for each transaction, the customer's credit limit as it stood when the transaction happened. Limits are stored as change events with timestamps. Which merge_asof direction is correct, and why not "nearest"?
Show solution
- The limit in force at time t is the most recent change at or before t: direction="backward".
- "nearest" might choose a change made shortly after the transaction, which was not known at the time.
Answer: direction="backward". A forward or nearest match would leak future information into training data, making the model look better in evaluation than it can be in production.
Performance and correctness habits
pandas is fast when operations are vectorized, applied to whole columns at once, and slow when Python loops run over rows. A few habits keep code fast and correct:
- Prefer column operations, groupby and merges to loops and row-wise apply.
- Use appropriate types: categories for repeated strings, nullable integers for integer columns with missing values, datetime types for times. Lesson 9 shows how much memory this saves.
- Avoid chained assignment (setting values on a filtered copy); use .loc with a boolean mask on the original frame.
- Assert invariants: unique keys, expected row counts, no missing values in required columns, values within valid ranges.
- Keep wrangling code in functions or scripts, not only in notebook cells run out of order, so it can be re-run from raw data.
Common mistakes
MistakeMerging without checking key uniqueness.
InsteadUse validate= and assert the expected row count after the merge.
MistakeComputing group statistics on the full data before splitting.
InsteadFit group features on training data, up to each example's prediction time.
MistakeStoring naive local timestamps.
InsteadStore UTC with zone information; convert to local only for display or local-day grouping.
MistakeJoining time-varying values on the nearest date.
InsteadUse a backward point-in-time join so only known values are used.
MistakeLooping over rows to compute group features.
InsteadUse groupby with agg or transform.
Summary and key terms
- Tidy data has one variable per column and one observation per row; melt and pivot reshape it.
- Split-apply-combine: agg reduces groups, transform broadcasts group values, filter keeps groups.
- Merges multiply rows when keys repeat; validate and indicator expose the problem.
- Normalize key types and formats before merging.
- Compute in UTC; local days can have 23 or 25 hours.
- merge_asof joins the value in force at each event, preventing leakage.
- Tidy data
- Data with one variable per column and one observation per row.
- Melt
- Reshape from wide to long.
- Pivot
- Reshape from long to wide.
- agg
- A grouped reduction to one row per group.
- transform
- A grouped calculation broadcast back to every row.
- validate
- A merge argument that checks the key relationship.
- Indicator column
- A merge column showing which side each row matched.
- UTC
- Coordinated Universal Time, with no daylight saving.
- Point-in-time join
- A join to the value in force at each event's time.
- Vectorized
- Operating on whole columns rather than row by row.
Practice problems
Work each problem on paper first, then reveal the answer to check.
A table has columns Jan, Feb, Mar of sales per product. Which operation makes it tidy?
Show answer
melt, with id_vars="product".
Which grouped operation keeps the original number of rows?
Show answer
transform.
What does filter do in a groupby?
Show answer
Keeps or drops whole groups by a condition.
Orders 1,000 rows merged left to customers with one duplicate customer having 5 orders. Rows after?
Show answer
1,005.
Which validate value fits orders merged to customers?
Show answer
"many_to_one".
Name two reasons equal-looking keys fail to match.
Show answer
Different types (int vs str), case or spacing, dropped leading zeros.
How many hours does Toronto's local day of 1 November 2026 have?
Show answer
25.
Why compute in UTC?
Show answer
It is unambiguous and has no daylight-saving jumps.
Which merge_asof direction avoids using future values?
Show answer
"backward".
What is chained assignment, and what replaces it?
Show answer
Setting values on a filtered copy; use .loc on the original.
Lesson quiz · 5 questions
Score 60% or more to complete this lesson.
Create a free account to save your progress, take quizzes and earn a certificate.