
PYTH-260 · Lesson 10 of 12 · 23 min
Monitoring and logging in production
▶ Video coming soon A video version of this lesson is on the way.
Ridgeline's silent Tuesday, when the morning report produced nothing and nobody noticed for three hours, is the problem this lesson solves. Once software runs unattended on machines nobody watches, the only way to know what it is doing is to have it tell you. Production software reports on itself in three ways: logs, which record individual events; metrics, which count and measure over time; and traces, which follow single requests through the system. On top of those sit dashboards for people to look at and alerts that wake someone when something is wrong. Together they are called observability: the ability to understand what a system is doing from the outside.
Logging with the standard library
Python's logging module, in the standard library since 2002, is the foundation. Code creates a logger, usually one per module with logging.getLogger(__name__), and calls methods named after severity levels: debug for detail useful while developing, info for normal events worth recording, warning for something unexpected that the program handled, error for a failure of one operation, and critical for a failure of the whole program. Configuration, done once at start-up, decides which levels are recorded and where they go. Library code should only create loggers and never configure them; configuring is the application's job.
import logging, sys

logging.basicConfig(stream=sys.stdout, level=logging.INFO,
                    format="%(levelname)-7s %(name)s: %(message)s")
log = logging.getLogger("ridgeline.report")

log.debug("loaded 412 orders")                   # below INFO: not shown
log.info("morning report started for %s", "2026-11-12")
log.warning("supplier price feed is 2 days old; using cached prices")
try:
    1 / 0
except ZeroDivisionError as exc:
    log.error("could not compute average order value: %s", exc)   # log.exception would add the traceback
log.info("report written: %d lines", 38)INFO ridgeline.report: morning report started for 2026-11-12 WARNING ridgeline.report: supplier price feed is 2 days old; using cached prices ERROR ridgeline.report: could not compute average order value: division by zero INFO ridgeline.report: report written: 38 lines
Two details in the example are worth copying. Messages use %s placeholders with separate arguments rather than f-strings, so the text is only built if the message will actually be recorded, and so tools can group messages by their template. And log.exception, called inside an except block, logs at error level and adds the full traceback, which is what anyone diagnosing the problem will want first.
Logs as structured events
In containers, logs go to standard output, and the platform collects them into a central log service where they can be searched (lesson 6). Plain sentences are pleasant to read but hard to search: finding every slow request for one cafe means writing fragile text patterns. Structured logging writes each event as a machine-readable record, usually one JSON object per line, with consistent field names. The log service can then filter by any field: level is error, customer is Bean There Cafe, duration over a second.
import json, logging, sys, io

class JsonFormatter(logging.Formatter):
    """One JSON object per line, with any extra fields passed through."""
    def format(self, record):
        event = {"level": record.levelname.lower(), "logger": record.name, "message": record.getMessage()}
        for key in ("request_id", "customer", "path", "status", "ms"):
            if hasattr(record, key):
                event[key] = getattr(record, key)
        return json.dumps(event)

stream = io.StringIO()
handler = logging.StreamHandler(stream)
handler.setFormatter(JsonFormatter())
log = logging.getLogger("ridgeline.web")
log.addHandler(handler)
log.setLevel(logging.INFO)
log.propagate = False

log.info("order placed", extra={"request_id": "r-7f3a", "customer": "Bean There Cafe", "path": "/orders", "status": 201, "ms": 84})
log.warning("slow request", extra={"request_id": "r-7f3b", "path": "/stock", "status": 200, "ms": 1450})
for line in stream.getvalue().splitlines():
    print(line)
slow = [json.loads(l) for l in stream.getvalue().splitlines() if json.loads(l).get("ms", 0) > 1000]
print("slow requests:", [e["request_id"] for e in slow]){"level": "info", "logger": "ridgeline.web", "message": "order placed", "request_id": "r-7f3a", "customer": "Bean There Cafe", "path": "/orders", "status": 201, "ms": 84}
{"level": "warning", "logger": "ridgeline.web", "message": "slow request", "request_id": "r-7f3b", "path": "/stock", "status": 200, "ms": 1450}
slow requests: ['r-7f3b']A request ID ties together every log line produced while handling one request, even across several services. The load balancer or the first service generates an ID, passes it along in a header, and every log line includes it. When a cafe reports an error, the ID shown on the error page leads straight to every relevant line.
Logs need care about what goes in them. Never log passwords, API keys or session tokens (lesson 7's redaction applies), and think hard before logging personal information such as names, emails and addresses: privacy laws apply to logs too, and logs are often kept longer and shared more widely than databases. Log identifiers instead of personal details where you can, and set a retention period so old logs are deleted.
Metrics: counting and measuring
Logs answer questions about particular events. Metrics answer questions about the system as a whole over time: how many requests per minute, what share failed, how long they took, how full the disk is. A metric is a number sampled or counted repeatedly and stored as a time series. The two most common kinds are counters, which only go up (requests served, errors, orders placed), and gauges, which go up and down (memory in use, items in a queue, instances running). Histograms record the distribution of measurements such as durations.
For a service that handles requests, a widely used checklist is RED: Rate (requests per second), Errors (failed requests per second, or the failure share), and Duration (how long requests take). For resources such as machines, disks and databases, the matching checklist is USE: Utilization, Saturation and Errors. Ridgeline's dashboard for the wholesale site shows the RED metrics for each endpoint, plus database connections and container count.
import json

log_lines = [
    '{"path": "/orders", "status": 201, "ms": 84}',
    '{"path": "/stock", "status": 200, "ms": 31}',
    '{"path": "/orders", "status": 500, "ms": 2010}',
    '{"path": "/stock", "status": 200, "ms": 27}',
    '{"path": "/orders", "status": 201, "ms": 95}',
    '{"path": "/stock", "status": 200, "ms": 1450}',
]
window_seconds = 60

stats = {}
for line in log_lines:
    e = json.loads(line)
    s = stats.setdefault(e["path"], {"count": 0, "errors": 0, "ms": []})
    s["count"] += 1
    s["errors"] += e["status"] >= 500
    s["ms"].append(e["ms"])

for path, s in sorted(stats.items()):
    rate = s["count"] / window_seconds
print(f"{path:<8} rate {rate:.2f}/s errors {s['errors']}/{s['count']} slowest {max(s['ms'])} ms")/orders rate 0.05/s errors 1/3 slowest 2010 ms /stock rate 0.05/s errors 0/3 slowest 1450 ms
Percentiles, not averages
Averages hide the experience that matters. If 99 requests take 50 milliseconds and one takes 5 seconds, the average is about 100 milliseconds, which describes nobody's actual experience, and the one customer who waited five seconds is invisible. Duration is therefore reported as percentiles. The 50th percentile, p50 or the median, is the time within which half the requests finished. The 95th percentile, p95, is the time within which 95 in 100 finished; the remaining 5 were slower. p99 shows the worst one in a hundred. Slow requests often come from the busiest customers with the biggest orders, so the tail matters.
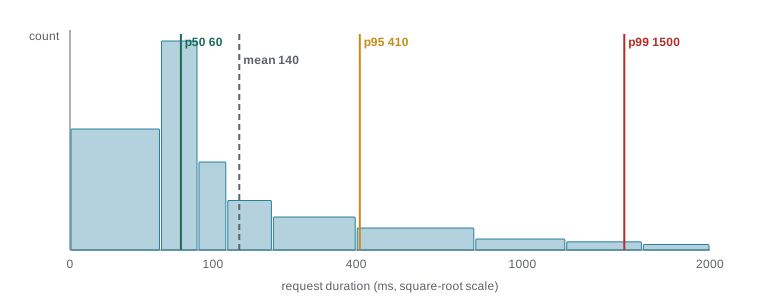
import math

def percentile(values, p):
    """Nearest-rank percentile: the smallest value with at least p in 100 of values at or below it."""
    ordered = sorted(values)
    rank = max(1, math.ceil(p / 100 * len(ordered)))
    return ordered[rank - 1]

durations = [50] * 90 + [120] * 5 + [400, 650, 900, 2400, 5000]
print(f"mean {sum(durations) / len(durations):.0f} ms")
for p in (50, 95, 99):
print(f"p{p} {percentile(durations, p)} ms")mean 144 ms p50 50 ms p95 120 ms p99 2400 ms
Monitoring systems such as Prometheus and the cloud providers' own services compute percentiles from histograms rather than keeping every value, but the meaning is the same.
Service level objectives and alerts
Which numbers deserve an alert? Alerting on everything produces so many notifications that people ignore them, which is worse than no alerts at all. The disciplined approach, popularized by Google's site reliability engineering practice, starts from what customers care about. A service level indicator (SLI) measures it, such as the share of order requests that succeed in under a second. A service level objective (SLO) sets the target, such as 99.5 in 100 over 30 days. The gap between the target and perfection, here 0.5 in 100, is the error budget: the amount of failure the team accepts. Alerts fire when the budget is being spent too fast, not at every blip.
Good alerts are about symptoms customers feel (orders failing, the site slow) rather than causes (CPU at 85 in 100), are actionable (someone can do something now), and point to a runbook, a short page saying what to check and how to fix common causes. Ridgeline has three alerts: order errors above 2 in 100 for five minutes, p95 of order requests above 1.5 seconds for ten minutes, and no successful morning report by 6:30. The third would have caught the silent Tuesday in thirty minutes.
def burn_alert(window, slo_success=0.995, max_burn=10):
    """Alert if errors in this window use the 30-day error budget more than max_burn times too fast."""
    total = sum(w["requests"] for w in window)
    errors = sum(w["errors"] for w in window)
    if total == 0:
        return "no traffic"
    error_rate = errors / total
    budget_rate = 1 - slo_success                  # 0.005 allowed
    burn = error_rate / budget_rate
    return f"ALERT: burning error budget {burn:.1f}x too fast" if burn > max_burn else f"ok (burn {burn:.1f}x)"

quiet = [{"requests": 300, "errors": 1}] * 5
bad_release = [{"requests": 300, "errors": 1}] * 2 + [{"requests": 300, "errors": 45}] * 3
print("normal morning:", burn_alert(quiet))
print("after release: ", burn_alert(bad_release))normal morning: ok (burn 0.7x) after release: ALERT: burning error budget 18.3x too fast
A different kind of alert covers things that should happen but did not. A dead man's switch, or heartbeat check, expects a signal on a schedule: the morning report pings a monitoring service when it finishes, and an alert fires if no ping arrives by 6:30. Absence of output is otherwise invisible, which is exactly how the silent Tuesday went unnoticed.
Tracing
When one request passes through several components, such as the load balancer, the web app, the database and the shipping API, logs and metrics show each piece but not the whole path. Distributed tracing records a trace for a request, made of spans: timed steps such as handle POST /orders, query stock, call shipping API, each linked to its parent. A trace shows at a glance that an order took 1.4 seconds because the shipping API took 1.2 of them. OpenTelemetry is the open standard for producing traces, metrics and logs; its Python packages can instrument Flask, database drivers and HTTP clients automatically, and send the data to many back ends.
import time
from contextlib import contextmanager

spans = []

@contextmanager
def span(name, parent=None):
    """A tiny tracer: records how long each named step took and what it was part of."""
    start = time.perf_counter()
    try:
        yield name
    finally:
        spans.append((name, parent, (time.perf_counter() - start) * 1000))

with span("POST /orders") as root:
    with span("validate cart", root):
        time.sleep(0.002)
    with span("query stock", root):
        time.sleep(0.004)
    with span("call shipping API", root):
        time.sleep(0.03)

for name, parent, ms in reversed(spans):
    indent = "  " if parent else ""
print(f"{indent}{name:<20} {ms:6.1f} ms")POST /orders 36.9 ms call shipping API 30.2 ms query stock 4.2 ms validate cart 2.1 ms
Worked problem
Diagnosing slow orders
At 7:40 the p95 alert fires: order requests are taking 2.3 seconds. Error rates are normal. The dashboard shows CPU at 30 in 100 on every container and database connections normal. What should Jordan look at next, and in what order?
Show solution
- Errors are normal and CPU is low, so the app is waiting on something, not overloaded.
- Open a few traces for slow order requests: they show which span takes the time. Here, call shipping API takes about 2 seconds in each.
- Search the structured logs for the shipping client with ms over 1000: they show timeouts and retries starting at 7:31.
- Check the shipping provider's status page: it reports degraded performance.
- Short term, the runbook says to switch quote requests to the cached shipping rates; long term, add a tighter timeout and a circuit breaker so a slow partner cannot slow every order.
Answer: Use traces to find the slow step, logs to confirm and date it, then apply the runbook's fallback; the shipping API, not Ridgeline's code, was the cause.
Try it yourself
Try it yourself
Percentiles
Write percentile(values, p) using the nearest-rank method: sort the values, take rank = ceil(p / 100 * n) (at least 1), and return the value at that rank (counting from 1). Raise ValueError for an empty list.
def percentile(values, p):
    return sum(values) / len(values)
Try it yourself
Logs to metrics
Each log line is a JSON string with "path", "status" and "ms". Write summarize(lines) that returns a dictionary keyed by path, each value a dictionary with "count", "errors" (status 500 or above) and "max_ms". Skip lines that are not valid JSON.
import json

def summarize(lines):
    return {}
Try it yourself
A heartbeat check
Scheduled jobs ping when they finish. Write missing_jobs(expected, pings, now) where expected maps job names to a deadline in minutes after midnight, pings maps job names to the minute their latest ping arrived today (absent if none), and now is the current minute. Return a sorted list of jobs whose deadline has passed (now > deadline) without a ping at or before the deadline.
def missing_jobs(expected, pings, now):
    return []
Common mistakes
MistakeUsing print for diagnostics in production code.
InsteadUse the logging module with levels, configured once by the application.
MistakeWriting free-text logs that can only be searched with fragile patterns.
InsteadLog structured JSON events with consistent fields, including a request ID.
MistakeLogging passwords, tokens or personal details.
InsteadRedact secrets, log identifiers instead of personal data, and set a retention period.
MistakeReporting average response time.
InsteadReport percentiles such as p50, p95 and p99; averages hide the slow tail.
MistakeAlerting on every metric that looks unusual.
InsteadAlert on customer-facing symptoms tied to an SLO, with a runbook for each alert.
Summary and key terms
- Observability combines logs (events), metrics (numbers over time) and traces (the path of one request).
- Use the logging module with levels; libraries create loggers, applications configure them.
- Structured JSON logs with request IDs can be searched by field; keep secrets and personal data out.
- RED (rate, errors, duration) describes services; USE describes resources.
- Durations are reported as percentiles because averages hide the slow tail.
- SLIs measure what customers feel, SLOs set targets, and error budgets decide when to alert.
- Heartbeat checks catch jobs that silently fail to run; tracing shows where a slow request spent its time.
- observability
- The ability to understand a running system from the data it emits.
- structured logging
- Writing log events as machine-readable records, such as JSON lines.
- request ID
- An identifier attached to every log line produced while handling one request.
- metric
- A number counted or measured repeatedly and stored as a time series.
- percentile
- The value below which a given share of measurements fall, such as p95.
- service level objective
- A target for a service level indicator, such as 99.5 in 100 successful orders.
- error budget
- The amount of failure an SLO allows over its period.
- trace
- A record of one request's path through a system, made of timed spans.
Practice problems
Work each problem on paper first, then reveal the answer to check.
99 requests take 40 ms and one takes 6 seconds. What are the mean and the median?
Show answer
The mean is about 100 ms; the median is 40 ms. Neither shows the 6-second request; p99 would.
Why use log.info("sold %d bags", n) rather than an f-string?
Show answer
The message is formatted only if it will be recorded, and tools can group messages by template.
An SLO is 99.5 in 100 successful orders over 30 days. What is the error budget?
Show answer
0.5 in 100 of orders may fail, 1 in 200.
How would a heartbeat check have changed the silent Tuesday?
Show answer
The missing ping would have raised an alert at the deadline, about 6:30, instead of Theo noticing at nine.
Lesson quiz · 5 questions
Score 60% or more to complete this lesson.
Create a free account to save your progress, take quizzes and earn a certificate.