
PWR-420 · Lesson 6 of 12 · 23 min
Reliability and maintenance strategy
▶ Video coming soon A video version of this lesson is on the way.
Fenella Thorncroft's maintenance backlog stood at about 640 hours at the end of the summer, for a crew of herself and three others (PWR-240). Pilar had always seen that number as Fenella's problem. Grazyna saw it as a strategy question. "Every one of those hours is a decision someone made about when and how to maintain a machine," she said. "If the decisions were better, the backlog would be smaller, and fewer of the jobs in it would be emergencies."
This lesson compares the main maintenance strategies, from running to failure through preventive, predictive and condition-based maintenance, and explains how reliability-centered maintenance chooses among them for each failure mode. It defines the reliability measures a plant uses, including failure rate, mean time between failures, mean time to repair and availability, and works examples with plant data. It then covers criticality ranking, the P-F interval, spare parts, backlog and planning, and the key performance indicators that show whether a maintenance program is working.
Why equipment fails
Equipment fails through a limited number of mechanisms: wear, fatigue, corrosion and erosion, overheating, contamination, misalignment and imbalance, electrical insulation breakdown, and human error during operation or maintenance. Some failures are related to age, getting more likely the longer the machine runs; many are not. Studies of aircraft and industrial equipment since the 1960s found that only a minority of failure modes follow the classic bathtub curve, with high infant mortality, a long flat period and a final wear-out zone. Most complex equipment shows a flat or nearly flat failure rate after an early period, and some shows high infant mortality after every overhaul. That finding changed maintenance thinking: replacing parts on a fixed schedule only helps where failures really are age-related.
Maintenance strategies
- Run to failure (reactive or breakdown maintenance) is a deliberate choice for equipment whose failure is cheap, safe and easily repaired, such as a lamp, a small redundant pump or a non-critical fan. It is a poor default for anything else.
- Preventive maintenance (PM), also called time-based or planned maintenance, services or replaces parts at fixed intervals of time, running hours or starts: oil changes, filter changes, belt replacement, overhauls. It suits failure modes that are clearly age-related.
- Predictive or condition-based maintenance (CBM) monitors the condition of the equipment and acts when the condition shows a developing failure: vibration analysis, oil analysis, thermography, ultrasound, motor current analysis, performance monitoring. It suits failure modes that give warning, which is most of them.
- Failure-finding tasks test protective devices whose failures are hidden, such as relief valves, low-water cutouts, trips and standby equipment (lesson 2).
- Redesign or elimination changes the equipment, its operation or its environment when no maintenance task can make a failure mode acceptable.
Cantwell uses all five. The instrument air compressor's oil and filters are changed on running hours; hot water pump 2 is on the monthly vibration route since its seal change in October (PWR-230); the turbine oil is sampled quarterly; the low-water cutouts and the turbine trip are tested on a schedule; and the cooling tower terminal box was moved and resealed after the September 26 trip rather than simply dried out (PWR-240).
Reliability-centered maintenance
Reliability-centered maintenance (RCM) is a structured method for choosing the right task for each failure mode, defined in standards such as SAE JA1011. It asks seven questions of each asset in its operating context:
- What are its functions and the performance standards it must meet?
- In what ways can it fail to fulfill them (functional failures)?
- What causes each functional failure (failure modes)?
- What happens when each failure occurs (failure effects)?
- In what way does each failure matter (consequences: hidden, safety, environmental, operational or non-operational)?
- What should be done to predict or prevent each failure (proactive tasks and their intervals)?
- What should be done if no suitable proactive task can be found (default actions: failure finding, redesign, or run to failure)?
The consequence category drives the decision. A failure mode with safety or environmental consequences must be reduced to a tolerable level by some task or by redesign. One with only operational or repair consequences is worth a task only if the task costs less over time than the failures it prevents. Hidden failures, which matter only when a second failure occurs, need failure-finding tasks at an interval set by the required availability of the protection. Full RCM takes time and is usually applied to the most critical systems; simpler, streamlined versions are used elsewhere.
Measuring reliability
Reliability is measured with a few standard terms. The failure rate λ is the number of failures per unit of operating time. For equipment with a constant failure rate, the mean time between failures (MTBF) is its reciprocal, and the probability of running a time t without failure, the reliability, is:
The mean time to repair (MTTR) includes the time to diagnose, obtain parts, repair and return to service. The inherent availability, the fraction of time the equipment is able to run, is:
For two identical units in parallel, where either one can carry the load, the system is unavailable only when both are down at once. If their failures are independent, the unavailability of the pair is the product of their unavailabilities. Real redundant pairs share common causes, from a shared power supply to the same wrong oil, so the true figure is worse, as it was for SIS channels in lesson 2.
Worked problem
The instrument air compressors
Cantwell's two instrument air compressors have together logged about 30,000 running hours since they were installed, with 4 failures that stopped a compressor, and an average of 12 hours from failure to return to service. Estimate the MTBF, the availability of one compressor, the availability of the pair (either one can carry the load), and the chance that one compressor runs a 30-day month (720 h) without failure.
Show solution
- \[MTBF = \frac{30{,}000}{4} = 7{,}500 \text{ h}\]
- \[A = \frac{7{,}500}{7{,}500 + 12} = 0.9984\]
- \[A_{pair} = 1 - (1 - 0.9984)^2 = 1 - 2.6 \times 10^{-6} \approx 0.999997\]
- \[R(720) = e^{-720/7{,}500} = 0.908\]
Answer: Each compressor is available about 99.84 in 100 of the time, and the pair, if independent, almost always. But there is about a 9 in 100 chance that a given compressor will fail in any month, so the standby must really be ready: Cantwell runs lead and lag alternately and tests the automatic changeover monthly. The 12-hour MTTR is short because the plant keeps a stock of the common parts; if a failure needed a part from the manufacturer, a week's wait would cut availability sharply.
Criticality
No plant can apply its best maintenance to everything. A criticality ranking scores each asset or system by the consequences of its failure (safety, environment, production or service, and cost) and by the likelihood of failure, often on a matrix like the risk matrix of PWR-340. The most critical assets get the most attention: RCM analysis, condition monitoring, spare parts held on site and priority in planning. At Cantwell the boiler feed system, the burner management systems, the main gas supply, the essential electrical bus and the district hot water pumps are at the top; the office air conditioning is near the bottom.
Criticality also guides the response to a failure. The plant's work order system gives each job a priority that reflects both the asset's criticality and the severity of the defect: an emergency that needs action now, an urgent job for the next day or two, a normal job for the planned schedule, and an opportunity job for the next outage. A clear priority scheme keeps the crew working on what matters, and stops every request from being called urgent.
The P-F interval
Most failure modes give warning. The P-F curve plots a machine's condition against time: at point P a developing failure becomes detectable by some method, such as a rise in vibration or a change in the oil; at point F the machine functionally fails. The time between them is the P-F interval, and it depends on both the failure mode and the method: vibration analysis may detect a bearing defect months before failure, while noise and heat give only days of warning.
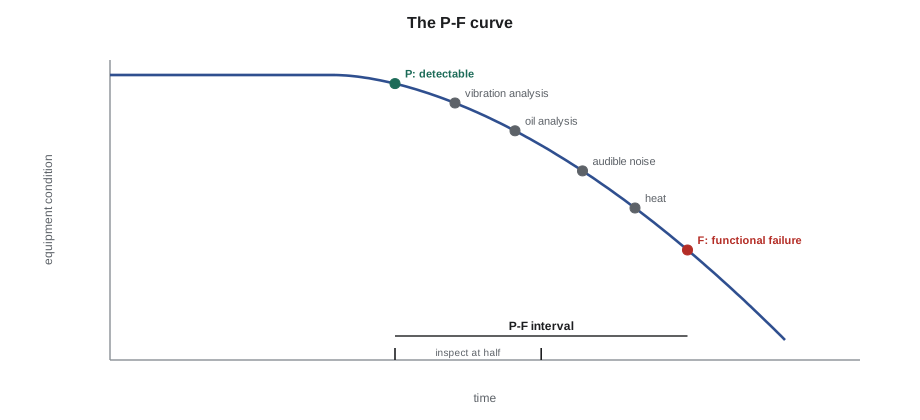
To catch a failure before it occurs, the inspection interval must be shorter than the P-F interval, and the usual rule is to inspect at no more than half of it, so that there is time to plan and carry out the repair. If a bearing defect on a pump is typically detectable by vibration about six weeks before failure, monthly vibration readings are too far apart to be safe for a critical pump; readings every two or three weeks, or continuous monitoring, are needed. Hot water pump 2's monthly route was chosen because its condition after the seal change was good and its standby is ready; if its trend begins to rise, the interval will be shortened.
Keswold's large machines have continuous monitoring, because their P-F intervals can be short and their failures expensive. The rise in bearing 3's 1X vibration on the steam turbine from 38 to 52 µm over the autumn (PWR-320) was caught on the trend long before an alarm, and the trim balance has been planned for the next short shutdown rather than forced as an emergency.
Spare parts
Spare parts are a reliability tool and a cost. Holding a spare costs its purchase price, storage, and the risk that it deteriorates or becomes obsolete on the shelf; not holding it costs the extra downtime while it is ordered, which for a critical item can be days or months. Plants classify spares by criticality and lead time: critical spares for critical equipment with long lead times, such as a spare feed pump rotating element or a large motor, are held even if they are rarely used; consumables and common parts are kept at minimum and maximum stock levels; and non-critical parts with short lead times are bought when needed. Spares need care: stored motors need their shafts turned and their windings kept dry, rubber parts age, and a spare that has never been checked may not fit.
Backlog, planning and scheduling
The backlog is the work that has been identified and approved but not yet done, usually measured in crew-weeks. A backlog of two to four weeks of ready work is healthy: the crew always has planned jobs to do. A backlog that grows steadily means the plant is finding more work than it can do, and either more resources or better strategy are needed. A very small backlog may mean the plant is not finding its problems.
Worked problem
Cantwell's backlog in crew-weeks
Fenella's crew is four people, each with about 32 productive hours a week after meetings, training, travel and breaks. The backlog is 640 hours. How many crew-weeks is it? If the crew spends 45 in 100 of its productive time on scheduled PM and condition monitoring, how many hours a week does that leave for backlog and breakdowns?
Show solution
- \[\text{Backlog} = \frac{640}{4 \times 32} = 5.0 \text{ crew-weeks}\]
- \[\text{PM time} = 0.45 \times 128 = 57.6 \text{ h/week}, \qquad \text{remaining} = 128 - 57.6 \approx 70 \text{ h/week}\]
Answer: Five crew-weeks is somewhat above the healthy range, and with only about 70 hours a week for everything else, a single bad week of breakdowns would push it higher. Grazyna's 2027 PM schedule review (PWR-230) is partly about this: removing PM tasks that do not address real failure modes, moving others to condition-based intervals, and freeing hours for the backlog.
Planning prepares each job before it reaches the crew: scope, steps, parts, tools, permits, isolations, skills and estimated hours. Scheduling decides when the planned jobs will be done, coordinating with operations so that equipment is available. Studies of maintenance productivity consistently find that unplanned work takes much longer than planned work, mostly in waiting for parts, permits and information. A Second Class engineer will often chair the weekly scheduling meeting, where operations and maintenance agree what equipment will be released and when.
Measuring the program
Common maintenance key performance indicators include: the ratio of planned to unplanned work; PM compliance, the fraction of PM tasks done on time; backlog in crew-weeks; mean time between failures of critical equipment; the number of emergency work orders; maintenance cost as a fraction of the plant's replacement value; and availability of critical systems. A good set is short, measured consistently, reviewed monthly and used to decide what to change. Two warnings apply: indicators can be gamed, such as PM compliance achieved by signing off tasks that were not done properly, and an indicator that is not used for a decision is not worth collecting.
Asset management standards such as ISO 55001 set out a management system that ties maintenance decisions to the organization's objectives, risks and life cycle costs. Few small plants are certified, but their framework, which links strategy, planning, competence, records and review, is a useful model for any plant's maintenance program.
"The best maintenance program is the one where the crew spends most of its time on planned work and the operators rarely see a breakdown," Grazyna said. "We aren't there yet. But we can see the way."
Common mistakes
MistakeReplacing parts on fixed intervals for failure modes that are not age-related.
InsteadUse condition-based tasks for failure modes that give warning.
MistakeInspecting at an interval longer than the P-F interval.
InsteadInspect at no more than about half the P-F interval.
MistakeAssuming a redundant pair is as reliable as the independent calculation shows.
InsteadAllow for common causes that can disable both units.
MistakeCalling every job urgent.
InsteadUse a priority scheme based on criticality and defect severity.
MistakeHolding no spares for critical equipment with long lead times.
InsteadHold critical spares and keep them in good condition.
MistakeCollecting KPIs that nobody uses.
InsteadChoose a few indicators that drive decisions and review them regularly.
Summary and key terms
- Most complex equipment does not wear out on a fixed schedule; age-based replacement helps only for age-related failure modes.
- Strategies include run to failure, preventive, condition-based, failure finding and redesign; RCM chooses among them for each failure mode by its consequences.
- λ = 1/MTBF, R(t) = e^(−t/MTBF), and availability = MTBF / (MTBF + MTTR); redundancy helps but common causes limit it.
- Criticality ranking directs effort and spares to the assets that matter most, and priorities keep the crew on the right work.
- The P-F interval sets condition monitoring frequency: inspect at no more than half of it.
- Backlog, planning, scheduling and a few well-used KPIs show whether the maintenance program is working.
- Reliability-centered maintenance
- A structured method for choosing maintenance tasks for each failure mode by its consequences.
- Condition-based maintenance
- Maintenance triggered by monitored signs of a developing failure.
- Failure-finding task
- A test that reveals a hidden failure of a protective device or standby unit.
- MTBF
- Mean time between failures, the average operating time between failures.
- MTTR
- Mean time to repair, from failure to return to service.
- Availability
- The fraction of time equipment is able to perform its function.
- P-F interval
- The time between a failure becoming detectable and the functional failure.
- Criticality
- A ranking of an asset by the consequences and likelihood of its failure.
- Backlog
- Identified and approved work not yet done, usually in crew-weeks.
Practice problems
Work each problem on paper first, then reveal the answer to check.
A pump has failed 3 times in 18,000 running hours with an MTTR of 8 h. Availability?
Show answer
About 0.9987.
MTBF is 5,000 h. Probability of running 1,000 h without failure?
Show answer
About 0.82.
A failure is detectable by oil analysis 8 weeks before it occurs. Maximum sampling interval?
Show answer
About 4 weeks.
A backlog of 900 h for 5 people at 30 productive h/week is how many crew-weeks?
Show answer
6.0.
Lesson quiz · 5 questions
Score 60% or more to complete this lesson.
Create a free account to save your progress, take quizzes and earn a certificate.