
PWR-310 · Lesson 6 of 12 · 28 min
Steam tables and Mollier diagrams
▶ Video coming soon A video version of this lesson is on the way.
On Friday, September 4, 2026, Okonkwo Demarest's last day shift of the summer, the shift engineer, Pilar Quenneville, took a framed chart down from the wall of the control room office and laid it on the desk. It was an old Mollier diagram, enthalpy against entropy for steam, yellowed at the edges, with pencil lines drawn on it years before by someone working out the backup feed pump turbine. "Nobody uses these on shift any more," she said. "The control system has the steam properties built in, and so does every phone. But the examiners still hand you tables and a chart, and you still need to see what the numbers mean. Find me that turbine on here."
This lesson covers the two classic tools for steam properties. The steam tables give accurate values at listed pressures and temperatures, and the Mollier diagram shows the same data as a chart on which turbine expansions and throttling processes can be read at a glance. Both now come from the same source: the IAPWS-IF97 industrial formulation of the International Association for the Properties of Water and Steam, the set of equations behind modern printed tables, plant control systems and engineering software. The worked values in this course were calculated from those equations.
How the tables are organized
Steam tables are arranged in three main groups, and the first step with any problem is to decide which one applies.
- Saturated tables, one ordered by temperature and one by pressure, give the properties of saturated liquid and saturated vapor at each saturation state: the pressure and temperature, the specific volumes v_f and v_g, the enthalpies h_f, h_fg and h_g, the entropies s_f, s_fg and s_g, and usually the internal energies.
- Superheated tables give v, h and s (and often u) at a grid of pressures and temperatures above saturation. Each pressure heading also shows its saturation temperature.
- Compressed liquid tables give properties of water at pressures above its saturation pressure. Below a few megapascals the correction is small, and the saturated liquid values at the same temperature are used instead.
The subscript f refers to the saturated liquid, g to saturated vapor, and fg to the change between them, so h_fg = h_g − h_f is the latent heat of evaporation. All the tables measure internal energy and entropy from zero for saturated liquid at the triple point, 0.01 °C or 32.018 °F; enthalpies and entropies from different tables agree because they share that reference, though the last digit can differ between editions and formulations. Use the tables supplied with an examination, not values remembered from another book.
Pressures in the tables are absolute. Many errors in steam problems start with a gauge pressure taken straight into the table. Cantwell's header at 150 psig is 164.7 psia.
Deciding the phase
Given a pressure and one other property, compare it with the saturation values at that pressure:
- If the temperature is below the saturation temperature, or the enthalpy below h_f, the water is a compressed (or subcooled) liquid.
- If the temperature equals the saturation temperature and the enthalpy lies between h_f and h_g, it is a wet mixture, and the dryness fraction fixes the state.
- If the temperature is above the saturation temperature, or the enthalpy above h_g, it is superheated. The degree of superheat is the actual temperature minus the saturation temperature.
Wet steam
A wet mixture with dryness fraction x contains x kilograms (or pounds) of vapor and 1 − x of liquid in each unit of mass. Its properties are weighted averages of the liquid and vapor values:
The approximation for v is close at low and moderate pressures, because v_f is tiny compared with v_g, but not near the critical point. The same formulas run backward give the dryness from a known enthalpy or entropy, which is how the calorimeter of lesson 4 and the turbine exhaust of lesson 5 were found.
Worked problem
Properties of slightly wet header steam
Steam in Cantwell's header at 164.7 psia has a dryness fraction of 0.96. At that pressure h_f = 338.6, h_fg = 857.4 Btu/lb; s_f = 0.5237, s_fg = 1.0386 Btu/lb·°R; v_f = 0.01818 and v_g = 2.757 ft³/lb. Find h, s and v.
Show solution
- Enthalpy:
- \[h = 338.6 + 0.96 \times 857.4 = 1{,}161.7 \text{ Btu/lb}\]
- Entropy:
- \[s = 0.5237 + 0.96 \times 1.0386 = 1.5208 \text{ Btu/lb·°R}\]
- Specific volume:
- \[v = 0.01818 + 0.96 \times (2.757 - 0.01818) = 2.647 \text{ ft}^3\text{/lb}\]
Answer: Each pound carries 34 Btu less than dry saturated steam, about 3 in 100 less useful heat, and 0.04 lb of water that does nothing useful in a heating coil and erodes valve seats and fittings at high velocity.
Superheated steam and interpolation
Superheated tables list properties at round values of pressure and temperature. A state between the listed values is found by linear interpolation: assume the property varies in a straight line between the two nearest entries. For a value of x between x₁ and x₂, with known y₁ and y₂:
When the state falls between both listed pressures and listed temperatures, interpolate twice at each pressure for the temperature, then once between the two results for the pressure, a double interpolation. Keep the working in a small table; it is easy to lose track of which value is which.
Worked problem
Interpolating between pressures
Find the enthalpy and specific volume of steam at 150 psia and 500 °F, given that at 500 °F the values are h = 1,275.3 Btu/lb and v = 3.952 ft³/lb at 140 psia, and h = 1,273.3 Btu/lb and v = 3.441 ft³/lb at 160 psia.
Show solution
- 150 psia is halfway between the listed pressures, so the fraction is 0.5:
- \[h = 1{,}275.3 + 0.5 \times (1{,}273.3 - 1{,}275.3) = 1{,}274.3 \text{ Btu/lb}\]
- Specific volume:
- \[v = 3.952 + 0.5 \times (3.441 - 3.952) = 3.697 \text{ ft}^3\text{/lb}\]
Answer: The IF97 equations give h = 1,274.3 Btu/lb, matching the interpolation, but v = 3.680 ft³/lb, about 0.5 in 100 lower. Enthalpy changes almost linearly with pressure at constant temperature, but specific volume varies roughly inversely with pressure, so straight-line interpolation of v over a wide step overestimates it. For examination answers linear interpolation is expected; for design work, use finer tables or the equations.
Specific volume and steam velocity
Specific volume turns a mass flow into a volume flow, and a volume flow through a pipe area gives a velocity. Steam lines are sized on velocity: too high and they are noisy, erode fittings and lose pressure; too low and they are bigger and costlier than needed. Typical design velocities for saturated steam mains are around 5,000 to 8,000 ft/min; these are rules of thumb, not code limits.
Worked problem
Velocity in a boiler outlet line
Boiler 1 delivers 24,950 lb/h of dry saturated steam at 164.7 psia (v_g = 2.757 ft³/lb) into an NPS 8 Schedule 40 line with an inside diameter of 7.981 in. Find the steam velocity.
Show solution
- Volume flow:
- \[\dot{V} = \frac{24{,}950}{3{,}600} \times 2.757 = 19.1 \text{ ft}^3\text{/s}\]
- Pipe area:
- \[A = \frac{\pi \times (7.981/12)^2}{4} = 0.3474 \text{ ft}^2\]
- Velocity:
- \[V = \frac{19.1}{0.3474} = 55.0 \text{ ft/s} = 3{,}300 \text{ ft/min}\]
Answer: Comfortably low at full load. The same pipe at a much lower pressure would carry the same mass at a far higher velocity, because the specific volume rises as pressure falls; that is why low-pressure steam lines are much larger than high-pressure ones.
The Mollier diagram
The Mollier diagram plots specific enthalpy (vertically) against specific entropy (horizontally). Its value is that the two processes an operator meets most often are straight lines on it: an isentropic expansion is a vertical line, and a throttling process, at constant enthalpy, is a horizontal line. Enthalpy differences, the work and heat of the steady flow energy equation, are read directly as vertical distances.
The chart covers the superheated region and the wetter part of the two-phase region, where turbine expansions end. Its main features are:
- The saturation line, a curve across the chart, separating superheated steam above from wet steam below.
- Constant pressure lines, which slope steeply up to the right. In the wet region they are straight; above the saturation line they curve upward.
- Constant temperature lines in the superheat region, which start where each pressure line crosses saturation and flatten toward horizontal at low pressure, where steam behaves more like an ideal gas whose enthalpy depends only on temperature.
- Constant dryness lines below the saturation line, roughly parallel to it, marked 0.95, 0.90, 0.85 and so on.
- Constant superheat lines are shown on some charts instead of, or as well as, temperature lines.
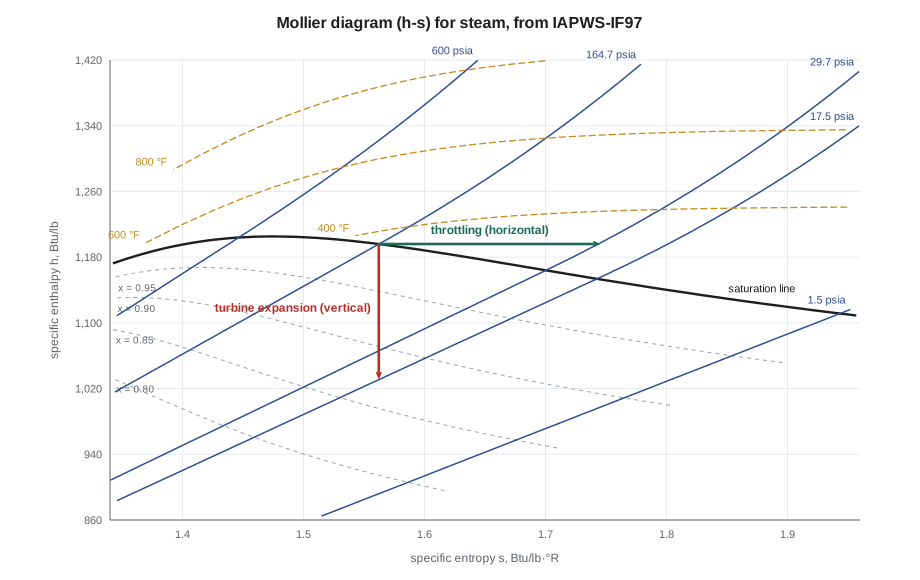
A chart is read to about three significant figures, less than the tables give. Its strength is speed and insight: an expansion line that ends in the wet region shows at once how wet the exhaust will be, and a throttling line shows how much superheat a pressure reducing valve will produce.
The backup feed pump turbine on the chart
Okonkwo found the pencil line on Pilar's chart where he expected it: a short vertical line dropping from the saturation curve at header pressure to the deaerator pressure line. He checked it against the tables, the way the examiners would want.
Worked problem
Isentropic expansion through the backup turbine
Steam enters the backup feed pump turbine dry saturated at 164.7 psia (h_g = 1,196.0 Btu/lb, s_g = 1.5623 Btu/lb·°R) and exhausts to the deaerator at 17.5 psia (h_f = 189.2, h_fg = 964.5 Btu/lb; s_f = 0.3254, s_fg = 1.4171 Btu/lb·°R). Find the isentropic exhaust state, then the actual exhaust state for the turbine's isentropic efficiency of 0.45.
Show solution
- Isentropic dryness:
- \[x_{2s} = \frac{1.5623 - 0.3254}{1.4171} = 0.873\]
- Isentropic enthalpy and drop:
- \[h_{2s} = 189.2 + 0.873 \times 964.5 = 1{,}030.9, \quad \Delta h_s = 165.1 \text{ Btu/lb}\]
- Actual drop and exhaust enthalpy:
- \[\Delta h = 0.45 \times 165.1 = 74.3, \quad h_2 = 1{,}196.0 - 74.3 = 1{,}121.7 \text{ Btu/lb}\]
- Actual exhaust dryness:
- \[x_2 = \frac{1{,}121.7 - 189.2}{964.5} = 0.967\]
Answer: The chart's vertical line ends near 1,031 Btu/lb at about 0.87 dry, matching the tables within the accuracy of reading. PWR-230 worked the same turbine from printed table values and got the same answer to within about half a Btu. On the chart, the actual end point lies on the same pressure line but higher up, at 1,122 Btu/lb and 0.967 dry; the line from inlet to actual exhaust slopes to the right, showing the entropy the losses created.
Throttling on the chart
Pilar's second question was about the customers. Most of Cantwell's 26 customer buildings drop the steam pressure at their entrance through a pressure reducing station, often to about 15 psig for heating. What state does the steam reach the heating coils in?
Worked problem
Superheat produced by a pressure reducing valve
Dry saturated steam at 164.7 psia (h = 1,196.0 Btu/lb) is throttled to 29.7 psia, where the saturation temperature is 249.7 °F and h_g = 1,163.9 Btu/lb. Find the temperature and degree of superheat after the valve. At 29.7 psia, superheated steam at 313 °F has h ≈ 1,195.8 Btu/lb.
Show solution
- Throttling keeps h = 1,196.0 Btu/lb. Since this is above h_g at 29.7 psia, the steam is superheated.
- From the superheat values, h = 1,196.0 Btu/lb at 29.7 psia corresponds to about 313 °F.
- Degree of superheat:
- \[313 - 249.7 \approx 64 \text{ °F}\]
Answer: About 64 °F of superheat. On the Mollier chart it is a horizontal line from the saturation curve at 164.7 psia to the 29.7 psia line, crossing into the superheat region. Even steam that was 97 in 100 dry in the main (h = 1,170 Btu/lb) would leave the valve slightly superheated. A heat exchanger downstream sees steam that must lose its small superheat before it condenses, which is why heating coils are rated on the saturation temperature at their inlet pressure and the superheat is usually ignored.
Tables, charts and software
On shift and in design, steam properties now come from software built on IAPWS-IF97, and a plant's control system calculates enthalpies and flows from it continuously. The equations reproduce the printed tables to their last digit and avoid interpolation errors. Examinations still use printed tables and charts, and they still matter: a figure from a program is only as good as the inputs typed into it, and an operator who has worked the tables by hand knows when a displayed enthalpy, a steam flow or a computed efficiency cannot be right.
Pilar hung the chart back on the wall. Okonkwo took a photocopy for his binder, with his own pencil lines added: the vertical turbine line, the horizontal line from the header to a customer's reduced pressure, and, as Pilar suggested, the expansion from Grazyna's condensing plant in lesson 5, which ran right off the bottom of the old chart.
Common mistakes
MistakeEntering the steam tables with gauge pressure.
InsteadConvert to absolute pressure first; the tables are in absolute units.
MistakeUsing h_g for wet steam.
InsteadWet steam has h = h_f + x h_fg; dry saturated steam is the special case x = 1.
MistakeInterpolating specific volume linearly over a wide pressure step and treating the result as exact.
InsteadVolume varies roughly inversely with pressure; linear interpolation over a wide step overestimates it slightly.
MistakeDrawing a throttling process as a vertical line on the Mollier chart.
InsteadThrottling is at constant enthalpy, a horizontal line; isentropic expansion is vertical.
MistakeExpecting steam to be wet after a pressure reducing valve because it was saturated before.
InsteadThrottling dry or nearly dry saturated steam to a lower pressure usually leaves it superheated.
Summary and key terms
- Steam tables are saturated (by temperature and by pressure), superheated and compressed liquid; all pressures are absolute.
- Compare the given property with the saturation values to decide whether the state is compressed, wet or superheated.
- Wet steam properties are weighted by dryness: h = h_f + x h_fg, s = s_f + x s_fg, v ≈ x v_g.
- Linear interpolation, sometimes double, finds values between table entries.
- On the Mollier diagram isentropic expansion is vertical and throttling is horizontal; enthalpy differences are read as vertical distances.
- IAPWS-IF97 is the formulation behind modern tables, charts and software.
- Saturation temperature
- The temperature at which water boils at a given pressure.
- Latent heat of evaporation
- The enthalpy change h_fg needed to turn saturated liquid into saturated vapor at constant pressure.
- Degree of superheat
- The amount by which the temperature of superheated steam exceeds the saturation temperature at its pressure.
- Compressed liquid
- Water at a temperature below the saturation temperature for its pressure.
- Interpolation
- Estimating a value between two tabulated entries by assuming a straight-line variation between them.
- Mollier diagram
- A chart of enthalpy against entropy for steam, used for expansions and throttling.
- IAPWS-IF97
- The industrial formulation of the properties of water and steam adopted by the International Association for the Properties of Water and Steam in 1997.
Practice problems
Work each problem on paper first, then reveal the answer to check.
Steam at 70 psia has h = 1,120 Btu/lb. At 70 psia, h_f = 272.8 and h_fg = 908.0 Btu/lb. Find its dryness.
Show answer
x = (1,120 − 272.8) ÷ 908.0 = 0.933.
Steam at 150 psia is at 500 °F. The saturation temperature at 150 psia is 358.4 °F. What is its state and degree of superheat?
Show answer
Superheated by 500 − 358.4 = 141.6 °F.
At 600 °F, h = 1,326.6 Btu/lb at 140 psia and 1,323.8 Btu/lb at 180 psia. Interpolate for 150 psia.
Show answer
1,326.6 + 0.25 × (−2.8) = 1,325.9 Btu/lb.
Water at 300 psia and 300 °F: what phase is it, given T_sat = 417.4 °F at 300 psia?
Show answer
Compressed liquid; use h_f at 300 °F, about 270 Btu/lb.
Lesson quiz · 5 questions
Score 60% or more to complete this lesson.
Create a free account to save your progress, take quizzes and earn a certificate.