
NET-103 · Lesson 9 of 12 · 28 min
Logs, monitoring and troubleshooting
▶ Video coming soon A video version of this lesson is on the way.
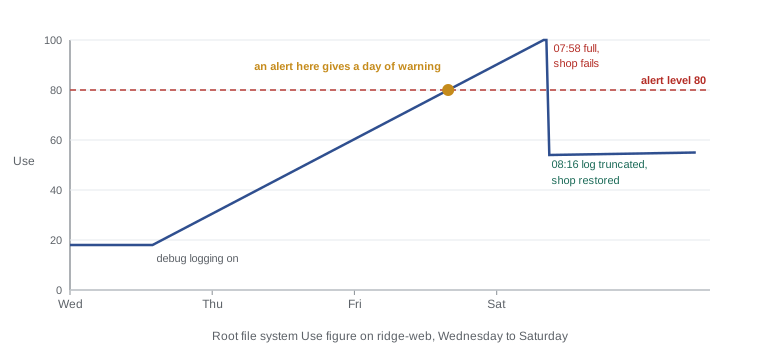
At 08:05 on a Saturday in November, Rosa texted Sam: the shop was showing an error page, and Saturday morning is when the week's biggest orders arrive. Sam was out, so Jordan logged in. Within ten minutes he had found the cause, a disk filled by a single runaway log file, freed space, brought the shop back and set up a rule so that it could not happen again. He could do it because Linux records almost everything that happens in logs, and because he knew where to look and which commands summarize a server's health. This lesson follows that morning, and teaches the logging and monitoring tools behind it.
It covers where Linux keeps its logs, the systemd journal and journalctl, the traditional log files and their priorities, log rotation, the commands that show a server's health at a glance, the basics of continuous monitoring, and a method for troubleshooting that works for problems you have never seen before.
Where logs live
Linux has two logging systems that usually run side by side. The systemd journal collects messages from the kernel, from every service systemd starts and from programs that use the standard logging interface, and stores them in a structured binary format under /var/log/journal. The traditional syslog service, rsyslog on Ubuntu, receives the same messages and writes them to plain text files in /var/log, sorted by kind. Many applications also write their own log files, usually under /var/log in a directory of their own.
| Log | What it records |
|---|---|
| journalctl (the journal) | Everything from the kernel and services, searchable by service, time and priority |
| /var/log/syslog | General system messages (on Debian and Ubuntu; RHEL uses /var/log/messages) |
| /var/log/auth.log | Logins, SSH, sudo and other authentication events (RHEL: /var/log/secure) |
| /var/log/kern.log | Kernel messages, including hardware and disk errors |
| /var/log/apt/history.log | Every package installed, upgraded or removed, with the command used |
| /var/log/nginx/access.log and error.log | Every web request, and web server errors |
| /var/log/postgresql/ | Database server messages |
| /var/log/ridgeline/ | The shop application's own logs |
Each message has a priority, a number from 0 to 7 inherited from the original syslog design of the 1980s, and a facility, which says what kind of program sent it. Knowing the priorities lets you filter out routine chatter and see only what matters.
| Number | Name | Meaning |
|---|---|---|
| 0 | emerg | The system is unusable |
| 1 | alert | Action must be taken immediately |
| 2 | crit | Critical conditions, such as hardware failure |
| 3 | err | Errors |
| 4 | warning | Something unusual that may become a problem |
| 5 | notice | Normal but significant events |
| 6 | info | Routine information |
| 7 | debug | Detail for developers, usually switched off |
The journal and journalctl
The journalctl command reads the journal. On its own it shows every message since records began, oldest first, which is rarely what you want; its options narrow the view by service, time, priority and boot. Members of the adm or systemd-journal groups, and sudo users, can read the whole journal.
| Command | Shows |
|---|---|
| journalctl -u ridgeline-shop | Messages from one service |
| journalctl -u nginx --since "2026-11-07 07:30" --until "08:30" | One service in a time window |
| journalctl -p err -b | Errors and worse since the current boot |
| journalctl -b -1 | Everything from the previous boot, useful after a crash |
| journalctl -k | Kernel messages, the same as dmesg |
| journalctl -f -u ridgeline-shop | Follow new messages live, like tail -f |
| journalctl -e | Jump to the end of the journal |
| journalctl --disk-usage | How much space the journal uses |
> journalctl -u ridgeline-shop -p err --since today
Nov 07 07:58:31 ridge-web gunicorn[1391]: OSError: [Errno 28] No space left on device: '/var/log/ridgeline/shop-debug.log'
Nov 07 07:58:31 ridge-web gunicorn[1391]: [ERROR] Exception in worker process
Nov 07 07:58:32 ridge-web systemd[1]: ridgeline-shop.service: Main process exited, code=exited, status=1/FAILURE
Nov 07 07:58:32 ridge-web systemd[1]: ridgeline-shop.service: Failed with result 'exit-code'.
Nov 07 07:58:37 ridge-web systemd[1]: ridgeline-shop.service: Scheduled restart job, restart counter is at 1.
The first error line names the problem precisely: Errno 28, no space left on device, while writing to a debug log. The following lines show systemd doing its job, restarting the service five seconds after each failure as the unit file asked, but every restart failed for the same reason. Starting with the failing service's errors, rather than reading logs from the top, is what turned a potentially long investigation into a short one.
Following the clue
The error pointed at storage, so the next commands were df and du from lesson 7, followed by a look at the file itself.
> df -h /var/log /srv
Filesystem      Size  Used Avail Use% Mounted on
/dev/vda2        78G   78G     0 100% /
/dev/vdb1        98G   41G   53G  44% /srv
> sudo du -sh /var/log/* 2>/dev/null | sort -h | tail -n 3
412M    /var/log/journal
1.1G    /var/log/nginx
38G     /var/log/ridgeline
> ls -lh /var/log/ridgeline/
-rw-r----- 1 shop adm 38G Nov  7 07:58 shop-debug.log
-rw-r----- 1 shop adm 21M Nov  7 07:58 shop.log
A developer had switched on debug logging while testing a new checkout page on Wednesday and forgotten to switch it off, and nothing was rotating the file. Three days of logging every database query had filled the root file system. Note that /srv, where Ridgeline's data lives, was fine: the problem was on the system disk, because the shop writes its logs to /var/log.
There is a trap here that catches many administrators. If you delete a file that a process still has open, the name disappears but the space is not freed until the process closes the file, because the data is still in use. So rm shop-debug.log would have left the disk full while the shop kept running. Jordan instead emptied the file in place with truncate, which keeps it open but releases the space, and only then turned off debug logging.
> sudo truncate -s 0 /var/log/ridgeline/shop-debug.log
> df -h /
Filesystem      Size  Used Avail Use% Mounted on
/dev/vda2        78G   40G   35G  54% /
> sudo lsof +L1 | head -n 3
COMMAND   PID USER  FD  TYPE DEVICE SIZE/OFF NLINK  NODE NAME
> sudo sed -i 's/^LOG_LEVEL=DEBUG/LOG_LEVEL=INFO/' /etc/ridgeline/shop.env
> sudo systemctl restart ridgeline-shop
> curl -s -o /dev/null -w "%{http_code}\n" https://shop.ridgeline.example/
200
The command lsof +L1 lists open files whose link count is zero, meaning deleted but still open. It came back empty, so no hidden space was being held. The curl command at the end prints only the HTTP status code, and 200 confirmed the shop was back at 08:16, eleven minutes after Rosa's text. Jordan posted a short note to Rosa and Sam: what happened, what he did, and what still needed fixing.
Log rotation
Logs grow forever unless something trims them. On Ubuntu, logrotate runs daily from a systemd timer and handles this for every file it has a rule for: it renames the current log, starts a fresh one, compresses old ones and deletes the oldest. Packages install their own rules in /etc/logrotate.d, which is why nginx's and PostgreSQL's logs never caused trouble. The shop's logs had no rule because nobody had written one. The fix, the real cure rather than the emergency truncate, was a rule of a few lines.
# /etc/logrotate.d/ridgeline
/var/log/ridgeline/*.log {
    daily
    rotate 14
    maxsize 500M
    compress
    delaycompress
    missingok
    notifempty
    copytruncate
    su shop adm
}
Each setting has a purpose. daily and rotate 14 keep two weeks of logs. maxsize 500M rotates a file early if it grows past 500 MB, even mid-day, which would have caught the debug log on Wednesday. compress and delaycompress gzip old logs but leave yesterday's uncompressed for easy reading. copytruncate copies the log and then empties it in place, the same technique as the emergency fix, for applications that keep their log file open. Testing the rule with sudo logrotate --debug /etc/logrotate.d/ridgeline shows what it would do without doing it. The journal has its own limits, set with SystemMaxUse in /etc/systemd/journald.conf.
A server's health at a glance
Beyond logs, a few commands show the current state of a server. Running them in sequence takes under a minute and answers most first questions about a slow or troubled machine.
| Command | What it tells you |
|---|---|
| uptime | Time since boot and the load average over 1, 5 and 15 minutes |
| free -h | Memory and swap in use; the available column is what matters |
| df -h and df -i | Space and inodes on each file system |
| top or htop | The busiest processes, live |
| vmstat 5 | Processor, memory, swapping and disk activity every five seconds |
| iostat -x 5 | Per-disk activity and wait times (from the sysstat package) |
| ss -s | A summary of network connections |
| systemctl --failed | Any failed services |
| journalctl -p err -b | Errors since boot |
The load average is the average number of processes running or waiting to run, including those waiting for disk. It should be read against the number of processors: on ridge-web, with two virtual processors, a load of 2 means the processors are fully busy, and a load that stays well above 2 means work is queuing. A high load with low processor use usually means processes are waiting for slow storage. In free's output, Linux uses spare memory as a disk cache, so used memory always looks high; the available column shows how much programs could actually use.
def load_report(uptime_line, cpus):
    loads = uptime_line.split("load average:")[1].split(",")
    one, five, fifteen = (float(x) for x in loads)
    status = "ok"
    if five > cpus:
        status = "overloaded"
    elif five > 0.7 * cpus:
        status = "busy"
    trend = "rising" if one > fifteen * 1.2 else "falling" if one < fifteen * 0.8 else "steady"
    return f"5-min load {five} on {cpus} CPUs: {status}, {trend}"

print(load_report(" 09:20:41 up 3 days,  2:11,  1 user,  load average: 0.02, 0.05, 0.01", 2))
print(load_report(" 08:01:02 up 9 days,  1:03,  2 users,  load average: 3.91, 2.62, 0.88", 2))
print(load_report(" 13:40:10 up 9 days, 6:42, 1 user, load average: 1.10, 1.52, 1.95", 2))5-min load 0.05 on 2 CPUs: ok, rising 5-min load 2.62 on 2 CPUs: overloaded, rising 5-min load 1.52 on 2 CPUs: busy, falling
Continuous monitoring and alerting
Jordan found the Saturday problem quickly, but only after customers had already seen the error page. Monitoring turns that around: a program checks the server constantly and alerts someone as soon as a value crosses a threshold, ideally before customers notice. For a small business, a few checks cover most risks: is the shop's home page answering, is any file system's Use figure above 80, are any services failed, is the load or memory unusual, and are backups recent.
Tools range from simple to elaborate. An external uptime service checks the shop's address every minute from the internet and sends a text if it fails, which catches network and DNS problems as well as server ones. On the server, Prometheus with its node exporter collects metrics such as disk, memory and processor use, Grafana draws dashboards from them, and Alertmanager sends alerts; Netdata and Zabbix are popular all-in-one alternatives. Cloud providers offer their own monitoring too. Sam sets Ridgeline up with an external uptime check and a small script, written in lesson 11, that emails Jordan when a disk's Use figure passes 80 or a service fails.
Who did what? Reading auth.log
The authentication log answers questions about access: who logged in, from where, who used sudo and what for, and who tried and failed. On any server reachable from the internet it also shows a constant background of automated attempts to guess SSH passwords. Monday's review of ridge-web's auth.log found thousands of them.
> sudo grep "Failed password" /var/log/auth.log | tail -n 3
Nov  9 03:12:44 ridge-web sshd[20211]: Failed password for root from 192.0.2.201 port 51022 ssh2
Nov  9 03:12:47 ridge-web sshd[20213]: Failed password for invalid user admin from 192.0.2.201 port 51040 ssh2
Nov  9 03:13:02 ridge-web sshd[20220]: Failed password for invalid user oracle from 203.0.113.140 port 40112 ssh2
> sudo grep "sudo:" /var/log/auth.log | grep COMMAND | tail -n 2
Nov  9 09:31:10 ridge-web sudo:   jordan : TTY=pts/0 ; PWD=/home/jordan ; USER=root ; COMMAND=/usr/bin/apt update
Nov  9 09:33:52 ridge-web sudo:   jordan : TTY=pts/0 ; PWD=/home/jordan ; USER=root ; COMMAND=/usr/bin/systemctl restart nginx
The failed attempts are a reason to act, not to panic. With the firewall from lesson 8 only allowing SSH from the office and the roastery, these attempts came from the brief window before ufw was enabled; fail2ban, which bans addresses after repeated failures, and key-only logins in lesson 10 close the door completely. The sudo lines show the audit trail: every privileged command, with the user, directory and full command line. Counting failed attempts by address is a classic first script for a new administrator.
A troubleshooting method
Every problem is different, but a consistent method works for problems you have never met. First, define the symptom precisely: what fails, for whom, since when, and what changed recently. Second, check the obvious, because most outages have dull causes: is the service running, is a disk full, did an update or configuration change happen just before? Third, read the logs for the failing component, errors first, around the time the trouble started. Fourth, form one hypothesis, test it with one change, and observe; changing several things at once leaves you not knowing which one worked. Finally, write down what happened and fix the underlying cause, not just the symptom, so it does not return.
Worked problem
Writing up the Saturday incident
Sam asks Jordan for a short incident report that Rosa can read and that will help prevent repeats. What should it contain?
Show solution
- Summary: the shop was unavailable from 07:58 to 08:16 on Saturday 7 November, about 18 minutes, during the busiest time of the week.
- Cause: debug logging left on after testing on Wednesday filled the root file system with a 38 GB log, and the shop's logs had no rotation rule.
- Detection: Rosa noticed the error page; no monitoring alerted anyone.
- Resolution: truncated the log, switched the log level back to INFO, restarted the shop and confirmed with curl.
- Follow-up actions with owners: logrotate rule with maxsize (Jordan, done), disk and uptime alerts (Sam, Monday), a checklist step to switch off debug logging after testing (developer), and a separate /var/log volume to consider later.
- Tone: blameless, describing what the system allowed to happen rather than blaming the developer, so that people report mistakes freely.
Answer: A blameless report with timeline, cause, detection, fix and owned follow-up actions.
Try it yourself
Count failed SSH logins
Write failed_by_address(log_text) that finds every line in an auth.log containing Failed password and returns a dictionary mapping each source address (the word after from) to the number of failures.
def failed_by_address(log_text):
    counts = {}
    return counts
Try it yourself
Only the serious messages
Journal lines exported for analysis start with a priority number in angle brackets, such as <3> for err. Write serious(lines, worst=3) that returns the messages (the text after the closing bracket, stripped) whose priority number is less than or equal to worst, keeping their order.
def serious(lines, worst=3):
    return lines
Try it yourself
Is the server overloaded?
Write load_status(uptime_line, cpus) that reads the 5-minute load average from a line of uptime output and returns overloaded if it is greater than cpus, busy if it is greater than 0.7 times cpus, and ok otherwise.
def load_status(uptime_line, cpus):
    return 'ok'
Common mistakes
MistakeReading logs from the top and getting lost.
InsteadFilter first: the failing service, errors and worse, around the time the trouble began.
MistakeDeleting a large log that a process still has open.
InsteadTruncate it in place, or restart the process; deleted-but-open files keep using space.
MistakeFixing the symptom and moving on.
InsteadFind and fix the cause, such as a missing logrotate rule, and write it down.
MistakeJudging the load average without considering the number of processors.
InsteadCompare the load with the CPU count; 2 is full on a two-processor machine.
MistakeTreating high used memory in free as a problem.
InsteadLook at the available column; Linux uses spare memory for disk caching.
MistakeRelying on customers to report outages.
InsteadSet up uptime checks and alerts for disks, services and backups.
Summary and key terms
- Logs go to the systemd journal and to text files in /var/log, such as syslog and auth.log; applications often keep their own.
- Priorities run from 0 (emerg) to 7 (debug); filter by priority to see what matters.
- journalctl filters the journal by service (-u), priority (-p), time (--since) and boot (-b), and follows it with -f.
- Deleting an open log does not free space; truncate it instead, and use lsof +L1 to find hidden deleted files.
- logrotate rules in /etc/logrotate.d rotate, compress and delete logs; every application log needs one.
- uptime, free, df, top, vmstat and systemctl --failed give a quick health check; read the load against the CPU count.
- Monitoring and alerting catch problems before customers do.
- Troubleshoot methodically: define the symptom, check the obvious, read the logs, change one thing at a time, then fix the cause and write it up.
- systemd journal
- The structured log store that collects messages from the kernel and services.
- journalctl
- The command that reads and filters the systemd journal.
- rsyslog
- The service that writes traditional text log files in /var/log.
- priority
- A syslog severity level from 0 (emerg) to 7 (debug).
- log rotation
- Regularly renaming, compressing and deleting old log files.
- load average
- The average number of processes running or waiting to run over 1, 5 and 15 minutes.
- monitoring
- Continuously measuring a system's health and availability.
- alerting
- Notifying people automatically when a measurement crosses a threshold.
- incident report
- A written account of an outage: timeline, cause, fix and follow-up actions.
Practice problems
Work each problem on paper first, then reveal the answer to check.
Write a journalctl command showing errors and worse from nginx since 06:00 today.
Show answer
journalctl -u nginx -p err --since 06:00
On a four-processor server the 15-minute load average is 3.2. Is it overloaded?
Show answer
No, but it is busy: 3.2 is below 4 processors, though above 0.7 times 4.
After deleting a 10 GB log, df still shows the disk full. Why, and what do you do?
Show answer
A process still has the file open; restart that process or truncate through /proc, and next time truncate instead of deleting.
Which logrotate setting rotates a file early when it gets too big?
Show answer
maxsize, for example maxsize 500M.
Where would you look to see who ran sudo commands yesterday?
Show answer
/var/log/auth.log (or journalctl with _COMM=sudo).
Name two things an external uptime check catches that a check on the server cannot.
Show answer
DNS failures and network or provider outages, because the server cannot report when it is unreachable.
Lesson quiz · 5 questions
Score 60% or more to complete this lesson.
Create a free account to save your progress, take quizzes and earn a certificate.