
MSAZ-102 · Lesson 2 of 12 · 18 min
The pricing and total cost of ownership calculators
▶ Video coming soon A video version of this lesson is on the way.
Dana Whitcombe's question about the October invoice had a second half. "Fine, I understand why October was high," she told Renata a few days later. "But the board approved Skylight on a business case that said Azure would cost less than replacing the SAN and the server room. I need to know that is still true, and I need a monthly number I can put in next year's budget." Those are two different questions. The first is about total cost of ownership: is running the workloads in Azure cheaper over several years than running them on premises? The second is about an estimate: what will a specific set of Azure resources cost each month? Microsoft provides tools for both, and Theo spent the last week of October learning to use them properly.
The Azure pricing calculator
The Azure pricing calculator is a free web tool for estimating what Azure resources will cost. You do not need an Azure subscription to use it. You choose products from a list of Azure services, add them to an estimate, and configure each one: the region, the tier or size, the number of instances, the hours per month, the storage capacity and redundancy, the expected data transfer and any licensing options. The calculator multiplies the published rates by your inputs and shows a monthly total for each item and for the whole estimate.
The calculator models the cost factors from the previous lesson directly. For a virtual machine, you pick the region, the operating system, the size and the number of hours, then choose between pay-as-you-go, a savings plan or a one- or three-year reservation, and whether Azure Hybrid Benefit applies. For storage, you pick the redundancy, the access tier, the capacity and the expected number of operations. For networking, you enter the gigabytes of outbound data transfer. Changing any one input shows immediately how much that factor matters, which makes the calculator a useful teaching tool as well as an estimating tool.
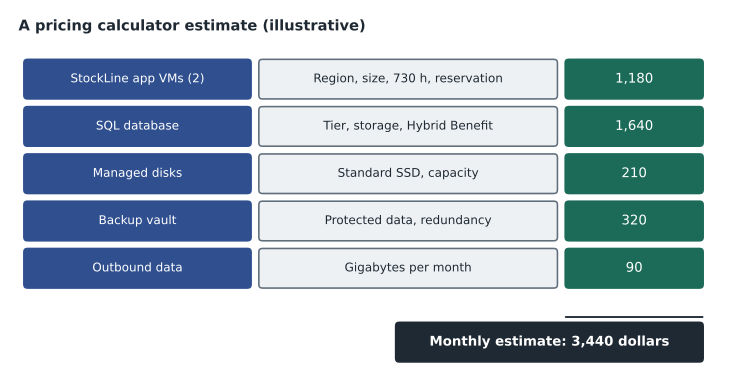
Estimates can be saved, named, duplicated, shared through a link and exported to a spreadsheet. Theo built one estimate called StockLine production with the application servers, the database, the backup vault, the disks and the expected outbound data. He then copied it as StockLine production with reservations so that Dana could see both versions side by side. He built a third for the nonproduction environment with business-hours schedules on every VM.
The calculator also offers settings for the whole estimate: the currency, which is US dollars for Harrow & Finch, the support plan to include, and whether to show dev/test pricing. Customers with certain agreements who sign in may be able to see prices closer to their own negotiated rates; the public prices are shown otherwise. Either way, the result is an estimate, not a quote. Actual invoices depend on what is actually deployed and how it is used.
| Calculator input | What it represents | Effect on the estimate |
|---|---|---|
| Region | Where the resource runs | Prices differ by region |
| Tier or size | How much capacity or performance | Usually the biggest single factor |
| Hours per month | How long it runs | Schedules can cut compute costs |
| Savings option | Pay-as-you-go, savings plan or reservation | Commitment lowers the rate |
| Licensing | Included license or Azure Hybrid Benefit | Hybrid Benefit removes license cost |
| Data transfer | Gigabytes leaving Azure | Outbound transfer adds cost |
| Support plan | Level of Microsoft support | Adds a plan charge |
Making an estimate realistic
An estimate is only as good as its inputs. Renata had seen many cloud projects fail their budgets not because the calculator was wrong but because the estimate left things out. She gave Theo a checklist. First, include everything that runs, not only the obvious servers: disks, backup storage, the VPN gateway, public IP addresses, monitoring data, Key Vault operations and so on. Second, size from measurements, not from the size of the old hardware; a server bought five years ago with sixteen cores may use four. Third, include data transfer, especially anything that leaves Azure regularly. Fourth, separate production from nonproduction, because their schedules and purchase options differ. Fifth, add a margin for growth and for things nobody has thought of yet.
Measuring real usage is where many organizations get their biggest savings. Theo pulled CPU and memory figures for the 38 servers from the existing monitoring system for the previous three months. Eleven of them averaged less than one tenth of their CPU, and several were sized for peaks that had not happened in years. Sizing those servers to their measured load in the estimate reduced the compute total substantially, and Renata noted that Azure makes resizing later easy if a guess turns out to be too small.
Theo also documented his assumptions on the first tab of the exported spreadsheet: the region, the hours, the growth rate, which servers were reserved and which were not, and the date the prices were checked. "An estimate without assumptions is just a number," Renata said. "When the invoice differs, the assumptions tell you why."
Total cost of ownership
Total cost of ownership (TCO) is the full cost of owning and running something over its life, not just its purchase price. For an on-premises server room, TCO includes the servers, storage and network hardware; software licenses and support contracts; the power and cooling the equipment uses; the space it occupies, whether rented or owned; the staff time spent installing, patching, monitoring and replacing it; and the cost of the backup site. Many of these costs are hidden in other budgets. The power bill for the head office building, for example, does not show which part is the server room.
A cloud TCO comparison puts the on-premises total next to the cost of running the same workloads in Azure over the same period, usually three or five years. It is a key part of a migration business case because it compares like with like: capital purchases spread over time against operating costs that start when migration begins. It also makes the case visible for things that are easy to overlook, such as the SAN support contract that Harrow & Finch would otherwise renew in June 2027, or the cost of replacing the backup tape library.
From the TCO calculator to the Azure Migrate business case
For many years Microsoft offered a separate TCO calculator on its website, where you entered your on-premises servers, storage and networking and it produced a comparison with Azure. Microsoft has since retired the TCO calculator, and its training material now says so. The capability has moved into Azure Migrate, the service used to discover, assess and migrate on-premises workloads. In Azure Migrate, a business case estimates total cost of ownership and potential savings for the servers and applications you plan to move. Older study material and practice questions may still mention the TCO calculator, so it is worth knowing both the name and what replaced it.
A business case starts with discovery data. The most accurate source is the Azure Migrate appliance, a lightweight virtual machine that discovers servers and collects their configuration and performance data over time. For a quick first look, you can import an inventory from a spreadsheet file instead. You then choose a migration preference, such as moving servers as they are to virtual machines or modernizing suitable workloads to platform services, and set cost assumptions: the target region, the pace of migration, expected growth, savings options such as Azure Hybrid Benefit, and a comfort factor that adds headroom to the sizes.
The result compares the estimated on-premises cost with the estimated Azure cost, broken down by category and shown year by year as a cash flow. The on-premises side includes compute and storage hardware, licenses, network equipment, security tools, facilities such as rent and power, management software and labor. The Azure side includes the Azure services, security services, management services such as monitoring and backup, and the labor still needed to run them. The business case also compares the current state with keeping servers on premises but managing them through Azure Arc, a topic for lesson 9.
Theo ran a business case on October 27 using a spreadsheet of the 38 servers with their measured utilization. The illustrative result showed that Azure would cost more than on premises in the first year, because the company would pay for both environments while migrating and would still be paying off the old hardware, but less from the second year onward. Dana was not surprised. "Every capital project looks like that," she said. "What I need is the year it pays back, and what happens if we are slower than planned."
| Tool | Question it answers | Inputs | Typical user |
|---|---|---|---|
| Pricing calculator | What will these Azure resources cost each month? | Products, regions, sizes, hours, options | Architects, engineers, finance |
| Azure Migrate business case | Is moving these workloads to Azure worth it over several years? | Discovered or imported servers, utilization, cost assumptions | Migration teams, finance, leadership |
| Cost Management (lesson 3) | What are we actually spending, and are we on budget? | Real usage and billing data | Everyone who owns cloud costs |
Worked problem
A simple five-year comparison
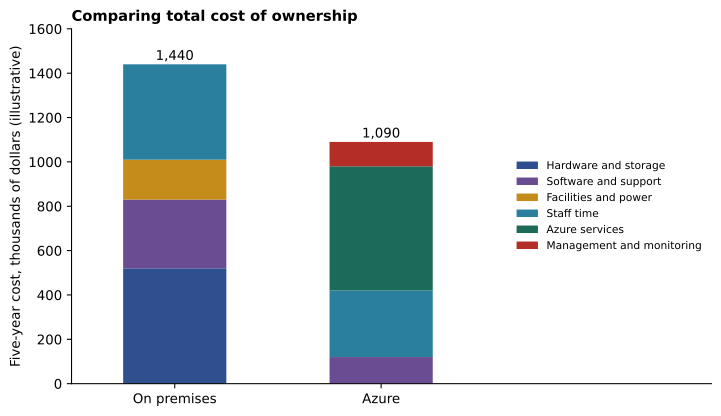
Using illustrative figures, the on-premises option costs 600,000 dollars in year 1 (including a SAN replacement) and 210,000 dollars a year after that. The Azure option costs 330,000 dollars in year 1 (including migration effort and running both environments) and 190,000 dollars a year after that. Over five years, which is cheaper and by how much?
Show solution
- On premises: 600,000 plus 4 times 210,000 is 600,000 plus 840,000, which is 1,440,000 dollars.
- Azure: 330,000 plus 4 times 190,000 is 330,000 plus 760,000, which is 1,090,000 dollars.
- The difference is 1,440,000 minus 1,090,000, which is 350,000 dollars.
Answer: Azure is cheaper over five years by 350,000 dollars in this illustrative case.
Dana's question about a slower migration is the kind of thing a short script can answer. Theo's version models the cumulative cost of each option year by year and shows when the Azure option catches up, using illustrative figures and a delay that keeps both environments running longer.
def cumulative(first_year, later_years, years=5):
    total, out = 0, []
    for y in range(1, years + 1):
        total += first_year if y == 1 else later_years
        out.append(total)
    return out

on_prem = cumulative(600_000, 210_000)
azure_plan = cumulative(330_000, 190_000)
azure_slow = [c + 60_000 for c in azure_plan]   # a slower migration: both environments run longer

for y in range(5):
    print(f"Year {y + 1}: on-prem {on_prem[y]:>9,}  Azure {azure_plan[y]:>9,}  Azure (slow) {azure_slow[y]:>9,}")
print("Five-year saving on plan:", f"{on_prem[-1] - azure_plan[-1]:,} dollars")
print("Five-year saving if slow:", f"{on_prem[-1] - azure_slow[-1]:,} dollars")Year 1: on-prem 600,000 Azure 330,000 Azure (slow) 390,000 Year 2: on-prem 810,000 Azure 520,000 Azure (slow) 580,000 Year 3: on-prem 1,020,000 Azure 710,000 Azure (slow) 770,000 Year 4: on-prem 1,230,000 Azure 900,000 Azure (slow) 960,000 Year 5: on-prem 1,440,000 Azure 1,090,000 Azure (slow) 1,150,000 Five-year saving on plan: 350,000 dollars Five-year saving if slow: 290,000 dollars
What this code does
Adds up the cost year by year over five years for staying on premises and for moving to Azure, plus a slower Azure migration. The on-premises option has a large first-year cost and the Azure options cost less each year, so the running totals show the gap widening. The final line gives the five-year saving, the kind of comparison used in a business case.
Using estimates responsibly
Estimates support decisions; they do not make them. A good TCO comparison is honest about what it includes and what it leaves out, and both the on-premises and cloud sides should be built with the same care. It is easy to make the cloud look cheap by forgetting labor, monitoring and data transfer, and equally easy to make it look expensive by ignoring the hardware refresh the company would otherwise face. The business case also cannot measure some benefits directly, such as faster delivery of new features, better resilience or the ability to scale for a seasonal peak, which matter a great deal to a retailer heading into spring.
Prices also change. Azure adjusts prices from time to time, new virtual machine families appear, and exchange rates move. Renata scheduled a review of the Skylight estimates every quarter. Each review compares the estimate with real spending from Cost Management, updates the assumptions and explains the differences to Dana, so that the forecast gets better as the project goes on.
Common mistakes
MistakeTreating a pricing calculator estimate as a firm quote.
InsteadIt is an estimate based on your inputs and public prices; real costs depend on actual usage.
MistakeSizing Azure resources to match old hardware.
InsteadMeasure real utilization and size to that, with headroom.
MistakeLooking for the TCO calculator on the Azure website.
InsteadIt has been retired; use an Azure Migrate business case for TCO comparisons.
MistakeLeaving labor and facilities out of the on-premises side.
InsteadA fair TCO counts power, space, staff time and support contracts too.
Summary and key terms
- The pricing calculator estimates the monthly cost of chosen Azure resources from inputs such as region, size, hours, savings options, licensing and data transfer, and estimates can be saved, shared and exported.
- Total cost of ownership compares the full cost of running workloads on premises and in Azure over several years, including hardware, licenses, facilities and labor.
- Microsoft has retired the old TCO calculator; the Azure Migrate business case now uses discovered or imported server data and cost assumptions to estimate TCO and savings year by year.
- Pricing calculator
- A free tool for estimating the cost of Azure resources before deploying them.
- Estimate
- A forecast based on inputs and published rates, not a binding quote.
- Total cost of ownership
- The full cost of owning and running a system over its life.
- Azure Migrate
- The Azure service for discovering, assessing and migrating on-premises workloads.
- Business case
- An Azure Migrate report estimating TCO and savings for planned migrations.
- Comfort factor
- A multiplier that adds headroom to sizing in assessments.
Practice problems
Work each problem on paper first, then reveal the answer to check.
Do you need an Azure subscription to use the pricing calculator?
Show answer
No. It is a free public tool.
Name four cost categories in an on-premises TCO.
Show answer
Any four of hardware, software licenses, facilities such as power and space, labor, network equipment and support contracts.
What replaced the TCO calculator?
Show answer
The business case in Azure Migrate.
Lesson quiz · 5 questions
Score 60% or more to complete this lesson.
Create a free account to save your progress, take quizzes and earn a certificate.