
MBA-512 · Lesson 6 of 12 · 22 min
Product and service innovation
Owen Tremblay's community solar program has been open for a year, and 400 households have signed up. Prairie Ridge's business plan assumed 4,000. The offer is sound: a subscriber pays a monthly fee for a share of the output of a local solar farm and receives a credit on their electricity bill that, on average, exceeds the fee. Customers who have joined rate it highly. The problem is everyone else. In Prairie Ridge's research, most households say they have never heard of community solar, many who have heard of it assume they would need panels on their roof, and some suspect a catch. Owen asks whether the product needs redesigning or whether the forecast was simply wrong. Dr. Lindqvist says the answer is probably both, and that this lesson will show how to tell.
Innovation is the creation and adoption of new products, services, processes or business models that create value. Marketing contributes to every stage: understanding which customer jobs are poorly served, shaping concepts that customers will value, forecasting how fast a new offer will be adopted and designing the launch. This lesson covers how products and services are defined, the main types of innovation, the development process, how innovations spread, and what is distinctive about services.
What a product is
Levitt and later Philip Kotler described a product as layers of value. The core benefit is the job the customer is hiring the product to do: for community solar, lower electricity costs and a way to support clean energy without installing equipment. The actual product is the offer as designed and delivered: the subscription terms, the size of the share, the billing arrangement, the contract length and the brand. The augmented product includes everything around it that adds value or reduces risk: customer service, a guarantee that the credit will exceed the fee, an online dashboard showing the farm's output, the ability to transfer the subscription when moving house. Competition increasingly happens in the outer layers, because the core benefit is often easy to match.
Most firms manage product lines, groups of closely related products, and must decide on line length, how many variants to offer, and line positioning. A longer line serves more segments and fills shelf space, but it raises costs, complicates operations and can confuse customers. Lines tend to grow, since adding a variant is easier than dropping one, so firms need regular pruning. Cedarline's assortment has grown from about 1,900 to more than 3,400 styles and variants in four years, and the cohort suspects that much of its excess inventory sits in the tail of slow-selling variants.
Types of innovation
Innovations differ in how far they depart from what exists. Incremental innovations improve existing products, such as a lighter version of a tent or a faster checkout. Radical innovations create new categories or change how a job is done, such as smartphones or streaming video. Most successful firms rely mainly on incremental innovation, with a smaller portfolio of riskier bets. Innovation also need not be a new product: process innovations change how products are made or delivered, and business model innovations change how value is created and captured, as subscriptions, rentals and marketplaces have done in many industries.
Clayton Christensen's theory of disruptive innovation, set out in The Innovator's Dilemma in 1997, describes a particular pattern. Established firms improve their products along the dimensions their best customers value, eventually overshooting what many customers need. A new entrant offers a product that is worse on those dimensions but cheaper, simpler or more convenient, initially serving customers the incumbents ignore or people who were not buying at all. As the entrant improves, it moves upmarket and takes the incumbents' mainstream customers. Christensen distinguished this from sustaining innovation, the improvements that serve existing customers better, which incumbents usually win. The theory has been criticized for being applied too loosely, but its central point stands: a firm that listens only to its current best customers can miss the threat that matters.
Developing new products
The traditional new product development process moves through idea generation, screening, concept development and testing, business analysis, product development, market testing and commercialization. Robert Cooper's stage-gate model formalized it into stages separated by gates at which managers decide whether to continue, stop or redirect a project, using explicit criteria such as strategic fit, market attractiveness, technical feasibility and financial return. The gates are where most of the value lies: killing weak projects early frees resources for strong ones.
Concept testing is the marketing heart of the process. A concept is a description, sketch or prototype of the product and its benefits, presented to target customers before the product exists. Researchers measure comprehension, appeal, uniqueness, believability and purchase intention, and probe what customers like and dislike. The conjoint methods of lesson 3 can estimate which combination of features customers value most. Purchase intentions from concept tests overstate actual purchase, so forecasters apply conversion weights calibrated on past launches.
For digital products and new ventures, the lean startup approach popularized by Eric Ries in 2011 compresses the cycle. Instead of a long development followed by a launch, the team builds a minimum viable product, the simplest version that can test the riskiest assumptions with real customers, measures what customers do, and learns whether to persevere or pivot. Leo describes Kestrel's first product as a spreadsheet macro and a weekly phone call. The two approaches are complementary: lean methods are good at discovering what customers want, while stage-gate discipline is good at allocating large investments across a portfolio of projects.
How innovations spread
Everett Rogers' Diffusion of Innovations, first published in 1962, synthesized research on how new ideas and products spread through a population. Rogers classified adopters by when they adopt relative to others: innovators, about 2.5 percent; early adopters, 13.5 percent; early majority, 34 percent; late majority, 34 percent; and laggards, 16 percent. He also identified five attributes of an innovation that speed or slow its adoption. Relative advantage is how much better it is than what it replaces. Compatibility is how well it fits existing values, habits and infrastructure. Complexity is how hard it is to understand and use. Trialability is whether it can be tried on a limited basis. Observability is whether its results are visible to others.
Geoffrey Moore's Crossing the Chasm, published in 1991, argued that for technology products there is a gap between early adopters, who buy for the advantage of being first, and the early majority, who want proven, complete solutions and references from people like themselves. Many products that succeed with enthusiasts fail to cross it. Moore's advice was to concentrate on a single niche of mainstream customers, give them a complete solution and use them as references for adjacent niches.
Owen applies Rogers' attributes to community solar. Its relative advantage is real but small for any one household, a few dollars a month. Compatibility is mixed: households understand electricity bills but not the idea of owning part of a distant farm. Complexity is high in customers' minds, as the confusion about rooftop panels shows. Trialability is low if contracts are long. Observability is close to zero, since nothing changes at the subscriber's house. Every attribute except relative advantage works against fast adoption, and the fixes are about the offer and its communication rather than the solar farm: a short first contract that can be ended at any time, a simple explanation that nothing is installed, a guarantee, a bill that shows the saving clearly, and something visible, perhaps a sign for the front window.
Forecasting adoption: the Bass model
Frank Bass proposed a model in 1969 that remains the standard way to forecast the adoption of new durable products and services. It assumes that each period, some people who have not yet adopted do so because of external influence, such as advertising and media, at a rate p, the coefficient of innovation, and others adopt because of internal influence from people who already have, at a rate proportional to the share who have adopted, with coefficient q, the coefficient of imitation. The number of new adopters in a period is the remaining potential multiplied by the sum of the two effects.
In this formula n(t) is the number of new adopters in period t, N(t) the cumulative number of adopters before it and m the market potential, the number of people who will eventually adopt. When q is much larger than p, as is typical, adoption starts slowly, accelerates as word of mouth builds, peaks and then declines as the market saturates, producing the familiar S-shaped cumulative curve. The time of peak adoption in the continuous version of the model is t-star in the formula above. A meta-analysis of published studies by Fareena Sultan, John Farley and Donald Lehmann in 1990 found average values of about 0.03 for p and 0.38 for q, though they vary widely by category, and forecasters often borrow parameters from analogous products when no data yet exist.
import math
# Bass diffusion forecast for Prairie Ridge's community solar subscriptions
m = 40000          # households expected to subscribe eventually (market potential)
scenarios = {'Base (p=0.01, q=0.35)':       (0.01, 0.35),
             'Referral program (q=0.50)':   (0.01, 0.50),
             'Launch campaign (p=0.03)':    (0.03, 0.35)}
for name, (p, q) in scenarios.items():
    N, adopters = 0.0, []
    for year in range(1, 11):
        new = (p + q * N / m) * (m - N)
        N += new
        adopters.append(new)
    peak = math.log(q / p) / (p + q)
    print(f"{name:28} yr1 {adopters[0]:6,.0f}  yr3 {adopters[2]:6,.0f}  yr5 {adopters[4]:6,.0f}"
f" total by yr5 {sum(adopters[:5]):7,.0f} peak near year {peak:.1f}")Base (p=0.01, q=0.35) yr1 400 yr3 710 yr5 1,219 total by yr5 3,799 peak near year 9.9 Referral program (q=0.50) yr1 400 yr3 875 yr5 1,816 total by yr5 4,956 peak near year 7.7 Launch campaign (p=0.03) yr1 1,200 yr3 2,020 yr5 3,074 total by yr5 10,398 peak near year 6.5
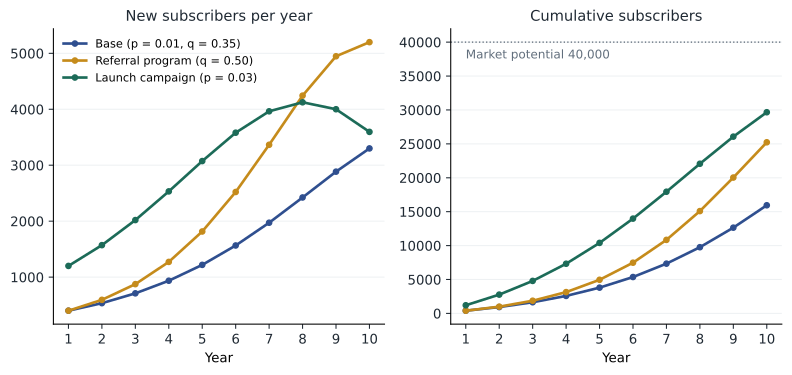
The base case, with a low coefficient of innovation of 0.01 that reflects Prairie Ridge's minimal marketing so far, reproduces the 400 subscribers of the first year and forecasts fewer than 4,000 by the end of year five, with the peak almost a decade away. A referral program that raises q to 0.50 helps, but only once there are enough subscribers to talk to others. Raising p to 0.03 with a launch campaign that explains the offer, closer to the average for new products, triples first-year adoption and brings the five-year total to more than 10,000. The model makes the strategic point vivid: when almost nobody has adopted, word of mouth has nothing to work with, so early effort should go into awareness and understanding. Dr. Lindqvist adds that the market potential, 40,000 households, is itself an estimate that deserves as much scrutiny as p and q.
Innovating in services
Services such as healthcare, banking, education, travel and Kestrel's software support differ from physical goods in ways that shape how they are designed and marketed. They are intangible, so customers cannot inspect them before buying and rely on cues such as reputation, staff and surroundings. They are heterogeneous, varying with the person providing them and the day. They are inseparable, produced and consumed at the same time, often with the customer taking part. And they are perishable: an empty clinic appointment on Tuesday evening cannot be stored for Saturday. These features explain why services marketing adds people, process and physical evidence to the four Ps.
G. Lynn Shostack introduced the service blueprint in 1984 as a way to design services deliberately. A blueprint maps the customer's actions step by step, the frontstage actions of staff the customer sees, the backstage actions that support them, and the support processes and systems behind those, separated by a line of visibility. It shows where failures are likely, where customers wait, and which backstage steps determine the experience. Hana's team blueprints a clinic visit and finds that the longest wait comes after the physician has finished, while a nurse searches the hospital's system for the patient's records to send a prescription to the pharmacy, a step invisible to the patient but felt as an unexplained delay.
Service quality has been measured with the SERVQUAL framework developed by A. Parasuraman, Valarie Zeithaml and Leonard Berry, published in 1988, which identifies five dimensions: reliability, delivering what was promised dependably and accurately; responsiveness, willingness to help promptly; assurance, the knowledge and courtesy of staff and their ability to inspire trust; empathy, individual care and attention; and tangibles, the appearance of facilities, equipment and staff. In their studies reliability mattered most. Quality, in this view, is the gap between what customers expect and what they perceive, so managing expectations is as important as managing delivery.
When services fail, recovery matters. Customers whose problem is resolved quickly and fairly are often as loyal as those who never had a problem, and occasionally more so, an effect called the service recovery paradox, although later research found it holds only under limited conditions. The practical lesson is consistent: make it easy to complain, respond quickly, empower frontline staff to fix problems, and learn from each failure.
Worked problem
Cedarline's lifetime repair service
The conjoint study in lesson 3 suggested customers would pay about 37 dollars more for a jacket with lifetime repairs. Cedarline must decide how to design the service. Its repair partner estimates that about 30 percent of jackets will come in for at least one repair over their life, at an average cost of 45 dollars per repair including shipping, and that each repaired jacket averages 1.4 repairs. How should Cedarline evaluate and design the service?
Show solution
- Estimate the expected cost per jacket sold: 0.30 × 1.4 × 45, about 19 dollars, spread over several years and so worth somewhat less in present value.
- Compare with willingness to pay: if customers value the service at about 37 dollars and Cedarline raises the price by, say, 25 dollars, both customer surplus and margin rise, creating value on both sides of the value stick.
- Blueprint the service: an online request, a prepaid shipping label, a promised turnaround of three weeks, status updates, and backstage capacity at the repair partner; reliability of the promise is the quality dimension that matters most.
- Consider wider effects: repairs keep customers in contact with the brand, support an honest durability claim and generate data on product weaknesses for designers.
Answer: The service creates value because customers value it at roughly twice its expected cost. The design priorities are a simple request process, a reliable turnaround promise and clear communication, and the claims made for it must be specific, consistent with the rules on environmental claims in lesson 5.
Common mistakes
MistakeA new product fails because the forecast was too optimistic.
InsteadCheck the product's relative advantage, compatibility, complexity, trialability and observability; the offer may be the problem.
MistakeWord of mouth will drive early adoption.
InsteadWith few adopters, imitation has little to work with; early effort must raise awareness and understanding.
MistakeMore product variants always mean more sales.
InsteadLong lines raise costs and inventory and can confuse customers; prune regularly.
MistakeService quality is about what the firm delivers.
InsteadQuality is the gap between expectations and perceptions; reliability matters most.
Summary and key terms
- Products are layers of value: core benefit, actual product and augmented product.
- Innovation can be incremental or radical and can change products, processes or business models; disruptive innovations start at the low end or with non-customers.
- Stage-gate processes allocate resources across projects; lean methods test assumptions quickly with minimum viable products.
- Rogers' five attributes explain adoption speed; the Bass model forecasts adoption from innovation and imitation coefficients.
- Services are intangible, heterogeneous, inseparable and perishable; blueprints and SERVQUAL help design and measure them.
- Augmented product
- The services and assurances around a product that add value or reduce risk.
- Disruptive innovation
- An innovation that starts by serving overlooked or non-customers with a simpler, cheaper offer and later moves upmarket.
- Stage-gate process
- A development process with decision gates between stages at which projects are continued, stopped or redirected.
- Minimum viable product
- The simplest version of a product that can test the riskiest assumptions with real customers.
- Bass model
- A diffusion model in which adoption is driven by external influence (p) and imitation of existing adopters (q).
- Service blueprint
- A map of customer actions, frontstage and backstage staff actions and support processes in a service.
Practice problems
Work each problem on paper first, then reveal the answer to check.
In the Bass model with p = 0.02, q = 0.40 and m = 10,000, how many adopt in the first period?
Show answer
0.02 × 10,000 = 200, since no one has yet adopted.
Using the continuous Bass formula, when does adoption peak if p = 0.03 and q = 0.38?
Show answer
ln(0.38 / 0.03) / 0.41, about 6.2 periods.
Which of Rogers' attributes is improved by offering a free one-month trial?
Show answer
Trialability.
A hotel guest's room is not ready on arrival. Name two elements of a good service recovery.
Show answer
A prompt apology and explanation, and a fair remedy such as a free drink and upgrade, delivered by empowered frontline staff.
Lesson quiz · 5 questions
Score 60% or more to complete this lesson.
Create a free account to save your progress, take quizzes and earn a certificate.