
MBA-512 · Lesson 3 of 12 · 22 min
Market research: qualitative methods, surveys and experiments
Grace Mwangi brings a binder to the third weekend. Fairway Grocers has commissioned four research studies on its private-label range in two years: a set of focus groups, an online survey of 2,000 shoppers, a review of loyalty-card data and a brand tracking study. Each cost tens of thousands of dollars. Each produced a thick report. And Fairway's category managers have changed almost nothing as a result. Dr. Lindqvist leafs through the binder and asks a single question: what decision was each study meant to inform? Grace finds that none of the four reports states one.
Market research, Dr. Lindqvist says, is the systematic gathering and analysis of information to improve marketing decisions. The last two words are the point. Research that is not tied to a decision tends to describe everything and change nothing. The cohort met the same principle in MBA-504, where every analysis began with a decision brief. This lesson applies it to the main tools of marketing research: qualitative methods for discovering what matters, surveys for measuring how much, conjoint analysis for measuring trade-offs, and experiments for establishing what causes what.
The research process
Good research follows a sequence. It starts by defining the decision problem: what will the manager decide, among which options, and by when? It then states research objectives: what must be known to make that decision well, and how accurately? Only then does it choose a design. Exploratory research, often qualitative, is used when the problem is poorly understood and the aim is to generate hypotheses. Descriptive research, typically surveys and analysis of existing data, measures the size of markets, the share of customers with particular needs or the attitudes of a population. Causal research, through experiments, tests whether a change in a marketing action produces a change in behavior. After data collection and analysis comes the step most often skipped: deciding what to do and stating how confident one is.
Before collecting new data, a researcher should exhaust what already exists. Secondary data, collected for other purposes, include government statistics, industry reports, trade association data and academic studies. Internal data, often the richest source, include transactions, loyalty-card records, website analytics, customer service logs and the notes of sales representatives. Primary data, collected specifically for the problem, cost more and take longer but can answer questions the other sources cannot. Grace realizes that Fairway's loyalty-card data could already answer the question her category managers care most about, which shoppers switch from national brands to private label and back, without any new survey at all.
Qualitative research: discovering what matters
Qualitative methods are designed to understand the meanings, motives and language customers use, not to measure how common they are. In-depth interviews, usually one-on-one and lasting an hour or more, let a skilled interviewer follow up on what customers say and probe beneath surface answers with techniques such as laddering, repeatedly asking why an attribute matters until the underlying value emerges. A hiker may begin by saying a jacket must be light, explain that light gear lets her travel further, and end by saying that going further alone makes her feel capable and free. The last answer tells a brand far more than the first.
Focus groups bring six to ten people together for a moderated discussion. They are useful for reactions to concepts, advertising ideas and packaging, and for hearing how customers talk about a category. They are also prone to well-known problems: dominant participants sway the group, people say what seems socially acceptable, and managers watching behind a mirror tend to remember the comments that confirm what they already believed. Observation and ethnography, watching customers in stores, homes or workplaces, often reveal what people do rather than what they say they do. For business markets, structured customer visits by cross-functional teams of engineers, sales staff and managers serve a similar purpose. Social listening, the analysis of what customers say in reviews, forums and social media, adds a large and unprompted source of qualitative data.
How many interviews are enough? Qualitative research seeks saturation, the point at which new interviews stop producing new themes. In a widely cited study, Greg Guest and colleagues found that most themes in a fairly homogeneous group had emerged within about twelve interviews. More are needed when the population is varied or the topic complex. The output of qualitative work is not a number but a set of hypotheses, a vocabulary and a list of attributes, which later research can measure.
Surveys: measuring how much
Surveys measure attitudes, behaviors and intentions across a population. Their accuracy depends on two quite different things: who answers and what they are asked. On the first, the researcher needs a sampling frame that covers the population of interest, a sampling method that gives each member a known chance of selection, and a response rate high enough, or adjustments good enough, that respondents resemble the population. The cohort saw in MBA-504 how Cedarline's survey of loyalty members, who spend more than average, could not be read as a measure of all customers. Online panels are cheap and fast but consist of people who choose to take surveys, so their results must be weighted and treated with care.
On the second, question wording can change answers dramatically. Leading questions suggest the desired answer: how much do you enjoy our new range? Double-barrelled questions ask two things at once: is the store clean and well organized? Acquiescence bias makes people more likely to agree with any statement, and social desirability bias makes them overstate virtuous behavior, such as buying environmentally friendly products. Scales should be balanced, response options exhaustive and mutually exclusive, and questions tested on a small sample before the main survey. Dr. Lindqvist's rule is to ask about specific past behavior whenever possible, what did you buy last time, rather than about general habits or future intentions.
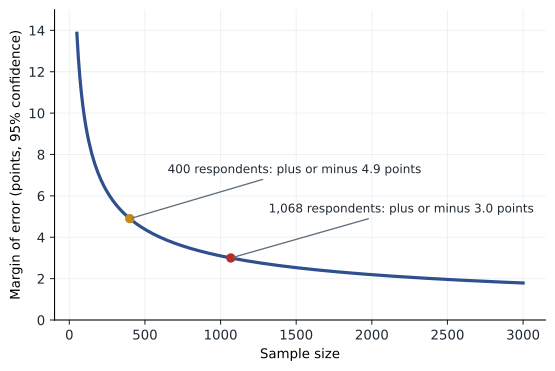
Sampling error, the random variation that arises because only part of the population is surveyed, can be quantified. For a proportion estimated from a simple random sample, the margin of error at 95 percent confidence is about 1.96 times the standard error. The margin shrinks with the square root of the sample size, so quadrupling the sample only halves it. The formula covers only sampling error; it says nothing about bias from a poor frame, low response or bad questions, which is often larger.
Two widely used survey measures deserve comment. Stated purchase intention, how likely are you to buy this product, systematically overstates actual purchase, so firms that forecast from intentions apply conversion weights, counting only a fraction of those who say they will definitely or probably buy, with the fractions calibrated from past launches in the category. The Net Promoter Score, introduced by Fred Reichheld in 2003, asks how likely customers are to recommend a company on a scale of 0 to 10 and subtracts the share of detractors, scoring 0 to 6, from the share of promoters, scoring 9 or 10. It is simple and widely tracked, but academic studies have found it no better than other satisfaction measures at predicting growth, and its single number hides a great deal. Dr. Lindqvist suggests using it, if at all, alongside the open-ended reasons customers give.
Conjoint analysis: measuring trade-offs
Asking customers directly how important price, quality or brand are produces unhelpful answers: everything is very important. Conjoint analysis forces trade-offs instead. Respondents evaluate or choose among product profiles that combine different levels of each attribute, and a statistical model infers how much each level contributes to the overall preference, called its part-worth utility. Because price is one of the attributes, part-worths can be converted into dollars, giving an estimate of willingness to pay for each feature. Modern studies usually use choice-based conjoint, in which respondents pick one option from several sets of profiles, analyzed with choice models that estimate part-worths for each respondent.
The cohort runs a small ratings-based example for Cedarline, which is considering two changes to its insulated jacket line: offering a down-filled version and replacing its two-year warranty with a lifetime repair service. Sixteen profiles combine two prices, two fills, two warranties and two brands, and a panel of target customers rates each on a scale of 0 to 10. Because the design is a balanced full factorial, each part-worth is simply the difference between the average rating of profiles with and without the feature.
import math, itertools
# 1. Margin of error for a proportion at 95% confidence
z = 1.96
for n in (100, 400, 1000, 2500):
    print(f"n = {n:>5}: margin of error +/- {z * math.sqrt(0.25 / n):.1%}")
print(f"Sample needed for +/- 3 points: {math.ceil(z**2 * 0.25 / 0.03**2):,}")

# 2. Conjoint: 16 jacket profiles (full factorial), average panel ratings on a 0-10 scale
attrs = ['Price 299 (vs 249)', 'Down fill (vs synthetic)',
         'Lifetime repair (vs 2-year warranty)', 'Cedarline brand (vs rival)']
labels = [None, 'down fill', 'lifetime repair', 'the Cedarline brand']
profiles = list(itertools.product((0, 1), repeat=4))
ratings = [5.1, 5.3, 6.2, 6.9, 5.8, 6.5, 7.3, 7.4, 3.4, 4.0, 4.5, 5.1, 4.5, 4.7, 5.3, 6.1]
pw = []
for k, name in enumerate(attrs):
    hi = [r for p, r in zip(profiles, ratings) if p[k] == 1]
    lo = [r for p, r in zip(profiles, ratings) if p[k] == 0]
    pw.append(sum(hi) / len(hi) - sum(lo) / len(lo))
    print(f"{name:40}{pw[-1]:+.2f}")
per_dollar = -pw[0] / 50                     # rating points lost per dollar of price
for k in (1, 2, 3):
print(f"Implied willingness to pay for {labels[k]}: {pw[k] / per_dollar:.0f} dollars")n = 100: margin of error +/- 9.8% n = 400: margin of error +/- 4.9% n = 1000: margin of error +/- 3.1% n = 2500: margin of error +/- 2.0% Sample needed for +/- 3 points: 1,068 Price 299 (vs 249) -1.61 Down fill (vs synthetic) +0.89 Lifetime repair (vs 2-year warranty) +1.19 Cedarline brand (vs rival) +0.49 Implied willingness to pay for down fill: 28 dollars Implied willingness to pay for lifetime repair: 37 dollars Implied willingness to pay for the Cedarline brand: 15 dollars
The output shows the first part of the code converting sample sizes into margins of error, and the sample of 1,068 needed for a margin of plus or minus 3 points when the true proportion could be near one half. In the conjoint, the price increase of 50 dollars costs about 1.6 rating points, so one point is worth about 31 dollars. Lifetime repair adds about 1.2 points, implying willingness to pay of about 37 dollars, more than the 28 dollars for down fill and more than double the 15 dollars for the Cedarline name. Owen observes that the repair service may also be cheaper to provide than down, which would make it the more profitable change. Dr. Lindqvist cautions that ratings in a survey are hypothetical, that a panel of sixteen profiles is far smaller than a real study, and that conjoint estimates are best used to compare options rather than to set an exact price.
Experiments: establishing cause
Surveys and observational data reveal associations, but marketing decisions are about causes: if we change the price, the message or the shelf layout, what will happen? The most reliable way to answer is an experiment, in which the researcher randomly assigns customers, stores or regions to different treatments and compares outcomes. Randomization ensures that, on average, the groups differ only in the treatment, so differences in outcomes can be attributed to it. Online, A/B tests of web pages, emails and prices are routine and cheap, as the cohort saw in MBA-504 and will see again in lesson 10. Offline, firms run field experiments in matched stores or regions, and test markets that launch a product in a few cities before committing nationally.
Experiments have their own pitfalls. Running too many tests and reporting only the winners produces false discoveries. Short tests can miss long-run effects, such as a price promotion that lifts sales this week by stealing sales from next month. Tests in a few stores may not generalize, and competitors can read and disrupt a test market. And some questions cannot be tested ethically or practically: Hana cannot randomly withhold information about a clinic from sick patients. In such cases researchers use quasi-experimental methods, such as comparing changes in regions that received a campaign with similar regions that did not, the difference-in-differences approach the cohort learned in MBA-504.
| Method | Best for | Main limitations |
|---|---|---|
| In-depth interviews | Motives, language, hypotheses | Small samples; interviewer skill matters |
| Focus groups | Reactions to concepts and messages | Group dynamics; easily over-read |
| Observation and ethnography | What customers actually do | Costly; hard to generalize |
| Surveys | Measuring attitudes and their prevalence | Sampling, non-response and wording biases |
| Conjoint analysis | Trade-offs and willingness to pay | Hypothetical choices; design complexity |
| Experiments and A/B tests | Causal effects of marketing actions | Short horizons; multiple testing; generalizability |
New tools and old principles
Research methods are changing quickly. Firms can analyze millions of reviews with language models, run hundreds of website experiments a year and track customers across devices. Some research firms now offer synthetic respondents, language models prompted to answer survey questions as if they were particular customers. Dr. Lindqvist treats these as useful for drafting questions, generating hypotheses and stress-testing a questionnaire, but not as a substitute for real customers, because a model's answers reflect patterns in its training data rather than the preferences of the people a firm actually needs to persuade. The principles do not change: tie the research to a decision, choose the method that fits the question, look for bias as well as noise, and state how confident the conclusions are.
Research also carries ethical duties to participants: informed consent, honesty about the purpose and sponsor of research where this does not invalidate it, protection of personal data and a clear separation between research and selling. In the United States, the Insights Association publishes a code of standards for the industry, and the state privacy laws discussed in lesson 2 apply to research data as to any other personal information.
Worked problem
Grace's private-label survey
Fairway wants to know what share of its shoppers would consider buying a new premium private-label range positioned against national brands. Grace's category managers want the estimate to within plus or minus 3 percentage points at 95 percent confidence, and they also want separate estimates for each of four regions to within 5 points. How large a sample is needed, and what else should Grace insist on?
Show solution
- For the overall estimate, use the conservative assumption p = 0.5: n = 1.96 squared × 0.25 / 0.03 squared, which is about 1,068 shoppers.
- For each region to within 5 points: n = 1.96 squared × 0.25 / 0.05 squared, about 385 per region, or 1,540 in total, which also satisfies the overall requirement.
- Draw the sample from loyalty-card holders and non-members in proportion, or weight the results, since loyalty members differ from other shoppers.
- Ask about behavior where possible, such as which private-label products shoppers bought in the last month, and treat stated consideration of a range that does not yet exist as an upper bound.
Answer: Grace needs about 1,540 completed surveys, 385 in each region. More important than the number is the design: a sample that represents all shoppers, neutral questions and a clear statement of the decision the results will inform, which is whether to launch the premium range in all four regions or test it first in one.
Common mistakes
MistakeResearch should describe the market as fully as possible.
InsteadResearch should be designed to inform a specific decision.
MistakeA large sample guarantees accurate results.
InsteadSample size reduces random error only; bias from the frame, non-response or wording can be larger.
MistakeFocus group comments show what customers think.
InsteadFocus groups generate hypotheses; their findings must be measured with larger, representative samples.
MistakeCustomers who say they will buy will buy.
InsteadStated intentions overstate behavior and need calibrated conversion weights.
Summary and key terms
- Market research should start with the decision it is meant to inform.
- Exploratory, descriptive and causal research answer different questions; use existing data before new studies.
- Qualitative methods discover motives and language; surveys measure prevalence; conjoint measures trade-offs; experiments test causes.
- Margin of error falls with the square root of sample size and covers only sampling error.
- Stated intentions and single scores such as NPS need careful interpretation.
- Laddering
- An interviewing technique that asks repeatedly why an attribute matters, to reach underlying values.
- Saturation
- The point in qualitative research at which further interviews produce no new themes.
- Sampling frame
- The list or mechanism from which a sample is drawn.
- Part-worth utility
- The contribution of an attribute level to overall preference, estimated by conjoint analysis.
- Net Promoter Score
- The share of promoters minus the share of detractors on a 0 to 10 likelihood-to-recommend question.
- Insights Association
- The US industry body that sets standards for market research and analytics.
Practice problems
Work each problem on paper first, then reveal the answer to check.
A survey of 400 customers finds that 30 percent prefer a new design. What is the approximate 95 percent margin of error?
Show answer
1.96 × the square root of (0.3 × 0.7 / 400), about 4.5 points.
Rewrite the question: Don't you agree that our stores are clean and friendly?
Show answer
Split and neutralize: How would you rate the cleanliness of the store? How would you rate the friendliness of the staff?
In a conjoint study, a 20 dollar price increase lowers utility by 0.8 and a longer battery life raises it by 0.6. What is the implied willingness to pay for the longer battery life?
Show answer
0.6 / (0.8 / 20) = 15 dollars.
Why might a two-week price promotion test overstate the long-run gain from the promotion?
Show answer
Customers may stock up or shift purchases forward, so sales fall after the test.
Lesson quiz · 5 questions
Score 60% or more to complete this lesson.
Create a free account to save your progress, take quizzes and earn a certificate.