
MBA-512 · Lesson 4 of 12 · 22 min
Segmentation, targeting and positioning
Leo Brandt has a growth problem that looks like a sales problem. Kestrel Analytics built its inventory forecasting software for independent retailers with one to five stores, and it sold well: the product was cheap, quick to set up and needed no data team. Now Kestrel's investors want faster growth, and Leo's sales team has started pursuing mid-sized chains with fifty to three hundred stores. The deals are larger but they take nine months to close, the chains ask for features the product does not have, and two pilots have failed because the chains' data were too messy for Kestrel's automatic setup. Leo asks whether the answer is a bigger sales team. Dr. Lindqvist suggests the answer may be a clearer decision about which customers Kestrel is for.
This lesson covers the three linked decisions at the heart of marketing strategy, often abbreviated STP. Segmentation divides a market into groups of customers with similar needs and responses to marketing. Targeting chooses which of those groups to serve. Positioning decides how the firm wants its offer to be seen by the target customers, relative to the alternatives. The tactical decisions in later lessons, product, price, channel and communication, all follow from these choices.
Why segment?
Customers differ. They want different things from a product, value it differently, buy it in different places and respond to different messages. A single offer aimed at everyone, sometimes called mass marketing, works when needs are similar, as for table salt or electricity in the past. In most markets it leaves money on the table in two ways. Customers who would pay more for a better product are offered something that is merely adequate, and customers who want a basic product are asked to pay for features they do not value. Segmentation lets a firm create more value by matching offers to needs, and capture more by matching prices to willingness to pay.
There is a spectrum of approaches. A firm can serve the whole market with one offer, serve several segments with a different offer for each, concentrate on one segment or niche, or, at the extreme, tailor the offer to individual customers, which digital channels and flexible manufacturing increasingly allow. Each step toward finer segmentation raises the fit between offer and customer and also raises the cost of designing, producing and marketing many offers. The right degree of segmentation balances those gains and costs.
Bases for segmentation
Consumer markets can be segmented on several kinds of variables. Geographic variables include region, city size and climate; a Cedarline insulated jacket sells differently in Winnipeg and in Vancouver, or in Minneapolis and in Atlanta. Demographic variables include age, income, family stage and occupation, and are easy to measure and to reach through media. Psychographic variables describe lifestyles, values and personality, such as an adventurous or environmentally committed outlook. Behavioral variables describe how customers relate to the product: the benefits they seek, how often and on what occasions they use it, their loyalty and their sensitivity to price.
The most useful segmentations usually start with needs and behavior, because these drive responses to marketing, and then describe the resulting segments in demographic and geographic terms, because these determine how the segments can be reached. Russell Haley's classic 1968 study of toothpaste buyers made the point: segments defined by the benefits they sought, such as decay prevention, bright teeth, taste or low price, behaved very differently, whereas demographic segments did not. Two people of the same age and income may buy a jacket for completely different jobs.
Business markets have their own variables. Thomas Bonoma and Benson Shapiro proposed a nested approach in 1983, moving from the outer layers, which are easy to observe, to the inner ones, which are more powerful but harder to measure: firmographics such as industry, company size and location; operating variables such as technology and capabilities; purchasing approaches, such as centralized buying and preferred contract types; situational factors, such as urgency and order size; and the personal characteristics of buyers, such as attitudes to risk. Daniel's equipment makers form a segment by industry, but within it, firms that design their own components behave very differently from those that buy standard parts.
Good segments and how to find them
Philip Kotler's long-standing criteria are a useful test. A segment should be measurable, so its size and characteristics can be estimated; substantial, large and profitable enough to justify a distinct offer; accessible, reachable through channels and media; differentiable, responding differently to marketing from other segments; and actionable, so the firm can actually design and deliver a distinct program. A segment of customers born in the spring is measurable and perhaps substantial, but unless they respond differently to something the firm can control, it is not useful.
Segments can be identified by judgment, from managers' experience and qualitative research, or statistically, from survey or transaction data. A common statistical method is cluster analysis. The k-means algorithm assigns each customer to the nearest of k cluster centers, recomputes each center as the average of its members, and repeats until the assignments stop changing. Variables should be standardized first so that a variable measured in large units does not dominate. The analyst tries several values of k and looks for a point beyond which more clusters reduce the within-cluster spread only a little, the so-called elbow, and then checks whether the resulting clusters make sense and meet Kotler's criteria.
import random, math
random.seed(512)
# Survey of 400 Cedarline customers: (outdoor trips a year, price sensitivity 1-7, style importance 1-7)
groups = [(14, 2.5, 3.0, 60), (6, 3.5, 3.5, 140), (2, 3.0, 6.0, 110), (3, 6.2, 2.8, 90)]
data = []
for trips, price, style, n in groups:          # simulated responses
    for _ in range(n):
        data.append((max(0, random.gauss(trips, 2.0)),
                     min(7, max(1, random.gauss(price, 0.7))),
                     min(7, max(1, random.gauss(style, 0.7)))))
cols = list(zip(*data))
mu = [sum(c) / len(c) for c in cols]
sd = [math.sqrt(sum((x - m) ** 2 for x in c) / len(c)) for c, m in zip(cols, mu)]
z = [tuple((x - m) / s for x, m, s in zip(row, mu, sd)) for row in data]   # standardize

def dist2(p, c): return sum((a - b) ** 2 for a, b in zip(p, c))
def kmeans(pts, k, seed, iters=50):
    cent = random.Random(seed).sample(pts, k)
    for _ in range(iters):
        members = [[] for _ in range(k)]
        for p in pts:
            members[min(range(k), key=lambda j: dist2(p, cent[j]))].append(p)
        cent = [tuple(sum(v) / len(g) for v in zip(*g)) if g else cent[i] for i, g in enumerate(members)]
    return cent, sum(min(dist2(p, c) for c in cent) for p in pts)

print("k  within-cluster sum of squares")
for k in range(2, 7):
    print(k, f"{min(kmeans(z, k, s)[1] for s in range(5)):8.1f}")
cent = min((kmeans(z, 4, s) for s in range(5)), key=lambda r: r[1])[0]
print("Segment averages (trips, price sensitivity, style importance) and sizes:")
for c in sorted(cent, key=lambda c: -c[0]):
    raw = [m + v * s for v, m, s in zip(c, mu, sd)]
    size = sum(1 for p in z if min(range(4), key=lambda j: dist2(p, cent[j])) == cent.index(c))
print(f" {raw[0]:5.1f} {raw[1]:5.1f} {raw[2]:5.1f} n = {size}")k within-cluster sum of squares
2 750.7
3 398.7
4 256.2
5 230.5
6 213.0
Segment averages (trips, price sensitivity, style importance) and sizes:
13.5 2.6 2.9 n = 64
6.2 3.6 3.4 n = 136
3.4 6.2 2.9 n = 90
2.6 2.9 6.1 n = 110The within-cluster sum of squares falls sharply from two to three and from three to four clusters, then only slightly beyond four, so the cohort adopts four segments. Their centers are easy to interpret. About 16 percent of respondents take more than a dozen trips a year and care little about price or style: the cohort calls them expedition enthusiasts. About a third take around six trips a year with moderate price sensitivity: weekend trail families. Just over a quarter rarely go outdoors but rate style highly: urban style buyers. The remaining fifth are highly price-sensitive occasional users: value basics. These are simulated data, but the shape matches what Cedarline's own research has suggested for years.
Choosing target segments
Targeting evaluates each segment on two dimensions. Segment attractiveness depends on its size and growth, the margins customers will pay, the intensity of competition, the bargaining power of customers and channels, and risks such as regulation or changing tastes. Fit depends on whether the firm's capabilities, brand and resources give it an advantage in serving the segment, and whether serving it is consistent with the firm's objectives and with its other segments. A large, attractive segment that the firm is poorly equipped to serve is a trap, as Kestrel's chains are proving.
| Segment | Share of customers | Willingness to pay | Competition | Fit with Cedarline | Assessment |
|---|---|---|---|---|---|
| Expedition enthusiasts | About 16 % | High | Strong specialist brands | Good: technical products, credibility | Core target |
| Weekend trail families | About 34 % | Moderate | Many mid-market rivals | Good: broad range, stores | Core target |
| Urban style buyers | About 28 % | High for style | Fashion brands | Weak: design is not a strength | Serve selectively |
| Value basics | About 22 % | Low | Discount and mass retailers | Poor: costs too high | Do not target |
Cedarline's recent history shows what happens without a targeting decision. To chase growth it ran promotions that attracted value basics, whose loyalty lasts only until the next discount, while its fashion-led collections tried to win urban style buyers from brands with far stronger design credentials. Both moves diluted its standing with the two segments that valued what it did best. The targeting table makes the choice explicit: concentrate on expedition enthusiasts and weekend trail families, serve urban style buyers with the technical products they already buy for their look, and stop competing for value basics on price.
Firms can follow several targeting strategies. An undifferentiated strategy ignores segment differences and offers one product to all. A differentiated strategy serves several segments with distinct offers, as car makers do with brands and models at different price points. A concentrated strategy focuses on one segment, common for small firms and new entrants, which can win by serving a niche better than larger rivals can. Micromarketing tailors offers to local markets or individuals. Dr. Lindqvist warns about one ethical limit: targeting groups who are especially vulnerable to harm, such as children, people in financial distress or people with addictions, calls for particular care, and some of it is restricted by law.
In the United States, the Children's Online Privacy Protection Act requires verifiable parental consent before collecting personal information from children under 13 online, and the FTC strengthened its COPPA rule in 2025. Advertising to children is also reviewed by the Children's Advertising Review Unit of BBB National Programs, an industry self-regulatory body, and several states have passed laws on the design of online services used by minors.
Positioning
Positioning is the act of designing the firm's offer and image to occupy a distinctive place in the minds of the target customers. Kevin Lane Keller, Brian Sternthal and Alice Tybout described it in three parts. The frame of reference tells customers what category or goal the brand competes in, so they know what to compare it with. Points of parity are the attributes on which the brand must be at least as good as competitors to be considered at all. Points of difference are the attributes on which it is distinctively better, which customers value and believe the brand can deliver. A positioning fails if it lacks parity on something customers regard as essential, or if its point of difference is not valued, not credible or easily copied.
Managers often summarize the positioning in a statement for internal use: for a target customer who has a particular need, the brand is a frame of reference that delivers a point of difference, because of a reason to believe. The statement is not advertising copy; it is a discipline. Writing it forces a choice of target and a single, defensible claim. Many statements fail the test because they claim everything: best quality, best service and lowest price.
A perceptual map shows how customers see the brands in a category on the dimensions that matter most to them, usually two at a time. It can be drawn from survey ratings or from statistical techniques that infer the dimensions from customers' judgments of similarity. Gaps on the map may suggest an unserved position, though a gap may also mean nobody wants that combination. Dr. Lindqvist draws one for outdoor apparel from Cedarline's brand tracking survey, using invented names for its competitors.
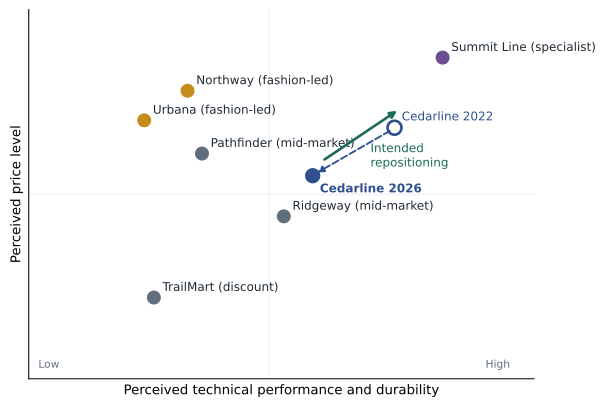
The map shows Cedarline's problem in one picture. In fiscal 2022 customers saw it as a technical brand at an upper-middle price, slightly below the leading specialist and well above the mass market. By fiscal 2026 it had drifted toward the center of the map, seen as less technical and cheaper, close to several mid-market rivals. The cohort's proposed positioning statement reads: for people who spend their weekends and holidays outdoors and depend on their gear, Cedarline is the outdoor outfitter whose clothing and equipment are built to last for years of hard use, because every product is tested on long trails and backed by lifetime repairs. The point of difference is durability, which the conjoint study in lesson 3 suggested customers value; the reason to believe is testing and the repair service; the points of parity are warmth, weather protection and fit.
Worked problem
Repositioning Kestrel
Kestrel's research shows two kinds of mid-sized chains. About 60 percent have centralized data teams and want forecasts that integrate with their own systems and planning processes. The other 40 percent, typically family-owned chains of 50 to 120 stores, lack data teams and want results without technical work, as Kestrel's small customers did. Enterprise software vendors dominate the first group. How should Kestrel segment, target and position?
Show solution
- Segment by needs and capabilities rather than size: chains with data teams, chains without, and small independents.
- Assess fit: Kestrel's strength is fast, automatic setup for firms without technical staff, which matches small independents and chains without data teams and does not match chains with data teams, who want integration.
- Target: keep small independents as the core and add chains without data teams as a second segment; stop pursuing chains with data teams until the product supports their needs.
- Position for the new segment: for growing regional chains without a data team, Kestrel is the forecasting service that delivers better stock levels within weeks, because it sets itself up from the systems the chain already uses and is supported by retail analysts rather than software engineers.
Answer: Kestrel's growth problem is a targeting problem. By choosing chains whose needs match its strength, Leo can shorten sales cycles and reduce failed pilots without a larger sales team, and the positioning statement tells product, sales and marketing teams what to build and say.
Common mistakes
MistakeSegment by demographics because the data are easy to get.
InsteadSegment by needs and behavior, then describe the segments demographically to reach them.
MistakeThe biggest segment is the best target.
InsteadAttractiveness must be weighed against the firm's fit and competition in the segment.
MistakeA positioning should claim every advantage.
InsteadChoose a single valued, credible and defensible point of difference, with parity on essentials.
MistakeA gap on a perceptual map is an opportunity.
InsteadA gap may reflect a combination that customers do not want; test demand before moving into it.
Summary and key terms
- Segmentation groups customers with similar needs and responses; targeting chooses which groups to serve; positioning defines how the offer should be seen.
- Needs-based and behavioral variables usually segment best; demographic and geographic variables help reach segments.
- Good segments are measurable, substantial, accessible, differentiable and actionable.
- Cluster analysis such as k-means can identify segments from data, after standardizing variables.
- Positioning combines a frame of reference, points of parity and points of difference, supported by a reason to believe.
- Segmentation
- Dividing a market into groups of customers with similar needs and responses to marketing.
- Benefit segmentation
- Grouping customers by the benefits they seek from a product.
- k-means clustering
- An algorithm that assigns observations to the nearest of k centers and updates the centers until stable.
- Point of difference
- An attribute on which a brand is distinctively better, valued and credible.
- Perceptual map
- A chart of how customers perceive brands on key dimensions.
- COPPA
- The federal law requiring verifiable parental consent before collecting personal information from children under 13 online.
Practice problems
Work each problem on paper first, then reveal the answer to check.
Give one needs-based and one demographic variable for segmenting buyers of running shoes.
Show answer
Needs-based: injury prevention, speed or style; demographic: age or income.
Why should variables be standardized before k-means clustering?
Show answer
So that variables measured in large units do not dominate the distance calculations.
A segment is large and profitable but customers in it do not respond differently to any marketing action. Which criterion does it fail?
Show answer
Differentiable (and therefore actionable).
Write a point of parity and a point of difference for a budget airline.
Show answer
Parity: safety and on-time performance; difference: the lowest fares on its routes.
Lesson quiz · 5 questions
Score 60% or more to complete this lesson.
Create a free account to save your progress, take quizzes and earn a certificate.