
HSE-351 · Lesson 8 of 12 · 22 min
Inventory reconciliation and leak detection
A tank that is leaking slowly gives very few signs. There is no puddle, no smell at first and no alarm if the leak is below what the sensors can see. But fuel that leaks out of a tank is fuel that was paid for and never sold, and careful records will show it as a shortfall that grows day after day. Inventory reconciliation is the oldest leak detection method there is: comparing how much fuel the records say should be in the tank with how much is actually there.
This lesson explains how daily inventory records are kept, how they are reconciled, what the numbers mean and when a shortfall must be investigated. It also explains how inventory records fit with the other leak detection methods from Lesson 7.
Book inventory and measured inventory
Every day, for each tank, the station works out two numbers:
- Book inventory: what the records say should be in the tank. It starts with yesterday's measured volume, adds any fuel delivered today and subtracts the fuel sold through the dispensers, as counted by the dispenser meters or the point-of-sale system.
- Measured inventory: what is actually in the tank, measured by the tank gauge (or, if the gauge is out of order, with a gauge stick and the tank's chart).
The difference between them is the daily variance, often called over or short. A tank that is tight and well measured will show small variances that go both ways: a little over one day, a little short the next. They come from rounding, meter accuracy, temperature changes and measuring error, and over a month they mostly cancel out.
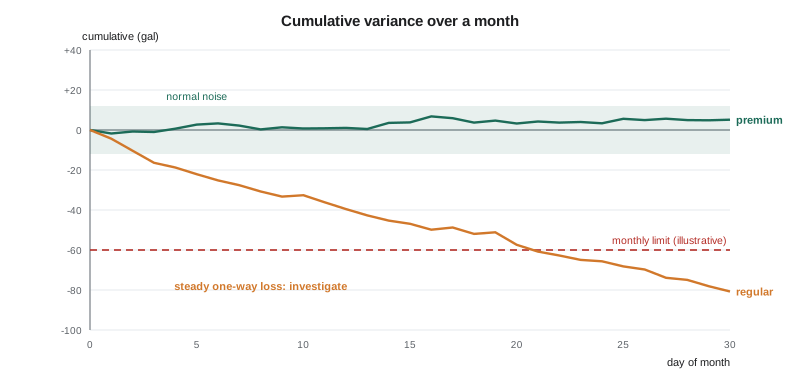
A leak looks different. It is a shortfall that keeps going the same way, day after day. On any one day it may be small enough to look like ordinary noise, but added up over weeks it grows steadily. That is why the daily numbers are added into a running, or cumulative, variance, and why the trend matters more than any single day.
Doing the daily reconciliation
At Northfield, Leah Morin or Raj Patel does the reconciliation every morning from the tank gauge's inventory report and the point-of-sale fuel sales report. Under EPA's UST rule, inventory control, where it is used as part of release detection, must detect a release of at least 1.0% of the flow-through plus 130 gallons on a monthly basis (checked in 2026). Most stations today rely on the tank gauge's monthly leak test or interstitial monitoring as their main method and keep inventory records as a second line of defense. Northfield's procedure also says to investigate if the variance shows a steady loss for more than a week, even if the monthly limit has not been reached.
Good reconciliation depends on good data. The common sources of error are:
- Deliveries recorded with the wrong volume or to the wrong tank, or not at all.
- Readings taken at different times of day from the sales report, so some sales are counted on the wrong day.
- Dispenser meters out of calibration, which make every sale look slightly bigger or smaller than it was.
- Temperature: fuel delivered warm in summer shrinks in the cool ground; many gauges report temperature-corrected volumes to allow for this.
- Water in the tank counted as fuel. The gauge measures water separately; if it is not working, a stick with water-finding paste shows the water level.
- Fuel used for testing the dispensers, or pumped back into the tank after a meter check, that is not recorded.
When a variance looks wrong, the first step is to check the data: the delivery tickets, the sales report and the gauge readings for the days in question. Many apparent losses turn out to be a delivery recorded on the wrong tank. If the data are correct and the loss is still there, the station treats it as a possible leak.
Reconciliation in code
The program below reconciles a month of illustrative daily readings for one tank. It works out the daily and cumulative variance, compares the month with the limit and checks for a steady one-way trend by counting the days the tank was short.
import random
random.seed(8)
# Illustrative month for the 13,200 gal regular tank; all figures made up.
days = 30
sold = [round(random.uniform(1370, 1800)) for _ in range(days)]
delivered = [8400 if d in (6, 16, 26) else 0 for d in range(days)]
leak_per_day = 2.4                         # hidden loss we are trying to find
measured = 6300.0
cumulative, short_days, rows = 0.0, 0, []
for d in range(days):
    book = measured + delivered[d] - sold[d]
    measured = book - leak_per_day + random.gauss(0, 1.5)  # gauge noise
    variance = measured - book
    cumulative += variance
    short_days += variance < 0
    rows.append((d + 1, round(variance, 1), round(cumulative)))

total_sold = sum(sold)
limit = 0.01 * total_sold + 130             # EPA inventory control: 1% + 130 gal
print("Day  variance  cumulative (gal)")
for r in rows[::5]:
    print(f"{r[0]:>3} {r[1]:>9} {r[2]:>11}")
print(f"Month: sold {total_sold:,} gal, cumulative {cumulative:,.0f} gal, limit -{limit:,.0f} gal")
print(f"Short on {short_days} of {days} days")
trend = short_days >= 22
if cumulative < -limit:
    print("OVER LIMIT: investigate and report as a suspected release")
elif trend:
    print("Within the monthly limit, but a steady one-way loss: investigate")
else:
print("Within normal variation")Day variance cumulative (gal) 1 -4.6 -5 6 -2.0 -15 11 -4.5 -24 16 0.0 -36 21 -3.5 -43 26 -1.6 -58 Month: sold 46,711 gal, cumulative -65 gal, limit -597 gal Short on 27 of 30 days Within the monthly limit, but a steady one-way loss: investigate
In this example the leak is only about 2.4 gallons a day, a tiny fraction of the 1,500 gallons sold each day, so no single day looks alarming, and the month's loss is still inside the federal 1% plus 130 gallon limit. But the tank was short on almost every day of the month, which is the signature of a leak. A leak of 2.4 gallons a day is nearly 900 gallons a year going into the ground, which is why Northfield investigates trends and does not just wait for the monthly limit.
Other leak detection methods
Inventory reconciliation is one of several methods, and each catches different things:
| Method | What it detects | Strengths and limits |
|---|---|---|
| Inventory control | Steady losses from the tank and piping | Cheap and uses data the station already has; limited as a stand-alone method under EPA rules |
| Automatic tank gauge test | Leaks of 0.2 gph or more from the tank (monthly) | Automatic and precise; needs quiet periods and only tests the tank itself |
| Statistical inventory reconciliation (SIR) | Small steady losses, by analyzing inventory data statistically | Done by a specialist company from the station's records; needs complete, accurate data |
| Interstitial monitoring | Liquid in the space between the walls of a double-walled tank or pipe | Very sensitive and continuous; required for new systems since 2016 |
| Containment sump sensors | Liquid in turbine and dispenser sumps | Catch leaks from fittings early; need testing |
| Line leak detectors and line tests | Leaks of 3 gph from pressurized piping, plus smaller leaks in periodic tests | Fast response to large leaks; periodic tests find smaller ones |
| Groundwater or vapor monitoring | Fuel or vapor in the ground near the tanks | Find fuel already in the ground; allowed only where site conditions suit |
What to do when the numbers say leak
Under EPA's rule, unusual operating conditions, such as an unexplained loss of product or a failed release detection result, are suspected releases. A suspected release must be reported to the state agency within 24 hours (or the period the state sets) and then investigated by checking the data, testing the system and checking the site; Montana DEQ requires suspected UST releases to be reported regardless of volume (Lesson 9). If the investigation confirms a release, the owner must take the steps the rule sets out for release response and corrective action. Not reporting a suspected leak because "it's probably the meters" is the kind of decision that turns a small repair into a large cleanup.
For supervisors: the reconciliation habit
Do the reconciliation every day, at the same time, from the same reports, and sign it. Review the cumulative variance for each tank every week, not just at the end of the month, and look at the trend. Check every delivery ticket against the gauge's delivery report the same day. Have the dispenser meters calibrated on schedule. Keep the records for as long as the rules require, and send them to a SIR company if the station uses one. Most importantly, if the numbers keep saying short, believe them until the cause is found.
Worked problem
A slow loss in the premium tank
Raj Patel notices that the premium tank has been short on 9 of the last 10 days, by 1 to 4 gallons a day. The cumulative shortfall for the month is 25 gallons, below the monthly limit. The tank gauge's last monthly leak test passed. What should he do?
Show solution
- Check the data: are the premium deliveries recorded to the right tank? Do the sales report and gauge readings cover the same period? Raj finds no errors.
- Look at the trend: 9 short days out of 10 is not normal noise, even though the total is below the trigger. Northfield's procedure says to investigate a steady loss.
- Tell Leah Morin, who asks the gauge to run an extra leak test and checks the sump alarms and the premium dispensers for drips. The leak test passes again.
- Because the loss continues, Leah calls the contractor to test the premium piping. They find a slow leak at a fitting in the dispenser sump that had been draining away through a crack in the sump floor.
- The leak is repaired, the sump replaced and the release reported and investigated as the rules require. The tank gauge test passed because the leak was in the piping, not the tank: a good example of why several methods are used together.
Answer: Check the data, take the steady trend seriously even below the trigger, investigate with extra tests and the contractor, and report what is found.
When the gauge is out of order
If the tank gauge fails, the station still has to keep inventory records, so the tanks are measured by hand with a gauge stick: a long wooden or fiberglass rod marked in inches, lowered through the fill pipe or a gauging port to the bottom of the tank. The wet mark on the stick shows the fuel depth, and the tank's calibration chart turns that depth into gallons. A stick reading is much less precise than the gauge, so small variances will be bigger and noisier until the gauge is repaired. Stick readings are taken at the same time every day, with no deliveries or sales in progress, and only by a worker trained to do it: the fill area is a vapor zone, and the stick must be lowered gently so it does not splash or make sparks.
A gauge that is out of order also means its leak tests and alarms are not working. That is a gap in leak detection, and the manager must arrange the repair quickly and record how the tanks were monitored in the meantime.
Water in the tank
A little water at the bottom of a tank is common: it comes from condensation and from deliveries. A water level that rises when it has not rained, or rises after every rain or snowmelt, can mean that water is getting in through a loose fill cap, a damaged spill bucket or a hole in the tank. Anywhere water can get in, fuel can get out. The gauge reports water in each tank; the daily record should include it, and a rise should be reported to the manager just like a fuel loss.
Common mistakes
MistakeLooking only at today's variance.
InsteadTrack the cumulative variance and the trend.
MistakeAssuming losses are meter errors without checking.
InsteadCheck the data, then investigate; a steady loss may be a leak.
MistakeRecording deliveries late or to the wrong tank.
InsteadCheck every delivery ticket against the gauge the same day.
MistakeCounting water in the tank as fuel.
InsteadUse the gauge's water reading or water-finding paste.
MistakeRelying on one leak detection method.
InsteadUse reconciliation, gauge tests, sensors and line tests together.
Summary and key terms
- Book inventory is what records say should be in the tank; measured inventory is what is there.
- Daily variances from noise go both ways; a leak shows as a steady one-way loss.
- EPA inventory control must detect 1% of flow-through plus 130 gallons a month; Northfield also investigates week-long trends.
- Check the data first; many apparent losses are recording errors.
- Several leak detection methods are used together because each catches different leaks.
- An unexplained loss is a possible leak that must be followed up and, if confirmed, reported.
- Book inventory
- The volume the records say should be in the tank.
- Measured inventory
- The volume actually measured in the tank.
- Variance
- The difference between measured and book inventory; over or short.
- Cumulative variance
- The running total of daily variances over a period.
- Statistical inventory reconciliation (SIR)
- A statistical analysis of inventory records to detect small leaks.
- Water-finding paste
- A paste on a gauge stick that changes color where it touches water.
Practice problems
Work each problem on paper first, then reveal the answer to check.
How is book inventory worked out?
Show answer
Yesterday's measured volume plus deliveries minus sales.
What does a leak look like in the variance records?
Show answer
A steady one-way shortfall that grows over time.
Name three common sources of error in reconciliation.
Show answer
For example, deliveries recorded wrongly, mismatched reading times, meter calibration, temperature, water counted as fuel, or unrecorded test fuel.
What is the EPA monthly limit for inventory control?
Show answer
1.0% of flow-through plus 130 gallons.
What should be done first when a variance looks wrong?
Show answer
Check the data: delivery tickets, sales report and gauge readings.
Why might a tank gauge test pass while the station is losing fuel?
Show answer
The leak may be in the piping or below the test threshold.
What should a supervisor review every week?
Show answer
The cumulative variance and trend for each tank.
Lesson quiz · 5 questions
Score 60% or more to complete this lesson.
Create a free account to save your progress, take quizzes and earn a certificate.