
GEOM-440 · Lesson 12 of 12 · 21 min
Reproducible workflows
A year after the analytics program began, an auditor from the board's finance committee asked a simple question: the lining of the first leaking reach was justified by a map in last spring's report; could the firm show how that map was made, and would it come out the same today? Leah's first rule from lesson 1 now paid for itself. Theo checked out the version of the code tagged for that report, recreated its software environment from the recorded file, pointed it at the archived inputs and ran it. Forty minutes later the map came out identical, down to the last cell. This lesson is about building that kind of work: analyses that can be rerun, checked and trusted, and that respect the people whose data they use. It ends with the program's year-end delivery to the district.
What reproducible means
An analysis is reproducible if someone else, or the same analyst later, can obtain the same results from the same data and code. It is replicable if a new study with new data reaches the same conclusions. Reproducibility is the floor: if a result cannot be regenerated, nobody can check it, and errors survive. Studies of published research in many fields have found that a large share of results could not be reproduced from the materials provided, usually not from fraud but from missing steps, unrecorded software versions and manual edits. Geospatial work adds its own traps: coordinate transformations that change between PROJ versions, datum grids that are updated, and data downloaded from services that change without notice.
Four ingredients make an analysis reproducible: the code, under version control; the computational environment, recorded exactly; the data, archived with their provenance; and the workflow, written down as a pipeline rather than as a sequence of clicks. None is difficult on its own. The discipline is in doing all four every time.
Version control
Git records every change to a set of files, with who made it, when and why. The program's code lives in a repository on the firm's server, mirrored to a hosted service, with one branch for each piece of work and a review before anything merges into the main branch. Each report to the district is tagged, so that the exact code behind it can be recovered, as the auditor's question required. Data are not stored in Git, which is built for text; large files go into object storage or a data versioning tool, and the repository records which version of each dataset each analysis used.
Commit messages are a record for the future. 'Fix bug' tells nobody anything in a year; 'Use intersects instead of within for turnout join; 7 turnouts on field boundaries were dropped' tells the auditor exactly what changed and why the numbers moved.
Environments
Lesson 1 introduced environments. For reproducibility, the file that lists packages must pin exact versions, and ideally the full set of dependencies, so that the same environment can be rebuilt later. Tools such as conda-lock or pip-tools produce such lock files. Containers go further, capturing the operating system libraries too, and suit pipelines that run on servers or in the cloud. The PROJ data files, with their transformation grids, belong in the record: the same code with a newer grid can move coordinates by centimeters, which is a correct improvement but must not happen silently in the middle of a monitoring series.
Pipelines and provenance
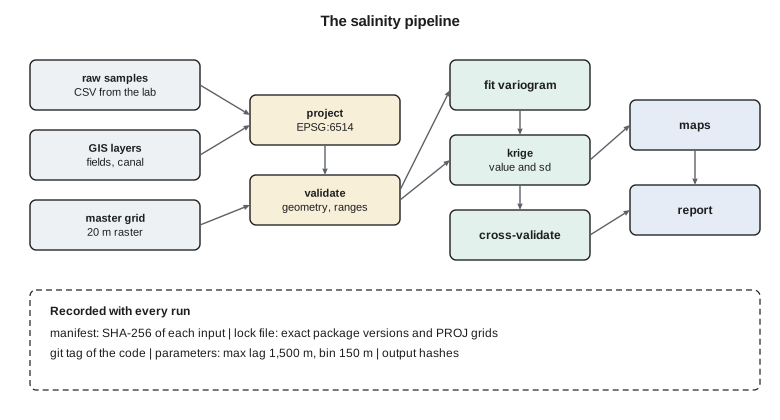
A pipeline is a declared set of steps, each with inputs and outputs, from raw data to final products. Tools such as Make, Snakemake and workflow managers in the cloud read that declaration, work out the order, run only the steps whose inputs have changed and record what they did. The program's pipeline has about thirty steps: load the GIS layers, validate geometry, project to the master system, build the field table, fit the variogram, krige, cross-validate, map, write the report. When a new soil sample arrives, the pipeline reruns only the steps downstream of the samples.
Provenance is the record of where each dataset came from and what was done to it: the source, the date retrieved, the version, the processing steps and their parameters. Metadata standards, such as ISO 19115 met in GEOM-330, describe datasets for discovery; provenance records describe the chain of processing. A simple and effective practice is a manifest: a file listing every input with a cryptographic hash of its contents, so that any later change to an input, however small, is detectable.
# Snakefile: part of the salinity pipeline (Snakemake)
rule project_samples:
    input:  "raw/ece_samples_2026.csv"
    output: "work/ece_samples_2026.gpkg"
    shell:  "python scripts/project_samples.py {input} {output} --crs EPSG:6514"

rule variogram:
    input:  "work/ece_samples_2026.gpkg"
    output: "work/variogram_2026.json"
    params: max_lag=1500, bin_width=150
    shell:  "python scripts/fit_variogram.py {input} {output} --max-lag {params.max_lag} --bin {params.bin_width}"

rule krige:
    input:  samples="work/ece_samples_2026.gpkg", model="work/variogram_2026.json", grid="ref/master_grid_20m.tif"
    output: "out/ece_2026.tif", "out/ece_sd_2026.tif"
    shell:  "python scripts/krige.py {input.samples} {input.model} {input.grid} {output}"
Notebooks and reports that rebuild themselves
Notebooks are where much spatial analysis begins, and they are notorious for hidden state: cells run out of order, variables defined in a cell since deleted, results that depend on what the analyst happened to do that afternoon. Three habits make them reproducible. Restart and run all cells from the top before saving any result. Keep the notebook thin, calling functions from tested modules rather than holding the logic itself. And treat a notebook that produces a reported number as a script in disguise: once its job is settled, move it into the pipeline or run it from the pipeline with fixed parameters.
Reports themselves can be built by the pipeline. Literate programming tools, such as Quarto or Jupyter Book, weave text, code and output into a document, so that every number and map in a report is regenerated when the data change. The program's monthly report to Marta is built that way: the text of the commentary is written by Leah, but the tables, maps and figures in it are never pasted by hand. When a late soil result arrived last June, the whole report rebuilt in minutes, and the only edit a person had to make was a sentence about what had changed.
Testing analytical code
Code that produces numbers for decisions needs tests, just as survey computations need checks. Unit tests confirm that functions do what they claim on small cases with known answers: the shoelace area of a unit square is 1; the kriging weights sum to one; the projection of a control point matches its published coordinates within a millimeter. Regression tests compare a whole pipeline's outputs on a frozen dataset with stored results and fail if anything changes unexpectedly. The worked examples throughout this course, with answers checked by hand, are exactly the material such tests are made from.
Licenses and open data
Data come with terms. Data produced by US federal agencies, such as Landsat imagery and the National Map, are generally in the public domain, and many state datasets, including those from the Montana State Library, are free to use with attribution under their published terms. Other datasets are licensed more restrictively, or provided under agreements, as with the cooperating growers' yield records. The program's data register records the terms of every dataset, and the pipeline's outputs inherit the most restrictive terms of their inputs. Code has licenses too: the open-source libraries the program depends on carry licenses that permit use but set conditions, and the firm checks them before shipping code to the district.
Location privacy and ethics
Location data can identify people even when names are removed. A complaint at a farmhouse, a yield record for a field, or a GPS track of a ditch rider's day points to one person. Montana's Consumer Data Privacy Act, in force since October 2024 and amended in 2025, treats precise geolocation data as sensitive personal data; it applies to many businesses rather than to public bodies such as the district, but its principles match good practice, and the district's own records policies and the state's public records law govern what it must release. The program's practice is to minimize: collect only what is needed, publish aggregates rather than points, suppress small counts, and keep identified data on the district's systems under access control.
Aggregation has a trade-off with the modifiable areal unit problem: units large enough to protect privacy may be too large to show the pattern. Displacing points by random offsets, called geomasking, keeps patterns at coarse scales while preventing re-identification at fine ones, but it degrades analyses such as nearest neighbor statistics, so masked data should be used only for publication, never for the analysis itself. The code below computes a provenance manifest for a set of inputs, shows how a one-character change is detected, and prepares published counts of complaints by section with small counts suppressed.
import hashlib, json

# 1. A provenance manifest: hash every input
inputs = {"raw/ece_samples_2026.csv": b"id,x,y,ece\nS001,382410.2,5506120.7,2.81\nS002,382980.5,5506355.1,3.40\n",
          "raw/complaints_2016_2026.csv": b"id,date,x,y,type\nC0001,2016-06-02,380115.0,5507021.0,seepage\n",
          "ref/master_grid_20m.tif": b"(binary raster bytes)"}
def manifest(files):
    return {k: hashlib.sha256(v).hexdigest()[:16] for k, v in sorted(files.items())}
m1 = manifest(inputs)
print(json.dumps(m1, indent=1))
inputs["raw/ece_samples_2026.csv"] = inputs["raw/ece_samples_2026.csv"].replace(b"2.81", b"2.18")   # a typo
m2 = manifest(inputs)
print("changed inputs:", [k for k in m1 if m1[k] != m2[k]])

# 2. Publish complaint counts by section with small-count suppression
counts = {"S10": 14, "S11": 3, "S12": 22, "S13": 1, "S14": 7, "S15": 0, "S16": 4}
K = 5
pub = {s: (c if c == 0 or c >= K else "<5") for s, c in counts.items()}
print("published:", pub)
total = sum(counts.values())
print(f"published total {total}; suppressed sections {sum(1 for v in pub.values() if v == '<5')}")
if sum(1 for v in pub.values() if v == "<5") == 1:
print("one suppressed cell could be recovered from the total; suppress a second cell"){
"raw/complaints_2016_2026.csv": "4f21bd0afffd8a56",
"raw/ece_samples_2026.csv": "14705e27f406dafa",
"ref/master_grid_20m.tif": "5d63cc8d84c5d51e"
}
changed inputs: ['raw/ece_samples_2026.csv']
published: {'S10': 14, 'S11': '<5', 'S12': 22, 'S13': '<5', 'S14': 7, 'S15': 0, 'S16': '<5'}
published total 51; suppressed sections 3The manifest gives each input a fingerprint. Changing one digit in one sample, 2.81 to 2.18, changes that file's hash completely, and the comparison flags it, so a pipeline can refuse to run, or at least warn, when an input has changed since the last approved run. The suppression step replaces counts of 1 to 4 with a symbol, and leaves zeros, which reveal nothing about any person. Three sections are suppressed here. Had only one been suppressed, it could be recovered by subtracting the published counts from the published total, which is why statistical agencies apply complementary suppression; the code checks for that case.
Worked problem
Recovering a suppressed cell
Four sections have published complaint counts of 12, <5, 9 and 15, and the published total is 39. What can a reader infer, and how should publication change?
Show solution
- \[\text{suppressed} = 39 - (12 + 9 + 15) = 3\]
- The single suppressed value is exactly recoverable, so suppression has failed; suppress a second section, or publish the total rounded, or aggregate sections.
Answer: The hidden count is 3. Suppress a second cell or round the total so that no cell can be recovered.
Coulee Geomatics: the year-end delivery
The program's year-end delivery to the district is not a report but a working system. The repository holds the code for every analysis in this course, with tests, a lock file for the environment and a pipeline that rebuilds every product from raw inputs. The data register lists 46 datasets with their sources, licenses, coordinate systems, update frequency and contact. Each product, from the seepage cluster maps to the boundary model, has a one-page method note in plain language, a version number and the manifest of the inputs it used. The board receives the one-page summaries of lesson 11; the district's new analyst, hired to take the program over, receives a week of training and the keys to the repository.
Marta's last question at the handover is what happens when the firm is no longer involved. Leah's answer sums up the course. The methods are standard and documented, the code is open to the district and runs on free software, the data are in open formats with recorded provenance, and every number can be regenerated by someone who was not there when it was first produced. The district does not depend on any one person's memory, including hers. Ruth signs the transmittal, and the auditor's question becomes the first entry in the new analyst's test suite.
Common mistakes
MistakeEditing results by hand after the code has run.
InsteadMake every change in code, so the pipeline regenerates it.
MistakeRecording package names without versions.
InsteadPin exact versions in a lock file, including the PROJ data files.
MistakePublishing point locations of complaints or yields.
InsteadAggregate, suppress small counts and use geomasking only for publication.
MistakeIgnoring data licenses when combining datasets.
InsteadRecord every license and apply the most restrictive terms to outputs.
Summary and key terms
- Reproducibility needs version-controlled code, recorded environments, archived data with provenance and declared pipelines.
- Tag the code behind every report so it can be recovered exactly.
- Pipelines rerun only steps whose inputs changed and record what they did.
- Hash manifests make any change to inputs detectable.
- Test analytical code with unit and regression tests built from worked examples.
- Respect licenses and location privacy: minimize, aggregate, suppress and control access.
- Reproducibility
- Obtaining the same results from the same data and code.
- Version control
- Recording every change to files with author, time and reason.
- Lock file
- A file pinning the exact versions of all packages in an environment.
- Provenance
- The record of a dataset's origin and processing.
- Manifest
- A list of inputs with cryptographic hashes of their contents.
- Geomasking
- Displacing point locations to protect privacy while keeping coarse patterns.
Practice problems
Work each problem on paper first, then reveal the answer to check.
What is the difference between reproducibility and replicability?
Show answer
Reproducibility regenerates results from the same data and code; replicability reaches the same conclusions with new data.
Why should PROJ data grids be recorded in the environment?
Show answer
Updated grids can shift transformed coordinates and change results silently.
What does a hash manifest detect?
Show answer
Any change to the contents of an input file, however small.
Why are zeros not suppressed in published counts?
Show answer
A zero identifies nobody.
Why must geomasked data not be used for analysis?
Show answer
Masking distorts distances and patterns at fine scales, biasing the analysis.
Lesson quiz · 5 questions
Score 60% or more to complete this lesson.
Create a free account to save your progress, take quizzes and earn a certificate.