
CON-430 · Lesson 5 of 12 · 29 min
Operational energy and carbon
Operational carbon is emitted every year a building is used, for as long as it stands. It depends on how much energy the building needs (set mainly by its envelope, ventilation and internal loads), how efficiently its systems deliver that energy, and the carbon intensity of the fuels and electricity it uses. Builders affect all three: the envelope they build determines heat loss and air leakage, the quality of mechanical installation and commissioning decides whether systems perform as designed, and their advice on fuel choice and electrification shapes the building's emissions for decades. This lesson covers the measures a builder needs to understand, from energy use intensity and heat loss to heat pumps and grid factors. Detailed HVAC design belongs to the architecture and engineering courses; CON-111 covered the building science of heat, air and moisture, which this lesson applies.
Energy use intensity
Energy use intensity (EUI) is a building's annual energy use divided by its floor area, in thousand British thermal units per square foot per year (kBtu/ft²·yr) in the United States. It is the most common way to compare buildings of different sizes and to set targets; one kBtu/ft²·yr equals about 3.15 kWh/m²·yr. Site EUI counts the energy delivered to the building, as shown on utility bills; source EUI, used by ENERGY STAR Portfolio Manager, accounts for the energy lost in generating and delivering it. A typical existing multifamily building in the US might have a site EUI of 60 to 90 kBtu/ft²·yr, while a new building designed to a high-performance standard might use 20 to 40. Related metrics include heating demand intensity, the annual heating energy needed per square foot regardless of the system, and greenhouse gas intensity, annual emissions per square foot, which building performance standards such as New York City's Local Law 97 regulate.
Degree days measure how cold or hot a climate is. Heating degree days (HDD) add up, for each day of the year, how far the average outdoor temperature falls below a base temperature. Annual heat loss through the envelope is roughly proportional to HDD, so a building in a colder climate needs a better envelope to achieve the same heating demand.
In the United States, HDD are calculated from a base of 65 °F and expressed in °F·days. Atlanta has about 2,800 HDD, Cleveland and Chicago about 6,000 to 6,500, Minneapolis about 7,500 and Fairbanks more than 13,000, and the IECC and ASHRAE 90.1 use HDD with cooling degree days to define climate zones. Cedar Row's climate has about 6,480 HDD, equal to 3,600 °C·days.
Envelope heat loss
Heat flows through the envelope by conduction through walls, roofs, floors and windows, and by air flowing through leaks and ventilation. The conduction heat loss of each element is the product of its thermal transmittance (U-value), its area and the temperature difference across it.
Here \(Q\) is the heat flow in Btu per hour, \(U\) is the U-factor in Btu/h·ft²·°F, \(A\) is the area in square feet and \(\Delta T\) is the inside-outside temperature difference in °F. The U-factor is the inverse of the total R-value (h·ft²·°F/Btu); a wall with an effective R-value of 20 has a U-factor of about 0.05. Adding all the U × A products and the air-flow terms (1.08 × cfm for sensible heat) gives the building's heat loss coefficient (UA) in Btu/h·°F. Multiplying UA by HDD and 24 hours gives the annual heat loss in Btu.
Effective values matter. Nominal insulation values overstate performance because studs, slab edges, balcony connections, window frames and fasteners create thermal bridges. Linear thermal bridges, such as slab edges, are characterized by a psi value per unit length, and point bridges, such as cladding anchors, by a chi value. In concrete buildings with exposed slab edges and cantilevered balconies, thermal bridges can add 20 to 50 % to the opaque wall heat loss; thermal breaks and continuous exterior insulation reduce this.
# Cedar Row heat loss and annual heating demand (US units, illustrative)
perimeter, floors, story_h, plate = 558.0, 8, 10.2, 11300.0  # ft, -, ft, ft2
wall_gross = perimeter * floors * story_h                    # ft2
wwr = 0.40
win = wall_gross * wwr
opaque = wall_gross - win
volume = plate * floors * story_h                            # ft3
parts = {                                                    # heat loss coefficient, Btu/(h F)
    'Opaque walls (U 0.049)': opaque * 0.049,
    'Windows (U 0.25)':       win * 0.25,
    'Roof (U 0.028)':         plate * 0.028,
    'Floor over garage':      plate * 0.044 * 0.5,           # garage runs about half the delta T
    'Slab-edge bridges':      perimeter * floors * 0.173,    # psi 0.173 Btu/(h ft F)
    'Air leakage (ACH50 2)':  1.08 * (2.0 / 20) * volume / 60,
    'Ventilation, HRV 75 %':  1.08 * 6360 * (1 - 0.75),      # 6,360 cfm supply
}
ua = sum(parts.values())
for k, v in parts.items():
    print(f"{k:24s} {v:7,.0f} Btu/h-F  {v / ua:5.1%}")
hdd = 6480                                                   # degree F-days, base 65 F
gross = ua * hdd * 24 / 1e6                                  # MMBtu per year
net = gross * (1 - 0.30)                                     # 30 % offset by internal and solar gains
print(f"Total UA {ua:,.0f} Btu/h-F; gross heat loss {gross:,.0f} MMBtu/yr; "
      f"net heating {net:,.0f} MMBtu/yr ({net * 1e6 / 3412 / 1000:,.0f} MWh)")
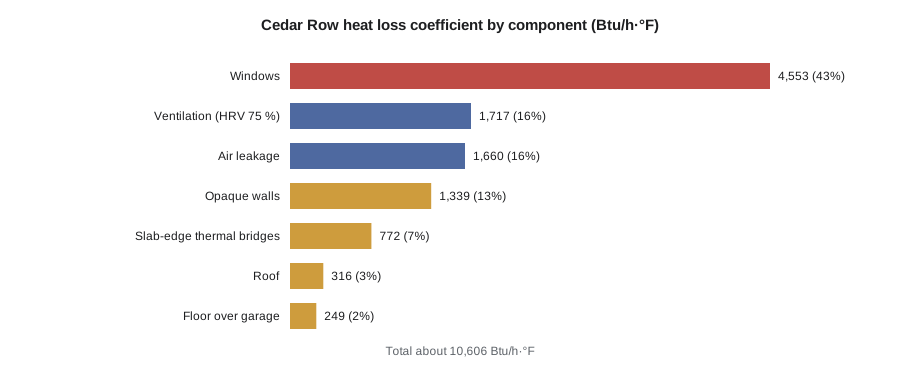
print(f"Design loss at -4 F outside, 70 F inside: {ua * 74 / 1000:,.0f} kBtu/h")Opaque walls (U 0.049) 1,339 Btu/h-F 12.6% Windows (U 0.25) 4,553 Btu/h-F 42.9% Roof (U 0.028) 316 Btu/h-F 3.0% Floor over garage 249 Btu/h-F 2.3% Slab-edge bridges 772 Btu/h-F 7.3% Air leakage (ACH50 2) 1,660 Btu/h-F 15.6% Ventilation, HRV 75 % 1,717 Btu/h-F 16.2% Total UA 10,606 Btu/h-F; gross heat loss 1,649 MMBtu/yr; net heating 1,155 MMBtu/yr (338 MWh) Design loss at -4 F outside, 70 F inside: 785 kBtu/h
The windows are by far the largest single heat loss, about 43 % of the total, even though they cover only 40 % of the wall area, because a good double-glazed window still loses heat about five times as fast as the insulated opaque wall. Air leakage and ventilation together are almost a third, and the slab-edge thermal bridges add more than half again to the opaque wall loss. After allowing 30 % of the gross loss to be offset by internal and solar gains, Cedar Row needs about 336 MWh of space heating per year.
Window-to-wall ratio
The window-to-wall ratio (WWR) is the glazed area divided by the gross exterior wall area. Large windows are popular for views and daylight, but because windows lose heat much faster than insulated walls and can cause overheating in summer, energy codes and high-performance standards push toward moderate ratios, often 30 to 40 %. The code below varies Cedar Row's WWR with double and triple glazing.
# Effect of window-to-wall ratio on Cedar Row net heating demand (illustrative)
wall_gross, u_wall, u_win = 4216, 0.28, 1.40   # m2, W/(m2 K)
other_ua = 168 + 131 + 408 + 872 + 904          # roof, floor, bridges, air leakage, ventilation (W/K)
hdd, gains = 3600, 0.30
def net_mwh(wwr, u_window=u_win):
    ua = wall_gross * (1 - wwr) * u_wall + wall_gross * wwr * u_window + other_ua
    return ua * hdd * 24 / 1e6 * (1 - gains)
base = net_mwh(0.40)
for wwr in (0.30, 0.40, 0.50, 0.60):
    print(f"WWR {wwr:.0%}: double glazing {net_mwh(wwr):4.0f} MWh ({net_mwh(wwr) / base - 1:+5.1%}), "
f"triple glazing {net_mwh(wwr, 0.90):4.0f} MWh")WWR 30%: double glazing 307 MWh (-8.5%), triple glazing 269 MWh WWR 40%: double glazing 336 MWh (+0.0%), triple glazing 285 MWh WWR 50%: double glazing 364 MWh (+8.5%), triple glazing 301 MWh WWR 60%: double glazing 393 MWh (+17.0%), triple glazing 316 MWh
Each 10-point increase in WWR adds about 8.5 % to heating demand with double glazing. Triple glazing at a 60 % WWR uses less heating energy than double glazing at 30 %, but triple glazing costs more and adds embodied carbon, and large glazed areas still increase cooling loads and overheating risk. A WWR of 30 to 40 % with good windows is usually the best balance; Lesson 10 returns to the daylight side of this trade-off.
Airtightness and ventilation
Air leakage is measured with a blower door test that pressurizes or depressurizes the building, typically to 50 or 75 pascals. Results are expressed as air changes per hour at 50 Pa (ACH50) or, for large buildings, as an air leakage rate per unit of envelope area (cfm/ft² at 75 Pa). A rough rule of thumb divides ACH50 by about 20 to estimate the average natural infiltration rate, although the true figure depends on height, exposure and wind. The 2021 and 2024 IECC require dwelling units to test at 3 to 5 ACH50 depending on climate zone, and some states and cities require whole-building testing of large buildings; Passive House requires 0.6 ACH50.
Airtightness is a construction quality issue more than a design issue. The air barrier must be continuous across every joint, penetration and transition: wall to roof, wall to window, wall to slab and around every pipe, duct and electrical box. Builders achieve airtight buildings by assigning a single party responsibility for air barrier continuity, building and testing mock-ups, inspecting before concealment and testing early (for example a floor at a time) so that leaks can still be fixed.
Once the building is airtight, ventilation must be designed and delivered intentionally. A heat recovery ventilator (HRV) or energy recovery ventilator (ERV) transfers heat (and with an ERV, some moisture) from exhaust air to incoming fresh air, recovering 60 to 85 % of the heat that would otherwise be lost. At Cedar Row, the HRV turns a 3,600 W/K ventilation loss into about 900 W/K. Ventilation rates and indoor air quality are covered in Lesson 10.
Heat pumps and system efficiency
A heat pump moves heat from a cold place to a warm place using a refrigeration cycle, rather than generating it by combustion or electric resistance. Its efficiency is measured by the coefficient of performance (COP): the heat delivered divided by the electricity used. A COP of 3 means three units of heat for each unit of electricity. COP falls as the outdoor temperature drops, so seasonal measures are used: seasonal COP (SCOP), heating seasonal performance factor (HSPF) for small systems, or annual figures from energy modeling. Modern cold-climate air-source heat pumps continue to operate at −25 °C or below, though with lower COP, and ground-source heat pumps maintain higher COPs because ground temperature is stable.
Common heat pump systems for mid-rise buildings include in-suite air-source heat pumps, variable refrigerant flow (VRF) systems, central air-to-water heat pumps with hydronic distribution, water-source heat pump loops and ground-source systems. Domestic hot water is often the hardest load to electrify, because it needs high temperatures year-round; heat pump water heaters using CO2 refrigerant are increasingly used. Lesson 2 showed that refrigerant choice and leakage matter; the system with the best COP is not always the best for carbon if it uses a large charge of high-GWP refrigerant.
From energy to operational carbon
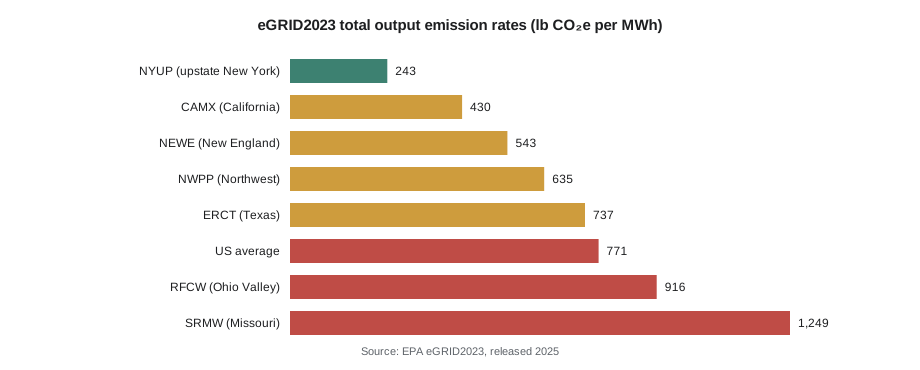
Operational carbon is each fuel's annual use multiplied by its emission factor. For electricity, the factor is the grid's, which varies widely by region and is falling over time. The code compares Cedar Row with gas boilers and with heat pumps on three different grids.
# Annual energy and operational carbon for Cedar Row: gas boilers vs heat pumps (illustrative)
heat_mwh, dhw_mwh, other_mwh = 336, 240, 462     # space heat, hot water (thermal), electric loads
area_ft2 = 90400                                  # conditioned floor area
gas_kg_per_kwh = 0.181                            # natural gas combustion, kg CO2e per kWh of fuel
def options(lb_per_mwh):
    grid_t = lb_per_mwh * 0.4536 / 1000           # t CO2e per MWh
    gas_fuel = heat_mwh / 0.90 + dhw_mwh / 0.85   # boiler and water-heater efficiencies
    hp_elec = heat_mwh / 2.8 + dhw_mwh / 2.5      # seasonal COPs
    a = (gas_fuel + other_mwh, gas_fuel * gas_kg_per_kwh + other_mwh * grid_t)
    b = (hp_elec + other_mwh, (hp_elec + other_mwh) * grid_t)
    return a, b
for grid, lb in [('NYUP', 243), ('RFCW', 916), ('SRMW', 1249)]:
    (ea, ca), (eb, cb) = options(lb)
    print(f"{grid}: gas: EUI {ea * 3412 / area_ft2:4.1f} kBtu/ft2, {ca:4.0f} t/yr | "
f"heat pump: EUI {eb * 3412 / area_ft2:4.1f} kBtu/ft2, {cb:4.0f} t/yr")NYUP: gas: EUI 42.2 kBtu/ft2, 170 t/yr | heat pump: EUI 25.6 kBtu/ft2, 75 t/yr RFCW: gas: EUI 42.2 kBtu/ft2, 311 t/yr | heat pump: EUI 25.6 kBtu/ft2, 282 t/yr SRMW: gas: EUI 42.2 kBtu/ft2, 380 t/yr | heat pump: EUI 25.6 kBtu/ft2, 384 t/yr
Heat pumps reduce Cedar Row's site EUI from about 42 to 26 kBtu/ft²·yr in every region, because they deliver about 2.5 to 2.8 units of heat per unit of electricity. The carbon result depends on the grid: on an upstate New York grid the heat pump building cuts emissions by more than half, on an Ohio Valley grid the saving is small, and on a Missouri grid it is roughly break-even today, improving as the grid gets cleaner.
Grid factors are averages, and some analysts argue that electrification decisions should use marginal factors, the emissions of the generator that responds to an extra load, which are often higher than the average, especially at winter peaks. Others argue that long-run grid plans, not today's marginal plant, should guide decisions for buildings that will last 60 years. A further consideration is peak demand: electrified heating increases winter peaks, which can require grid upgrades, so programs such as the CAGBC Zero Carbon Building Standard encourage good grid citizenship through efficiency, load management and storage.
Commissioning and performance gaps
Many buildings use more energy than their models predicted, a difference called the performance gap. Causes include construction defects (missing insulation, air leakage, thermal bridges), equipment installed or set up wrongly, controls that fight each other, occupants who use the building differently from the model's assumptions and simple modeling errors. Commissioning is the quality process that verifies systems are designed, installed, tested and operated as intended, ideally starting in design and continuing into the first year of occupancy. Builders support commissioning by scheduling functional testing, completing pre-functional checklists, fixing deficiencies quickly and providing accurate as-built documentation and training. Measurement and verification after occupancy compares actual energy use with predictions and finds problems early.
Worked problem
Heat pump or gas on Cedar Row
Harrowgate Community Housing asks Marlowe Builders whether the all-electric heat pump design is worth its higher first cost on an Ohio Valley (RFCW) grid. Use the results above and assume the grid factor falls 2 % per year.
Show solution
- Gas design: about 311 t CO2e per year; heat pump design: about 282 t per year.
- First-year saving: about 29 t CO2e, about 9 %.
- As the grid factor falls 2 % per year, the heat pump design's emissions fall each year while the gas design's direct emissions do not.
- Energy: the heat pump design uses about 440 MWh less delivered energy each year (about 1,118 versus 678 MWh).
- Other factors: gas price risk, the cost of heat pumps and electrical service upgrades, peak demand, and refrigerant choice.
Answer: On today's grid the carbon saving is modest, but it grows every year as the grid gets cleaner, and the heat pump design avoids locking in gas for decades. Adding on-site solar or a clean power purchase would strengthen the case.
Common mistakes
MistakeUsing nominal insulation values to estimate wall heat loss.
InsteadUse effective values that include thermal bridges at studs, slab edges and anchors.
MistakeLeaving airtightness to each trade separately.
InsteadAssign one party responsibility for air barrier continuity and test early.
MistakeComparing EUIs without checking site versus source basis and floor area definition.
InsteadConfirm the basis and area before comparing.
MistakeAssuming heat pumps always cut carbon by the same percentage.
InsteadCalculate with the local grid factor and refrigerant impacts.
MistakeTreating commissioning as a final checklist at handover.
InsteadStart commissioning in design and continue into occupancy.
Summary and key terms
- EUI is annual energy per unit floor area; check site versus source basis.
- Heating degree days measure climate severity; annual heat loss is roughly UA × HDD × 24.
- Conduction heat loss is Q = U·A·ΔT; use effective U-values that include thermal bridges.
- Windows usually dominate envelope heat loss; WWRs of 30 to 40 % with good glazing balance energy and daylight.
- Airtightness is a construction quality issue measured by blower door tests; HRVs and ERVs recover most ventilation heat.
- Heat pumps deliver several units of heat per unit of electricity; COP falls in cold weather.
- Operational carbon is energy multiplied by emission factor; the grid decides the carbon benefit of electrification.
- Commissioning and measurement and verification close the gap between predicted and actual performance.
- Energy use intensity
- Annual energy use divided by floor area.
- Heating degree days
- The annual sum of daily differences between a base temperature and the average outdoor temperature when it is colder.
- U-value
- The rate of heat flow through an assembly per unit area per degree of temperature difference.
- Thermal bridge
- A part of the envelope with much higher heat flow than its surroundings, such as a slab edge.
- Window-to-wall ratio
- Glazed area divided by gross exterior wall area.
- ACH50
- Air changes per hour at a test pressure difference of 50 pascals.
- Heat recovery ventilator
- A ventilation unit that transfers heat from exhaust air to incoming fresh air.
- Coefficient of performance
- Heat delivered by a heat pump divided by the electricity it uses.
- Commissioning
- A quality process verifying that building systems are designed, installed and operated as intended.
Practice problems
Work each problem on paper first, then reveal the answer to check.
What does EUI measure?
Show answer
Annual energy use per unit of floor area.
What is the formula for conduction heat loss?
Show answer
Q = U × A × ΔT.
Why do windows dominate Cedar Row's heat loss?
Show answer
They lose heat about five times as fast as the insulated wall per unit area.
What happens to Cedar Row's heating demand for each 10-point increase in WWR with double glazing?
Show answer
It rises by about 8.5 %.
How is airtightness tested?
Show answer
With a blower door test, reporting ACH50 or leakage per unit envelope area.
Name two ways a builder achieves an airtight building.
Show answer
For example, single-party responsibility, mock-ups, inspection before concealment and early testing.
What does a COP of 3 mean?
Show answer
Three units of heat delivered per unit of electricity.
Why does the carbon benefit of heat pumps vary by region?
Show answer
It depends on the grid emission factor.
What is the performance gap?
Show answer
The difference between a building's predicted and actual energy use.
Give one argument for using marginal rather than average grid factors.
Show answer
The extra load is met by marginal generators, which may emit more, especially at peaks.
Lesson quiz · 5 questions
Score 60% or more to complete this lesson.
Create a free account to save your progress, take quizzes and earn a certificate.