
CON-430 · Lesson 3 of 12 · 29 min
Embodied carbon and life cycle assessment
Embodied carbon is the greenhouse gas emitted to extract, make, transport, install, maintain, replace and dispose of the materials in a building. CON-111 (lesson 12) introduced the idea, environmental product declarations and a simple calculation. This lesson goes further: it sets out the standard life cycle stages used in whole-building life cycle assessment (LCA), shows how to build an embodied carbon estimate from a bill of quantities, explains how to choose and use emission factors, and covers the traps that make LCA results unreliable, including biogenic carbon in wood. These skills are increasingly part of a builder's job, because codes, procurement policies and rating systems now ask for embodied carbon numbers that depend on quantities and product data the contractor controls.
Life cycle assessment and its standards
Life cycle assessment is a method for quantifying the environmental impacts of a product or system over its life, from raw material extraction to disposal. The general framework is set by ISO 14040 and ISO 14044. For construction, two families of standards add detail: EN 15804 and ISO 21930 set the rules for environmental product declarations of construction products, and EN 15978 sets the rules for assessing whole buildings. These standards define a common set of life cycle modules so that results from different products and projects can be compared, at least in principle.
Embodied carbon is only one of the impact categories an LCA can report. Others include ozone depletion, acidification, eutrophication, smog formation and depletion of non-renewable energy. In building practice, the global warming potential category, reported in kilograms of CO2e, gets most of the attention because carbon targets drive policy, but good LCA reports show the other categories too so that a carbon reduction does not quietly create another problem.
The life cycle modules
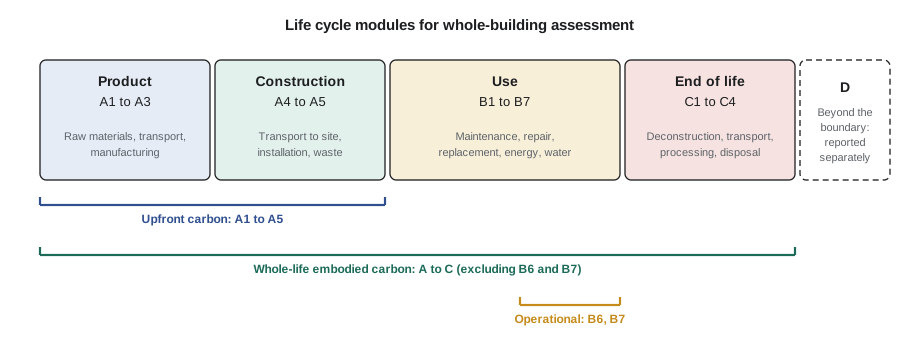
The standards divide a building's life into four stages, each with numbered modules, plus an optional module D for benefits beyond the system boundary.
| Stage | Modules | What is included | Who usually provides the data |
|---|---|---|---|
| Product | A1 raw material supply, A2 transport to factory, A3 manufacturing | Quarrying, mining, processing and making the product | Manufacturers, through EPDs |
| Construction | A4 transport to site, A5 construction and installation | Delivery, site energy, material waste and its disposal, packaging | Contractor and suppliers |
| Use | B1 use, B2 maintenance, B3 repair, B4 replacement, B5 refurbishment, B6 operational energy, B7 operational water | Emissions from materials in use, maintenance and replacement over the study period, plus energy and water | Designers, operators, energy model |
| End of life | C1 deconstruction, C2 transport, C3 waste processing, C4 disposal | Demolition energy, hauling, recycling and landfill | Assumed scenarios |
| Beyond the boundary | D benefits and loads | Credits for reuse, recycling or energy recovery after the building's life | Assumed scenarios, reported separately |
Several common scopes are named after these modules. Cradle-to-gate covers A1 to A3, the scope of most product EPDs. Cradle-to-site adds A4, and upfront carbon covers A1 to A5. Cradle-to-grave covers A to C. Many programs exclude B6 and B7 from embodied carbon results because operational energy is assessed separately, and they require module D to be reported separately rather than subtracted, because its benefits are speculative and occur far in the future. A typical reference study period for a whole-building LCA is 60 years, although some programs use 50 years.
The functional unit or reference unit defines what is being compared. For whole buildings, results are usually reported per square meter of gross floor area, and the scope must state which building elements are included. A common minimum scope covers the structure and envelope, including foundations, below-grade walls, floors, columns, beams, roofs and exterior walls, while finishes, mechanical, electrical and plumbing systems and site work are increasingly added. Comparing two buildings' results without checking the scope, study period and data sources is a common error.
Environmental product declarations
An environmental product declaration (EPD) is a verified, standardized report of a product's life cycle impacts, prepared under product category rules (PCRs) that set the method for that type of product. An industry-average EPD represents the average of many manufacturers, for example a national association's EPD for ready-mix concrete or structural steel. A product-specific EPD covers one manufacturer's product, and a facility-specific EPD covers one plant. The more specific the EPD, the better it reflects the product actually being bought, and procurement policies increasingly require product-specific or facility-specific EPDs.
An EPD is not a certificate that a product is green; it is a disclosure. A concrete mix with a high carbon footprint can have an EPD just as easily as a low-carbon one. EPDs also have limits: most are cradle-to-gate only, they expire (typically after five years), they reflect a past production period, and EPDs prepared under different PCRs may not be comparable. Databases such as the EC3 tool from Building Transparency, and the libraries built into whole-building LCA software, collect EPDs and generic data so that teams can compare products and build estimates.
Building an embodied carbon estimate
The core calculation is simple: for each material, multiply the quantity by an emission factor in the same unit, and add up the results. The quantities come from the estimate or the BIM model, and the factors come from EPDs or generic databases. The skill lies in getting quantities right, choosing appropriate factors and documenting assumptions. A builder's quantity surveying experience is a real advantage here; many design-stage LCAs underestimate quantities because they omit items such as reinforcing laps, formwork waste or connection hardware.
Here \(q_i\) is the quantity of material \(i\) (for example cubic meters of concrete or kilograms of steel) and \(f_i\) is its emission factor in kilograms of CO2e per unit. The table below applies this to Cedar Row's Option A, the concrete flat plate design.
# Upfront embodied carbon (A1-A3) for Cedar Row, Option A (concrete frame)
# Quantities from the estimate; factors are illustrative, typical of North American EPDs.
items = [
    # element, quantity, unit, factor (kg CO2e per unit)
    ('Foundations and below-grade walls, 35 MPa', 1400, 'm3', 330),
    ('Suspended slabs, 32 MPa',                  3200, 'm3', 300),
    ('Columns and shear walls, 40 MPa',           900, 'm3', 380),
    ('Reinforcing steel (EAF)',               550000, 'kg', 0.85),
    ('Miscellaneous structural steel',         60000, 'kg', 1.22),
    ('Windows, frames included',                1690, 'm2', 75),
    ('Metal cladding panels and trim',         12000, 'kg', 8.0),
    ('Mineral wool insulation',                40000, 'kg', 1.3),
    ('Gypsum board',                           18000, 'm2', 2.5),
]
gfa = 10800   # m2 gross floor area including one parking level
total = 0
rows = []
for name, q, unit, f in items:
    t = q * f / 1000
    rows.append((name, t)); total += t
for name, t in sorted(rows, key=lambda r: -r[1]):
    print(f"{name:44s} {t:8,.0f} t  {t / total:5.1%}")
print(f"{'A1-A3 total':44s} {total:8,.0f} t")
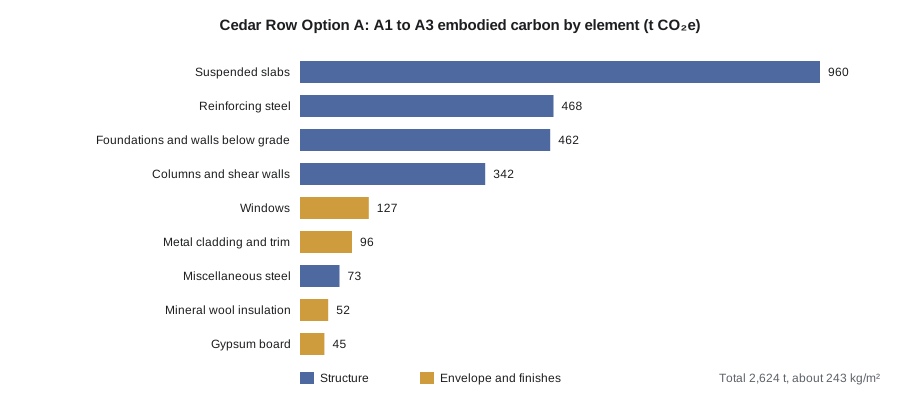
print(f"Intensity: {total * 1000 / gfa:,.0f} kg CO2e per m2 of GFA")Suspended slabs, 32 MPa 960 t 36.6% Reinforcing steel (EAF) 468 t 17.8% Foundations and below-grade walls, 35 MPa 462 t 17.6% Columns and shear walls, 40 MPa 342 t 13.0% Windows, frames included 127 t 4.8% Metal cladding panels and trim 96 t 3.7% Miscellaneous structural steel 73 t 2.8% Mineral wool insulation 52 t 2.0% Gypsum board 45 t 1.7% A1-A3 total 2,624 t Intensity: 243 kg CO2e per m2 of GFA
Concrete and reinforcing steel together make up about 85 % of the A1–A3 total, and the suspended slabs alone are more than a third. That is a typical pattern for a concrete-framed building: the structure dominates upfront carbon, so structural choices, concrete mix design and slab thickness are where the big savings lie. The result of about 243 kilograms of CO2e per square meter for A1–A3 is within the range commonly reported for North American mid-rise concrete buildings, although published benchmarks vary widely with scope and method.
Transport and construction: modules A4 and A5
Modules A4 and A5 are where the contractor's own decisions show up. A4 depends on how far materials travel and by what mode; trucks emit far more per metric ton-kilometer than rail or ships. A5 includes the energy used on site, such as diesel for equipment, propane or electricity for temporary heat and power, and the embodied carbon of materials that are wasted and must be replaced. Wasted material carries all of its own A1 to A4 carbon, which is why waste reduction is also a carbon strategy.
# Transport (A4) and construction site (A5) for Cedar Row, Option A (illustrative)
a1a3_t = 2624                 # from the A1-A3 calculation
# A4: mass moved, distance and mode
loads = [  # material, mass t, km, factor kg CO2e per t-km
    ('Ready-mix concrete', 5500 * 2.4, 25, 0.12),
    ('Reinforcing steel', 550 + 60, 400, 0.09),
    ('Windows', 1690 * 0.035, 900, 0.09),
    ('Other materials', 600, 300, 0.09),
]
a4 = sum(m * km * f for _, m, km, f in loads) / 1000
# A5: material waste (each wasted unit carries its own A1-A4), plus site energy
waste_rate = 0.05
a5_waste = (a1a3_t + a4) * waste_rate
site_energy_t = 120          # diesel, propane and temporary power over the build
a5 = a5_waste + site_energy_t
print(f"A4 transport: {a4:,.0f} t")
print(f"A5 waste {a5_waste:,.0f} t + site energy {site_energy_t} t = {a5:,.0f} t")
upfront = a1a3_t + a4 + a5
print(f"Upfront carbon A1-A5: {upfront:,.0f} t = {upfront * 1000 / 10800:,.0f} kg CO2e/m2")A4 transport: 83 t A5 waste 135 t + site energy 120 t = 255 t Upfront carbon A1-A5: 2,962 t = 274 kg CO2e/m2
Transport and construction add about 13 % to the product-stage total, bringing Cedar Row's upfront carbon to about 2,960 metric tons, or about 274 kilograms of CO2e per square meter. Ready-mix concrete travels a short distance, but its mass makes it the largest transport item. Site energy and waste are each worth more than a hundred metric tons, and both are under the contractor's control. In Canada, temporary heating during winter construction can make site energy much larger than this; Lesson 9 returns to construction emissions.
Use and end of life: modules B and C
Over a 60-year study period, some materials will be replaced. Roofing membranes might be replaced every 25 to 30 years, windows every 30 to 40, finishes such as carpet every 10 to 15, and mechanical equipment every 15 to 25. Each replacement repeats the product's A1 to A5 carbon in module B4. End-of-life modules C1 to C4 cover demolition, hauling and processing or landfilling the materials, and are usually small for inert materials such as concrete but more significant for materials that release carbon when they decompose or are burned. For Cedar Row, the design team estimates about 620 metric tons for replacements and end of life combined, which is the figure used in Lesson 1's whole-life calculation.
Module D reports benefits after the end of life, such as avoided production when steel is recycled or energy recovered when wood is burned. Because these benefits are uncertain and far in the future, and because claiming them can double count recycling benefits already credited at the start of life, standards require module D to be reported separately. A project that subtracts module D from its total to look better is not following the standards.
Biogenic carbon: the timber caution
Wood stores carbon that trees absorbed from the atmosphere as they grew; roughly half of the dry mass of wood is carbon. Many wood product EPDs report this biogenic carbon as a negative emission in module A1, which can make a timber building's A1–A3 result look very low or even negative. The EN 15804 and ISO 21930 approach is to count the stored carbon as a removal when the tree grows and as an emission when the wood leaves the system at end of life, in module C, whether it rots, burns or is landfilled. Over the full life cycle the stored carbon is only kept out of the atmosphere if the wood is reused or durably stored, and if the forest regrows.
Good practice is therefore to report biogenic carbon storage separately from fossil emissions, to never report a negative upfront total for a whole building, and to check that wood comes from sustainably managed forests, for example certified under the Forest Stewardship Council (FSC), the Sustainable Forestry Initiative (SFI) or CSA Group's sustainable forest management standard. Scientists also disagree about how to account for forest carbon dynamics, such as whether harvesting reduces the carbon stored in the forest itself; credible LCA reports state their assumptions. Lesson 4 compares Cedar Row's concrete and mass timber options on a fossil-only basis, with storage shown separately.
Uncertainty, tools and good practice
Embodied carbon estimates carry real uncertainty. Emission factors for the same product can vary by a factor of two or more between suppliers; generic factors may not reflect local production; quantities change as design develops; and replacement and end-of-life scenarios are assumptions. The most useful LCAs are comparative: they test alternatives on the same basis and identify which choices matter most. A useful habit is to run sensitivity checks on the largest items: if the concrete factor were 20 % higher, would the preferred option change?
Whole-building LCA tools such as the Athena Impact Estimator for Buildings, One Click LCA and Tally, and EPD databases such as EC3, automate the arithmetic and link quantities to factors. BIM models can export quantities directly, which CON-260 covers. The tools are only as good as their inputs, so builders should check that quantities match the estimate, that factors are regionally appropriate, and that scope and study period are stated. Increasingly, owners ask contractors to report as-built embodied carbon using the product-specific EPDs of materials actually delivered, which requires collecting EPDs with submittals and quantities from delivery records.
- State the scope (elements and modules), study period, reference area, tools and data sources.
- Use product-specific EPDs when the product is known; use regional generic data for early design.
- Check quantities against the estimate; include laps, waste and connections.
- Report biogenic carbon storage and module D separately.
- Test the sensitivity of conclusions to the largest uncertainties.
Worked problem
Adding concrete transport to the Cedar Row estimate
Marlowe Builders compares two ready-mix plants for Cedar Row's 5,500 cubic meters of concrete. Plant 1 is 25 km away; Plant 2 is 60 km away but offers a mix whose A1–A3 factor is 40 kg CO2e per cubic meter lower. Concrete weighs about 2.4 t per cubic meter, and the truck factor is 0.12 kg CO2e per metric ton-kilometer. Ignore the empty return trip.
Show solution
- Concrete mass: 5,500 × 2.4 = 13,200 t.
- Plant 1 transport: 13,200 × 25 × 0.12 = 39,600 kg ≈ 40 t CO2e.
- Plant 2 transport: 13,200 × 60 × 0.12 = 95,000 kg ≈ 95 t CO2e, an extra 55 t.
- Plant 2 product saving: 5,500 × 40 = 220,000 kg = 220 t CO2e.
- Net saving with Plant 2: 220 − 55 = 165 t CO2e.
Answer: Plant 2 saves about 165 t CO2e despite the longer haul, because the product stage dominates. Transport matters, but it rarely outweighs a substantially lower-carbon product; the empty return trip and delivery time limits for ready-mix should still be checked.
Common mistakes
MistakeComparing two buildings' embodied carbon per square meter without checking scope.
InsteadConfirm the elements, modules, study period and data sources are the same.
MistakeSubtracting module D benefits from the total.
InsteadReport module D separately, as the standards require.
MistakeReporting a negative A1–A3 total for a timber building.
InsteadReport biogenic storage separately and account for its release at end of life.
MistakeTreating an EPD as proof that a product is low carbon.
InsteadRead the GWP value and compare it with alternatives or limits.
MistakeUsing design-model quantities that omit laps, waste and connections.
InsteadCheck quantities against the construction estimate.
Summary and key terms
- Whole-building LCA follows EN 15978 and ISO 21930, using modules A1–A3 (product), A4–A5 (construction), B1–B7 (use), C1–C4 (end of life) and D (beyond the boundary).
- Upfront carbon covers A1–A5; module D must be reported separately.
- EPDs are verified disclosures prepared under product category rules; product-specific EPDs are more representative than industry averages.
- Embodied carbon = sum of quantity × emission factor, using consistent units.
- In concrete-framed buildings, concrete and reinforcing steel usually dominate upfront carbon.
- A4 and A5 reflect transport, site energy and waste, which the contractor controls.
- Biogenic carbon in wood should be reported separately and is released at end of life unless the wood is reused or durably stored.
- LCA results are uncertain; comparative studies and sensitivity checks are more reliable than absolute totals.
- Life cycle assessment
- A method for quantifying the environmental impacts of a product or system over its life.
- Environmental product declaration
- A verified, standardized report of a product's life cycle environmental impacts.
- Product category rules
- Rules that set the LCA method for EPDs of a particular type of product.
- Cradle-to-gate
- An LCA scope covering raw materials through manufacturing (A1–A3).
- Cradle-to-grave
- An LCA scope covering the product, construction, use and end-of-life stages.
- Reference study period
- The period over which a whole-building LCA is calculated, often 60 years.
- Module D
- Benefits and loads beyond the system boundary, such as reuse or recycling, reported separately.
- Biogenic carbon
- Carbon absorbed from the atmosphere by plants and stored in bio-based materials such as wood.
- Emission factor
- The greenhouse gas emissions per unit of a material, fuel or activity.
Practice problems
Work each problem on paper first, then reveal the answer to check.
Which modules make up the product stage?
Show answer
A1 raw material supply, A2 transport to factory and A3 manufacturing.
Which modules does upfront carbon cover?
Show answer
A1 to A5.
Why must module D be reported separately?
Show answer
Its benefits are uncertain, occur far in the future and can double count recycling.
What is the difference between an industry-average and a product-specific EPD?
Show answer
The first averages many manufacturers; the second covers one manufacturer's product.
What is the basic formula for embodied carbon?
Show answer
The sum over materials of quantity times emission factor.
Which elements dominate Cedar Row Option A's embodied carbon?
Show answer
Concrete and reinforcing steel, especially the suspended slabs.
Why does wasted material increase A5?
Show answer
Each wasted unit carries its own A1 to A4 carbon and must be replaced.
How should biogenic carbon in wood be reported?
Show answer
Separately from fossil emissions, with its release at end of life accounted for.
Name two reasons EPD values may not represent the product delivered.
Show answer
For example, industry averages, expired EPDs or a different production period or plant.
What does a sensitivity check ask?
Show answer
Whether conclusions change if a key input, such as a large emission factor, is varied.
Lesson quiz · 5 questions
Score 60% or more to complete this lesson.
Create a free account to save your progress, take quizzes and earn a certificate.