
CON-430 · Lesson 2 of 12 · 27 min
Climate science and building emissions for builders
Builders do not need to be climate scientists, but they need enough of the science to understand why carbon targets are written the way they are, to read a carbon report critically and to explain to a client why a metric ton emitted this year is treated differently from a metric ton emitted in 2060. This lesson covers the physical basics, the units used to count greenhouse gases, the way building emissions are classified and the policy targets that drive codes and procurement. BIOL-208 (lesson 12) covers the ecological effects of climate change and BUS-310 (lesson 7) covers corporate climate disclosure; here we stay with what a construction professional needs.
The greenhouse effect in brief
The Earth absorbs sunlight and sends energy back to space as infrared radiation. Certain gases in the atmosphere, mainly water vapor, carbon dioxide, methane and nitrous oxide, absorb some of that outgoing infrared radiation and re-emit it in all directions, including back toward the surface. This natural greenhouse effect keeps the planet about 33 °C warmer than it would otherwise be. Since the industrial revolution, burning fossil fuels, making cement, clearing forests and farming have raised the concentration of carbon dioxide from about 280 parts per million to more than 420 parts per million, and methane and nitrous oxide concentrations have risen too. The extra gases trap more heat, and the climate system warms until it reaches a new balance.
The World Meteorological Organization reported that 2024 was the first calendar year in which the global average temperature was about 1.5 °C above the pre-industrial level, although the Paris Agreement goals refer to long-term averages over decades rather than single years. Warming is not uniform: Canada and the Arctic are warming roughly twice as fast as the global average, and the effects that matter most to buildings, such as more intense rainfall, longer and hotter heat waves, longer wildfire seasons and shifting freeze-thaw patterns, are covered in Lesson 11.
A key result of climate science is that warming depends mainly on cumulative carbon dioxide emissions, not on the emission rate in any one year, because carbon dioxide stays in the atmosphere for centuries. That is why scientists talk about a carbon budget: the total amount that can still be emitted while keeping warming below a given level. The remaining budget for 1.5 °C is small compared with current global emissions of about 40 billion metric tons of carbon dioxide per year. For buildings, the implication is direct: emissions avoided now, including upfront carbon, are worth more than the same reduction decades later.
Counting greenhouse gases: CO2e and GWP
Different gases trap different amounts of heat and stay in the atmosphere for different times. To add them together, emissions are converted to carbon dioxide equivalent (CO2e) using the global warming potential (GWP) of each gas, which compares the warming caused by a kilogram of the gas over a time horizon, usually 100 years, with that caused by a kilogram of carbon dioxide. The values are updated in each assessment report of the Intergovernmental Panel on Climate Change (IPCC). Many regulations still use the older AR4 values for consistency, while inventories increasingly use AR5 or AR6 values, so always check which set a calculation uses.
| Gas or refrigerant | Typical building source | 100-year GWP (approximate) |
|---|---|---|
| Carbon dioxide (CO2) | Fuel combustion, cement production | 1 (by definition) |
| Methane (CH4) | Natural gas leaks, landfills, wastewater | About 28 to 30 |
| Nitrous oxide (N2O) | Combustion, fertilizer | About 265 to 273 |
| R-410A (HFC blend) | Older heat pumps and air conditioners | About 2,088 (AR4) |
| R-32 (HFC) | Newer heat pumps and split systems | About 675 (AR4) |
| R-454B (HFO blend) | Newer packaged and split systems | About 466 (AR4) |
| R-744 (CO2) | Heat pump water heaters, some commercial systems | 1 |
| HFC-134a | Older chillers, foam blowing agents | About 1,430 (AR4) |
Refrigerants deserve special attention because heat pumps, which are central to building decarbonization, contain them. A heat pump with a high-GWP refrigerant that leaks 2 to 5 % of its charge each year can add a surprising amount of CO2e. Regulations are tightening: in the United States, rules under the American Innovation and Manufacturing (AIM) Act now restrict the GWP of refrigerants in many new air conditioning and heat pump systems to below 700, and in Canada the Ozone-depleting Substances and Halocarbon Alternatives Regulations restrict high-GWP HFCs in new equipment as part of the international Kigali phase-down. Rating systems such as LEED and the CAGBC Zero Carbon Building Standard also assess refrigerant impacts. For builders, the practical points are to install systems with the specified refrigerant, braze and pressure-test carefully, record the charge and keep leak-check records.
Operational emissions from fuels and electricity
Operational emissions come from two sources. Direct emissions occur when fuel is burned on site, for example natural gas in boilers, water heaters, rooftop units and cooking equipment, or diesel in emergency generators. Natural gas releases about 5.3 kilograms of CO2 per therm burned, which is about 0.18 kilograms per kilowatt-hour of fuel energy. Indirect emissions occur at power plants when electricity is generated for the building; they depend on the grid's emission factor, which the EPA publishes for each eGRID subregion in pounds per megawatt-hour. US grids vary widely: in EPA's eGRID2023 data, the national average was about 771 pounds of CO2e per megawatt-hour (about 350 grams per kilowatt-hour), upstate New York was about a third of that, and parts of the Midwest were well above it.
# Annual operational emissions for a gas-heated building (illustrative, US units)
gas_therms = 23300        # natural gas burned per year, therms
gas_factor = 5.3          # kg CO2 per therm (combustion, approximate)
elec_kwh = 462000         # electricity bought per year
grid = {'Upstate NY-like': 243, 'US average': 771, 'Missouri-like': 1249}   # lb CO2e per MWh
direct_t = gas_therms * gas_factor / 1000
print(f"Direct (gas): {direct_t:.0f} t CO2e")
for name, lb in grid.items():
    indirect_t = elec_kwh / 1000 * lb * 0.4536 / 1000
    total = direct_t + indirect_t
print(f"{name:15s} indirect {indirect_t:5.0f} t, total {total:5.0f} t, gas share {direct_t / total:4.0%}")Direct (gas): 123 t CO2e Upstate NY-like indirect 51 t, total 174 t, gas share 71% US average indirect 162 t, total 285 t, gas share 43% Missouri-like indirect 262 t, total 385 t, gas share 32%
For the same building, gas is most of the emissions on an upstate New York-like grid, but on an average US grid electricity is already the larger source, and on a Missouri-like grid it dominates. This is why the carbon benefit of switching from gas heating to heat pumps is large where grids are clean and smaller, at least until the grid is cleaner, where electricity is fossil-heavy. Grid factors are falling in most regions as coal plants close and renewables grow, which makes electrification look better over a building's life than in its first year.
Two methods are used for electricity emissions. The location-based method uses the average emission factor of the grid where the building is. The market-based method reflects the electricity the owner has chosen to buy, such as through a green power contract or renewable energy certificates. Programs differ on which they accept and on whether average or marginal factors should be used for decisions about electrification, so a carbon report should always state its method.
Scopes: who owns which emissions
The Greenhouse Gas Protocol, the most widely used corporate accounting standard, divides an organization's emissions into three scopes. Scope 1 covers direct emissions from sources the organization owns or controls. Scope 2 covers indirect emissions from purchased electricity, steam, heating and cooling. Scope 3 covers all other indirect emissions in its value chain, upstream and downstream. The same emissions appear in different scopes for different organizations: the carbon in a concrete slab is Scope 1 for the cement plant, and Scope 3 for the developer who buys the building. BUS-230 (lesson 12) covers Scope 3 in supply chains in depth.
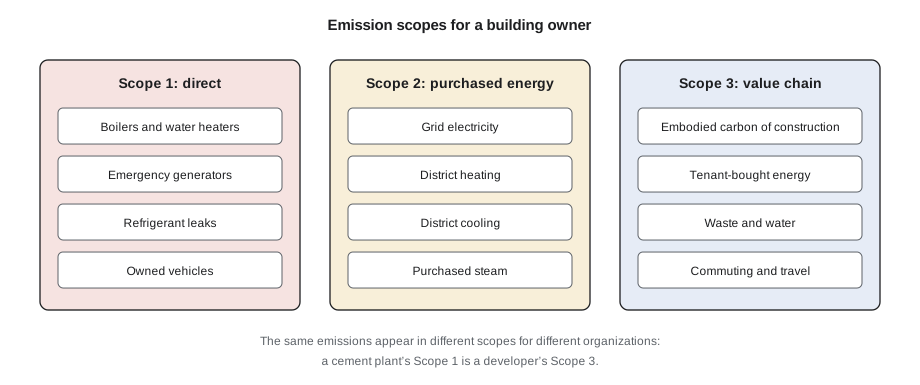
For a building owner, Scope 1 includes boilers, water heaters, generators and refrigerant leaks in owned equipment. Scope 2 includes purchased electricity and district heating or cooling. Scope 3 includes the embodied carbon of new construction and renovation, tenant energy use where tenants buy their own electricity, waste and many others. Corporate disclosure rules, which BUS-310 covers, increasingly require Scope 1 and 2 reporting and in some cases Scope 3, and that pushes owners to ask their builders and suppliers for carbon data.
Targets that shape building policy
Under the 2015 Paris Agreement, countries agreed to hold warming well below 2 °C and to pursue efforts to limit it to 1.5 °C, and each country sets its own targets. Building sector policy flows from these national targets, and both the targets and the policies change with governments, so check the current position before relying on them.
| Item | United States | Notes |
|---|---|---|
| National target | The United States withdrew from the Paris Agreement, effective January 2026; no federal economy-wide target is in force | As of 2026; check current policy |
| Building policy instruments | Model energy codes adopted by states, state and city building performance standards, federal tax incentives (largely ended in 2026) | Lesson 6 maps these in detail |
| Subnational action | States such as California, New York, Washington and Massachusetts, and many cities, keep their own targets and standards | Often stricter than national policy |
Opinions on these targets and on how fast to pursue them differ. Supporters argue that the costs of unchecked warming, from flood and wildfire damage to health effects, far exceed the costs of decarbonization, and that the building sector has many cost-effective reductions. Critics argue that aggressive timelines raise housing costs, strain electricity grids and burden lower-income households, and that national action matters little without the largest emitters. Builders work across these views: whatever the national position, many owners, lenders, insurers and cities now ask for carbon data, and markets for low-carbon products keep growing.
Why timing matters
Because warming depends on cumulative emissions, the timing of emissions matters. Upfront carbon is emitted in a burst during construction. Operational carbon is spread over decades and, on most grids, falls over time as electricity gets cleaner. A building that saves 500 metric tons of upfront carbon today contributes more to near-term targets than one that saves the same amount spread over 50 years of operation. Some analysts apply a time value to carbon, weighting near-term emissions more heavily; others argue that a metric ton is a metric ton. Either way, near-term reductions help keep within the budget and avoid the risk that later reductions never happen.
Builders should also recognize that carbon factors are uncertain. Emission factors for grids, materials and fuels have ranges, and a calculation that reports a whole-life total to the nearest kilogram gives a false sense of precision. Good practice is to state data sources and years, round sensibly, and use comparisons between options, which are usually more reliable than absolute totals.
Worked problem
Refrigerant leakage on Cedar Row
Cedar Row's mechanical engineer compares two heat pump systems. System 1 uses a variable refrigerant flow (VRF) design with 1,150 lb (520 kg) of R-410A distributed through the building. System 2 uses central air-to-water heat pumps with 400 lb (180 kg) of R-454B and water distribution. Assume an annual leakage rate of 4 % of charge for System 1 and 2 % for System 2, plus 10 % of the charge lost at end of life after 20 years.
Show solution
- System 1 annual leakage: 520 × 0.04 = 20.8 kg × 2,088 = 43,400 kg ≈ 43 t CO2e per year.
- System 1 over 20 years: 868 t, plus end-of-life loss 52 kg × 2,088 ≈ 109 t, total about 977 t CO2e.
- System 2 annual leakage: 180 × 0.02 = 3.6 kg × 466 = 1,680 kg ≈ 1.7 t CO2e per year.
- System 2 over 20 years: 34 t, plus end-of-life loss 18 kg × 466 ≈ 8 t, total about 42 t CO2e.
- Compare with Cedar Row's operational energy emissions of about 280 t per year on an Ohio Valley-like grid.
Answer: Refrigerant leakage from System 1 would add about 15 % to the building's annual electricity emissions, and it is not counted in a simple energy calculation. The choice of refrigerant, charge size and installation quality matters, and R-410A is in any case being phased out of new equipment under the AIM Act.
Common mistakes
MistakeAdding methane and carbon dioxide metric tons directly.
InsteadConvert each gas to CO2e using a stated set of GWP values.
MistakeUsing a national average grid factor for a building in a province or region with a very different grid.
InsteadUse the local grid factor and state its source and year.
MistakeIgnoring refrigerant leakage in a heat pump building's carbon estimate.
InsteadInclude charge, leakage rate, GWP and end-of-life loss.
MistakeTreating a metric ton emitted in 2060 the same as a metric ton emitted during construction for near-term targets.
InsteadRecognize that upfront carbon is emitted now, when the remaining budget is smallest.
MistakeReporting a whole-life total to the kilogram.
InsteadRound sensibly and focus on comparisons between options.
Summary and key terms
- Greenhouse gases trap outgoing infrared radiation; rising concentrations have warmed the planet by about 1.5 °C in 2024 compared with pre-industrial levels.
- Warming depends mainly on cumulative CO2 emissions, so near-term reductions are especially valuable.
- Emissions of different gases are combined as CO2e using global warming potentials; state which IPCC values are used.
- Refrigerants such as R-410A have high GWPs; leakage can rival a building's energy emissions.
- Operational emissions are direct (on-site fuel) or indirect (purchased electricity), and grid factors vary widely by region.
- Scope 1, 2 and 3 classify emissions by ownership and control; the same emissions fall in different scopes for different organizations.
- National targets and building policies differ and change; check the current position before relying on them.
- Carbon factors are uncertain, so comparisons are more reliable than absolute totals.
- Greenhouse effect
- Warming of the Earth's surface caused by atmospheric gases absorbing and re-emitting infrared radiation.
- Carbon dioxide equivalent
- A common unit for greenhouse gases, obtained by multiplying the mass of each gas by its global warming potential.
- Global warming potential
- The warming caused by a kilogram of a gas over a stated period relative to a kilogram of CO2.
- Carbon budget
- The cumulative CO2 that can still be emitted while keeping warming below a given level.
- Grid emission factor
- The average greenhouse gas emissions per unit of electricity generated or consumed in a region.
- Scope 1 emissions
- Direct emissions from sources an organization owns or controls.
- Scope 2 emissions
- Indirect emissions from purchased electricity, steam, heating and cooling.
- Scope 3 emissions
- All other indirect emissions in an organization's value chain.
- Location-based method
- Electricity accounting that uses the average grid emission factor where the energy is used.
Practice problems
Work each problem on paper first, then reveal the answer to check.
Why does carbon dioxide's long lifetime matter for building decisions?
Show answer
Warming depends on cumulative emissions, so emissions avoided now count more toward limits.
What does a GWP of 2,088 for R-410A mean?
Show answer
One kilogram causes about as much warming over 100 years as 2,088 kg of CO2.
Name the two sources of operational emissions.
Show answer
Direct on-site fuel combustion and indirect emissions from purchased electricity.
Why can switching from gas to heat pumps save less carbon in some regions?
Show answer
Where the grid is fossil-heavy, electricity emissions per unit of heat can approach those of gas.
What is the difference between location-based and market-based electricity accounting?
Show answer
Location-based uses the local grid average; market-based reflects contracts and certificates the buyer chooses.
For a building owner, which scope includes the embodied carbon of a new building?
Show answer
Scope 3.
For a cement producer, which scope includes the process emissions of making clinker?
Show answer
Scope 1.
Give two practical steps a builder can take to reduce refrigerant emissions.
Show answer
For example, careful brazing and pressure testing, accurate charge records and leak checks.
Why should carbon results be rounded and compared rather than reported precisely?
Show answer
Factors are uncertain, and comparisons between options are more robust.
Name one argument made by critics of aggressive building decarbonization timelines.
Show answer
For example, higher housing costs or strain on electricity grids.
Lesson quiz · 5 questions
Score 60% or more to complete this lesson.
Create a free account to save your progress, take quizzes and earn a certificate.