
BIOL-350 · Lesson 2 of 12 · 31 min
Metabolism, body size and energetics
Every activity of an animal, from pumping ions to running, growing and reproducing, is paid for in energy. Metabolic rate, the rate at which an animal converts chemical energy into work and heat, is the most fundamental quantity in animal physiology. It sets how much food an animal needs, how fast it can grow, how long it can survive without eating and, at the level of ecosystems, how much energy flows through a population. BIOL-107 described cellular respiration, the biochemical pathways that turn glucose and fat into ATP. This lesson takes the whole-animal view: how metabolic rate is measured, how it depends on body size, temperature and activity, and why a shrew must eat almost constantly while a moose can browse at leisure.
Energy budgets
Energy taken in as food has several fates. Some is not absorbed and leaves as feces. Of the absorbed energy, some is lost in urine as nitrogenous waste and, in ruminants, as methane. What remains is metabolizable energy, which is available for maintenance, activity, growth, reproduction and storage. Every one of these uses except growth and storage ends as heat. A simple energy budget therefore reads: ingested energy equals fecal and urinary losses plus heat production plus energy stored in new tissue or offspring. Physiologists can measure most terms directly, and the budget is a powerful check on whether an animal is in energy balance.
Metabolic rate is usually expressed as power, in watts (joules per second), or as energy per day, in kilojoules per day. Because almost all of it ends as heat, metabolic rate can be measured directly as heat production, by placing an animal in a calorimeter. Antoine Lavoisier and Pierre-Simon Laplace did exactly this in the 1780s, measuring the ice melted by a guinea pig in an insulated chamber, and comparing it with the carbon dioxide the animal produced. Direct calorimetry remains the gold standard but is technically demanding. Most modern measurements use indirect calorimetry, also called respirometry, which measures oxygen consumption and carbon dioxide production.
Respirometry
Indirect calorimetry rests on the fact that oxidizing a given amount of food consumes a predictable amount of oxygen and releases a predictable amount of energy. For a typical mixed diet, about 20 J of heat is released per milliliter of oxygen consumed; the value varies only from about 19.6 J per milliliter for protein to 21.1 J per milliliter for carbohydrate. The respiratory quotient (RQ), the ratio of carbon dioxide produced to oxygen consumed, indicates which fuel is being burned: about 1.0 for carbohydrate, 0.7 for fat and around 0.8 for protein. At the whole-animal level the measured ratio is called the respiratory exchange ratio (RER), because it can be distorted by hyperventilation or by the storage of carbon dioxide in body fluids.
| Fuel | RQ (CO₂/O₂) | Energy per liter of O₂ | Energy per gram of fuel | Notes |
|---|---|---|---|---|
| Carbohydrate | 1.00 | about 21.1 kJ | about 17 kJ | Fastest fuel to mobilize; limited storage as glycogen |
| Fat | about 0.70 | about 19.6 kJ | about 39 kJ | Most energy-dense store; used in migration and hibernation |
| Protein | about 0.8 | about 19.3 kJ | about 17–18 kJ (minus urinary losses) | Nitrogen must be excreted (lesson 11) |
| Mixed diet | about 0.8 | about 20.1 kJ | n/a | The usual conversion factor in respirometry |
Respirometers come in two broad kinds. In closed respirometry the animal sits in a sealed chamber of known volume, and the fall in oxygen concentration over time gives oxygen consumption. In flow-through respirometry, air is pumped through the chamber at a measured rate and the oxygen and carbon dioxide concentrations of incoming and outgoing air are compared. For aquatic animals, the oxygen content of water entering and leaving the chamber is measured instead. For free-ranging animals, the doubly labeled water technique estimates average energy expenditure over days to weeks: an animal is injected with water containing the heavy isotopes deuterium and oxygen-18. Deuterium leaves only as water, oxygen-18 leaves as both water and carbon dioxide, so the difference between their washout rates gives carbon dioxide production. Heart rate loggers, accelerometers and time–activity budgets provide further estimates in the field.
# Flow-through respirometry for a resting animal (invented readings)
flow_ml_min = 500.0          # dry air flow through the chamber (STP), mL/min
o2_in, o2_out = 0.2095, 0.2061     # fractional O2 in and out
co2_in, co2_out = 0.0004, 0.0031   # fractional CO2 in and out
mass_g = 120.0               # body mass, g

# simple approximation valid when RQ is near 1; it ignores the small volume change
vo2 = flow_ml_min * (o2_in - o2_out)          # mL O2 per minute
vco2 = flow_ml_min * (co2_out - co2_in)       # mL CO2 per minute
rer = vco2 / vo2
watts = vo2 / 60 * 20.1                       # J per s, using 20.1 J per mL O2

print(f"VO2 = {vo2:.2f} mL/min   VCO2 = {vco2:.2f} mL/min   RER = {rer:.2f}")
print(f"metabolic rate = {watts:.3f} W  = {watts * 86400 / 1000:.0f} kJ per day")
print(f"mass-specific rate = {vo2 * 60 / mass_g:.2f} mL O2 per g per hour")VO2 = 1.70 mL/min VCO2 = 1.35 mL/min RER = 0.79 metabolic rate = 0.569 W = 49 kJ per day mass-specific rate = 0.85 mL O2 per g per hour
An RER of about 0.79 suggests a mixture of fat and carbohydrate, typical of a resting animal some hours after feeding. A metabolic rate of about 0.57 W for a 120 g mammal is a little below, but well within the normal scatter of, the value of about 0.7 W predicted for a resting mammal of that size by the scaling relationship described in the next section.
Standard, basal and field metabolic rates
Because metabolic rate changes with activity, digestion, temperature and stress, comparisons need standardized conditions. Basal metabolic rate (BMR) is the rate of an endotherm that is adult, resting, awake, not digesting and within its thermoneutral zone, the range of temperatures over which it need not spend extra energy to keep warm or cool (lesson 3). Standard metabolic rate (SMR) is the equivalent for an ectotherm: resting and post-absorptive at a stated body temperature. Resting metabolic rate is a looser term for measurements that do not meet all the conditions. Maximum metabolic rate, reached during intense exercise or in extreme cold, is typically about 10 times BMR in mammals and higher in birds and insects. Field metabolic rate (FMR), the average rate of a free-living animal, is usually about two to five times BMR.
Digestion itself costs energy. After a meal, metabolic rate rises and stays raised for hours to days, a response called specific dynamic action or the heat increment of feeding. It reflects the costs of digestion, absorption and, above all, protein synthesis. In a Burmese python after a meal equal to a quarter of its body mass, oxygen consumption can rise more than tenfold and stay high for a week, while the gut and heart grow rapidly in mass. Studies of pythons by Stephen Secor and colleagues have made them a model for the regulation of organ size.
How metabolic rate scales with body size
A 20 g mouse and a 600 kg moose are both mammals with similar body temperatures, but their metabolic rates differ enormously. A moose uses far more energy in total, but much less per kilogram. Physiologists describe the relationship with an allometric equation, in which a variable Y changes as a power of body mass M.
On logarithmic axes the power function becomes a straight line with slope b, the scaling exponent. If b equals 1, Y is proportional to mass (isometry). If b is less than 1, Y increases more slowly than mass, and the mass-specific value, Y divided by M, falls with size. In 1932 Max Kleiber compiled measurements of basal metabolic rate in mammals from rats to steers and found an exponent close to 0.75. Kleiber's law, metabolic rate proportional to mass to the three-quarters power, has been confirmed over a range of body mass from shrews to whales, with similar exponents for birds, many ectotherms, and even unicellular organisms in some data sets.
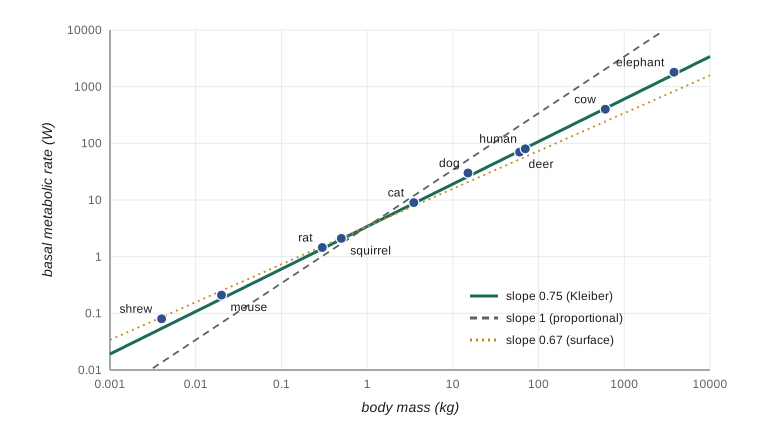
The code below fits an allometric equation to approximate basal metabolic rates for ten mammals. The values are rounded figures of the kind found in comparative compilations, labeled here as approximate, and are meant to show the method rather than to give authoritative values for any species.
import numpy as np

# Approximate basal metabolic rates of mammals (rounded, for illustration)
data = [  # species, body mass kg, BMR watts
    ("masked shrew",        0.004,    0.08),
    ("house mouse",         0.020,    0.21),
    ("brown rat",           0.300,    1.45),
    ("tree squirrel",       0.500,    2.1),
    ("domestic cat",        3.5,      9.0),
    ("dog",                 15.0,     30.0),
    ("human",               70.0,     80.0),
    ("white-tailed deer",   60.0,     70.0),
    ("cow",                 600.0,    400.0),
    ("elephant",            3800.0,   1800.0),
]
M = np.array([d[1] for d in data]); B = np.array([d[2] for d in data])
b, log_a = np.polyfit(np.log10(M), np.log10(B), 1)
a = 10 ** log_a
resid = np.log10(B) - (log_a + b * np.log10(M))
r2 = 1 - (resid ** 2).sum() / ((np.log10(B) - np.log10(B).mean()) ** 2).sum()
print(f"fitted: BMR = {a:.2f} M^{b:.3f}   (r^2 = {r2:.3f})")
for name, m in (("20 g mouse", 0.02), ("600 kg moose", 600.0)):
    p = a * m ** b
    print(f"{name:14s} predicted BMR {p:7.2f} W   per kg {p / m:6.2f} W/kg")
print(f"ratio of mass-specific rates mouse:moose = {(a*0.02**b/0.02)/(a*600**b/600):.0f}")fitted: BMR = 3.79 M^0.731 (r^2 = 0.999) 20 g mouse predicted BMR 0.22 W per kg 10.88 W/kg 600 kg moose predicted BMR 406.52 W per kg 0.68 W/kg ratio of mass-specific rates mouse:moose = 16
The fitted exponent, about 0.73, is close to Kleiber's three quarters, and the fitted coefficient, about 3.8, is close to the value of about 3.4 W per kilogram to the three-quarters power that Kleiber's own data give. With rounded values for only ten species, the fit should not be over-interpreted; the point is the method and the size of the effect. The striking result is the last line: each kilogram of mouse tissue uses more than ten times, here about sixteen times, as much energy as each kilogram of moose. That difference shows up everywhere in the animal's life. Small mammals have higher heart rates, breathe faster, eat more food relative to their size, and starve sooner. A shrew can die within hours without food; a black bear can fast for months.
Why three-quarters?
Why the exponent is about 0.75 rather than 1 is one of the longest-running debates in physiology. An older argument, Max Rubner's surface law of 1883, held that heat loss is proportional to surface area, which scales as mass to the two-thirds power for animals of the same shape, so heat production should too. The surface law cannot explain why ectotherms, which do not need to balance heat production against loss in the same way, show similar exponents, or why the empirical exponent is usually higher than 0.67. In 1997 Geoffrey West, James Brown and Brian Enquist proposed that the exponent arises from the geometry of space-filling, branching distribution networks, such as blood vessels, that minimize the energy needed to deliver resources. Their model predicts an exponent of exactly 0.75 and makes predictions about the scaling of heart rate, lifespan and other variables.
The network model has been influential but remains controversial. Large analyses have found that the exponent differs among groups and depends on body size range, temperature and activity, with values from about 0.67 to near 1. Some researchers argue that the exponent of basal metabolic rate in mammals is closer to two thirds when small and large species are analyzed separately, or when body temperature and phylogeny are accounted for. Others propose that the exponent reflects a mix of surface-related and volume-related processes. For practical purposes the empirical relationship is robust: within a group, mass-specific metabolic rate falls steadily with size, and the exponent for whole-animal rate is usually between two thirds and one.
Other allometric relationships
Many physiological variables scale with body mass with characteristic exponents, and those exponents are linked. Heart mass and blood volume scale roughly isometrically, with exponents near 1. Heart rate scales with an exponent of about −0.25, so a shrew's heart beats about 800 or more times a minute and an elephant's about 30. Lifespan in mammals scales with an exponent of about +0.2 to +0.25. Combining these gives a curious result: the number of heartbeats in a lifetime is roughly the same, on the order of a billion, for mammals of very different sizes. Birds and bats, which live longer than predicted for their size, break the pattern, which is a reminder that allometric patterns describe tendencies, not laws of nature.
| Variable | Approximate exponent b | Consequence for a larger mammal |
|---|---|---|
| Basal metabolic rate (whole animal) | 0.70 to 0.75 | Uses more energy in total |
| Mass-specific metabolic rate | about −0.25 | Uses less energy per kilogram |
| Heart mass, blood volume, lung volume | about 1.0 | Same fraction of body mass |
| Heart rate, breathing rate | about −0.25 | Slower rhythms |
| Lifespan, gestation, circulation time | about +0.25 | Longer times |
| Skeleton mass | about 1.08 | Relatively heavier bones |
Temperature and metabolic rate
For ectotherms, metabolic rate depends strongly on body temperature. The temperature coefficient Q₁₀ describes how much a rate increases for a 10 °C rise. Most biological rates have Q₁₀ values between 2 and 3, meaning a 10 °C rise doubles or triples the rate. A garter snake at 30 °C therefore uses energy several times faster than the same snake at 10 °C. Endotherms are less affected over the range of temperatures they normally experience, because their core temperature is regulated, but they too show the effect when body temperature falls in torpor (lesson 3).
Comparing endotherms with ectotherms of the same mass and body temperature shows how costly endothermy is. A resting mammal or bird uses roughly five to ten times more energy than a reptile of the same size at the same body temperature. Much of the difference lies in the cellular machinery: endotherms have more mitochondria, larger internal organs and leakier membranes, so more energy is needed simply to keep ion gradients in place. That cost buys a high, stable body temperature, sustained aerobic activity and independence from the environment, at the price of eating many times as much food. A python can survive on a few large meals a year; a similar-sized mammal must eat every day.
Worked problem
Food needs of a shrew and a moose
Using a field metabolic rate of three times BMR and BMR = 3.4 M^0.75 W, estimate the daily food requirement, as a percentage of body mass, for a 5 g masked shrew eating insects and a 400 kg moose eating browse. Assume metabolizable energy of 18 kJ per gram dry mass for insects and 8 kJ per gram fresh mass for browse, and that insects are 70 percent water.
Show solution
- Shrew BMR: 3.4 × 0.005^0.75 = 3.4 × 0.0188 ≈ 0.064 W; FMR ≈ 0.19 W ≈ 16.6 kJ per day.
- Shrew food: 16.6 / 18 ≈ 0.92 g dry insect per day ≈ 0.92 / 0.3 ≈ 3.1 g fresh insect, about 60 percent of a 5 g body.
- Moose BMR: 3.4 × 400^0.75 = 3.4 × 89.4 ≈ 304 W; FMR ≈ 912 W ≈ 78,800 kJ per day.
- Moose food: 78,800 / 8 ≈ 9,850 g, about 9.9 kg of fresh browse, roughly 2.5 percent of body mass.
Answer: The shrew must eat more than half its body mass in insects each day, the moose only a few percent of its mass. Real values vary with season and diet quality, but the contrast, a factor of more than twenty, follows directly from scaling.
Metabolic scope and the limits of performance
The difference between maximum and resting metabolic rate is called aerobic scope. It sets how much energy is available for activity, digestion, growth and reproduction at the same time. In fish, aerobic scope depends strongly on temperature: it typically rises to an optimum and then falls as water warms and oxygen becomes limiting, a pattern that underlies the idea of oxygen- and capacity-limited thermal tolerance discussed in lesson 12. Sustained metabolic scope, the highest rate an animal can keep up for days rather than minutes, appears to be limited to about four to seven times BMR in most animals, including human endurance athletes, lactating mice and birds feeding nestlings. Whether that ceiling is set by the capacity of the gut and organs to process energy, or by the ability to shed heat, is an active research question, with heat dissipation limitation supported by experiments in which shaving lactating mice increased their milk output.
Common mistakes
MistakeSaying that larger animals have lower metabolic rates.
InsteadLarger animals have higher total metabolic rates but lower mass-specific rates.
MistakeAssuming the scaling exponent of metabolic rate is exactly 0.75 for all animals.
InsteadMeasured exponents range from about 0.67 to near 1 depending on group, size range and conditions; 0.75 is a useful approximation.
MistakeComparing basal metabolic rates measured under different conditions.
InsteadBMR requires an adult, resting, post-absorptive animal in its thermoneutral zone; otherwise use resting or field rates and say so.
MistakeTreating RQ and RER as identical in all circumstances.
InsteadRER is measured at the mouth or chamber and can be distorted by hyperventilation or CO₂ storage; RQ refers to cellular fuel use.
MistakeFitting an allometric equation on linear axes.
InsteadPower laws are fitted on log–log axes, and results should be back-transformed carefully.
MistakeConcluding that ectotherms are less efficient than endotherms.
InsteadEctotherms use far less energy; endotherms pay a large cost for thermal independence and sustained activity.
Summary and key terms
- Metabolic rate, the rate of energy use, sets food needs, growth and survival; almost all metabolized energy ends as heat.
- Indirect calorimetry converts oxygen consumption to energy (about 20 J per mL O₂); the respiratory quotient indicates the fuel.
- BMR and SMR are measured under standard conditions; field metabolic rate is usually two to five times BMR.
- Metabolic rate scales with body mass as about M^0.75, so mass-specific rate falls with size; the cause of the exponent is debated.
- Heart rate, breathing rate and lifespan scale with characteristic exponents near ±0.25.
- Ectotherm metabolic rate rises with temperature (Q₁₀ of 2 to 3); endothermy costs five to ten times more energy at the same temperature.
- Aerobic scope and sustained metabolic scope set limits on performance and may be limited by heat dissipation.
- metabolic rate
- The rate of energy conversion by an animal, usually measured in watts or kilojoules per day.
- indirect calorimetry
- Estimating metabolic rate from oxygen consumption and carbon dioxide production.
- respiratory quotient
- The ratio of CO₂ produced to O₂ consumed in cellular metabolism, indicating the fuel used.
- basal metabolic rate
- The metabolic rate of a resting, post-absorptive adult endotherm in its thermoneutral zone.
- standard metabolic rate
- The resting, post-absorptive metabolic rate of an ectotherm at a specified temperature.
- field metabolic rate
- The average metabolic rate of a free-living animal, often measured with doubly labeled water.
- specific dynamic action
- The rise in metabolic rate after a meal, reflecting the costs of digestion and protein synthesis.
- allometry
- The study of how traits change with body size, usually described by Y = aM^b.
- Kleiber's law
- The observation that metabolic rate scales with body mass to about the three-quarters power.
- Q10
- The factor by which a rate increases for a 10 °C rise in temperature.
- aerobic scope
- The difference between maximum and resting metabolic rates.
- doubly labeled water
- A method that estimates CO₂ production in free-living animals from the washout of deuterium and oxygen-18.
Practice problems
Work each problem on paper first, then reveal the answer to check.
An animal consumes 3.0 mL O₂ per minute. Estimate its metabolic rate in watts.
Show answer
3.0/60 × 20.1 ≈ 1.0 W.
An animal has an RER of 0.71. What fuel is it mainly using?
Show answer
Fat.
List the conditions required for a measurement of BMR.
Show answer
Adult, resting but awake, post-absorptive, within the thermoneutral zone, not stressed.
If BMR = 3.4 M^0.75 W, what is the BMR of a 16 kg animal?
Show answer
3.4 × 16^0.75 = 3.4 × 8 = 27.2 W.
By what factor does mass-specific metabolic rate change when body mass increases 10,000-fold, if b = 0.75?
Show answer
10,000^(−0.25) = 0.1, so it falls tenfold.
A lizard's metabolic rate is 2.0 W/kg at 20 °C and 5.0 W/kg at 30 °C. What is Q₁₀?
Show answer
5.0/2.0 = 2.5.
Why does Rubner's surface law predict an exponent of 2/3?
Show answer
For geometrically similar animals surface area scales as M^(2/3); if heat production matches heat loss through the surface, so would metabolic rate.
How does the doubly labeled water method estimate CO₂ production?
Show answer
Deuterium leaves only as water, oxygen-18 as water and CO₂; the difference in their elimination rates gives CO₂ output.
What is specific dynamic action, and why is it large in pythons?
Show answer
The post-meal rise in metabolism; pythons eat huge, infrequent meals and rapidly rebuild their gut, so the rise is large and long.
Why do shrews starve faster than bears?
Show answer
Their mass-specific metabolic rate is far higher and their fat stores are tiny relative to their energy use.
Lesson quiz · 5 questions
Score 60% or more to complete this lesson.
Create a free account to save your progress, take quizzes and earn a certificate.