
BIOL-208 · Lesson 11 of 12 · 27 min
Ecosystems: energy flow and nutrient cycles
An ecosystem is a community of organisms together with its physical environment, linked by flows of energy and cycles of matter. Ecosystem ecology asks questions that cannot be answered by studying species one at a time: how much of the Sun's energy is captured by plants in a boreal forest, how much reaches the wolves at the top of the food web, how long a carbon atom stays in a peat bog, and why adding phosphorus to a lake turns it green. The two great principles are simple. Energy flows through ecosystems in one direction, entering as sunlight and leaving as heat, so it must be continually replenished. Matter, such as carbon, nitrogen and phosphorus, cycles, moving repeatedly between living organisms and the air, water, rocks and soil. This lesson follows both.
Primary production
Almost all energy in ecosystems enters through photosynthesis. Gross primary production (GPP) is the total rate at which plants and algae capture energy and fix carbon. Plants use roughly half of it for their own respiration (R). What remains, net primary production (NPP), is the energy stored as new plant tissue, available to herbivores and decomposers:
NPP varies greatly among ecosystems, mainly with temperature, water and nutrients. Tropical rainforests are the most productive per square meter on land; deserts and tundra the least. The open ocean has low productivity per square meter, limited by nutrients rather than light, but its vast area makes it a major contributor to global production. Ecologists measure NPP by harvesting plant biomass, by tracking carbon dioxide exchange with instruments on towers (eddy covariance), and from satellites that measure how green the land and sea are.
| Ecosystem | Typical NPP (g dry matter per m² per year, approximate) | Main limits |
|---|---|---|
| Tropical rainforest | 1,800–2,200 | Few; some phosphorus limitation |
| Temperate deciduous forest | 1,000–1,400 | Temperature, nitrogen |
| Boreal forest | 500–900 | Short growing season, cold soils, nitrogen |
| Temperate grassland | 400–800 | Water |
| Tundra | 100–200 | Temperature, nitrogen |
| Desert | 50–150 | Water |
| Open ocean | 100–150 | Nitrogen, iron, phosphorus |
| Estuaries and salt marshes | 1,500–2,500 | Few; nutrients from rivers |
Energy flow and trophic efficiency
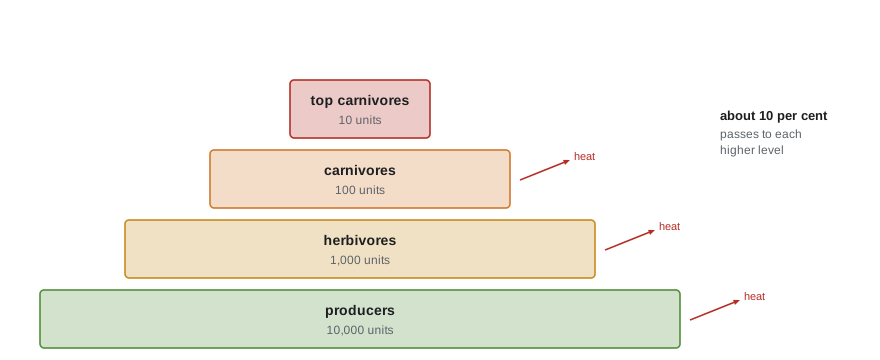
Raymond Lindeman, in a landmark 1942 paper based on his doctoral work at Cedar Bog Lake in Minnesota, treated a lake as a system of energy transfers between trophic levels. Only part of the energy at one level becomes biomass at the next. Herbivores eat only part of the plant production; of what they eat, much is not assimilated and leaves as faeces; of what they assimilate, most is burned in respiration to stay alive, and only the rest becomes new herbivore tissue. The fraction of energy passed from one trophic level to the next, the trophic transfer efficiency, is typically 5 to 20 percent, often rounded to 10 percent. It tends to be lower for endotherms, which burn much of their food to stay warm, and higher for ectotherms.
Because so much energy is lost at each step, ecological pyramids of energy always narrow upward, and food chains rarely exceed four or five links: there simply is not enough energy left to support another level. This also explains why large predators are rare and need huge ranges, and why eating lower on the food chain requires less land.
# Energy available at each trophic level for different transfer efficiencies
npp = 6000.0   # kJ per m2 per year, roughly a boreal forest (illustrative)
for eff in (0.05, 0.10, 0.20):
    levels = [npp]
    for _ in range(4):
        levels.append(levels[-1] * eff)
    print(f"efficiency {eff:.0%}: " + "  ".join(f"L{i+1} {e:9.2f}" for i, e in enumerate(levels)))

# How much land supports one wolf? (very rough, all fractions illustrative)
wolf_need = 3 * 6000 * 365          # ~3 kg of prey a day at ~6,000 kJ per kg
herbivore_prod = npp * 1e6 * 0.05 * 0.10   # herbivores eat ~5% of NPP, convert 10% to new tissue (per km2)
ungulate_prod = herbivore_prod * 0.10       # share of that produced by moose, deer and caribou
wolf_take = ungulate_prod * 0.02            # share wolves actually capture
print(f"prey energy needed per wolf: {wolf_need:,.0f} kJ per year")
print(f"approximate area per wolf: {wolf_need / wolf_take:.0f} km2")efficiency 5%: L1 6000.00 L2 300.00 L3 15.00 L4 0.75 L5 0.04 efficiency 10%: L1 6000.00 L2 600.00 L3 60.00 L4 6.00 L5 0.60 efficiency 20%: L1 6000.00 L2 1200.00 L3 240.00 L4 48.00 L5 9.60 prey energy needed per wolf: 6,570,000 kJ per year approximate area per wolf: 110 km2
With these rough assumptions, each wolf needs on the order of 100 km² of boreal forest, the same order of magnitude as wolf densities often reported in boreal regions. The point is not the exact number, which depends on every assumed fraction, but that the inefficiency of energy transfer forces top predators to range over very large areas.
Decomposition
Most NPP is never eaten by herbivores. It dies and enters the detrital food web, where bacteria, fungi, earthworms, mites and other decomposers break it down, releasing nutrients back to the soil and carbon dioxide to the air. Decomposition rate depends on temperature, moisture and the chemistry of the litter: leaves with high nitrogen and low lignin decay quickly, while needles and wood rich in lignin decay slowly. In cold, waterlogged soils, decomposition is so slow that dead plant material accumulates as peat.
Ecologists measure decomposition with litterbags: mesh bags of known mass of leaves left in the field and retrieved at intervals. The mass remaining usually declines exponentially, and the decay constant \( k \) summarizes the rate. The time for half the litter to disappear is \( 0.693/k \), and about 95 percent is gone after \( 3/k \).
import numpy as np
from scipy.optimize import curve_fit

rng = np.random.default_rng(208)
t = np.array([0, 0.25, 0.5, 1, 1.5, 2, 3])            # years
sites = {"aspen leaves (temperate)": 0.75, "black spruce needles (boreal)": 0.18}
for name, k_true in sites.items():
    mass = 10 * np.exp(-k_true * t) * rng.normal(1, 0.03, t.size)
    mass[0] = 10.0
    (M0, k), _ = curve_fit(lambda t, M0, k: M0 * np.exp(-k * t), t, mass, p0=[10, 0.5])
print(f"{name:30s} k = {k:.2f} per year, half-life {0.693 / k:4.1f} yr, 95% loss in {3 / k:4.1f} yr")aspen leaves (temperate) k = 0.75 per year, half-life 0.9 yr, 95% loss in 4.0 yr black spruce needles (boreal) k = 0.17 per year, half-life 4.2 yr, 95% loss in 18.1 yr
The carbon cycle
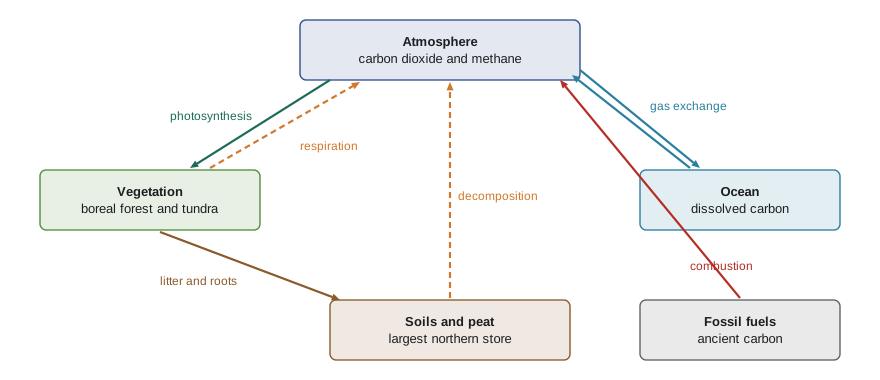
Carbon moves between the atmosphere, living organisms, soils, oceans and rocks. Photosynthesis removes carbon dioxide from the air; respiration by plants, animals and decomposers returns it. The oceans exchange large amounts of carbon dioxide with the atmosphere, and over geological time carbon is locked into limestone and fossil fuels. Burning fossil fuels and clearing forests have moved large amounts of ancient carbon into the atmosphere, raising carbon dioxide concentration from about 280 parts per million before the Industrial Revolution to roughly 425–430 ppm in 2025, as measured at Mauna Loa (CHEM-102 discusses the ocean chemistry of this increase).
Northern ecosystems are enormous carbon stores. The boreal forest holds more carbon than any other land biome, most of it not in the trees but in soils and peat. Peatlands, where waterlogging and cold slow decomposition so that plant remains accumulate for thousands of years, cover only a few percent of Earth's land but store roughly a third or more of the world's soil carbon. Canada has about a quarter of the world's peatlands, including the Hudson Bay Lowlands of northern Ontario and Manitoba, one of the largest peatland complexes on Earth, and Alaska also has extensive peatlands and permafrost. Thawing permafrost and drying peat could release some of this carbon as carbon dioxide and methane, a feedback examined in lesson 12. The figures for these stores are uncertain and vary among studies; BIOL-440 covers northern ecosystems in detail.
The nitrogen cycle
Nitrogen makes up 78 percent of the atmosphere, yet it often limits plant growth, because most organisms cannot use nitrogen gas (N₂) directly. Nitrogen fixation converts N₂ to ammonia and is carried out by certain bacteria and archaea, some free-living and some in mutualisms with legumes, alders and lichens (lesson 9). Lightning fixes a small amount. In soil, ammonium is converted by nitrifying bacteria to nitrite and then nitrate, which plants absorb readily but which also leaches easily into groundwater and streams. Denitrifying bacteria in waterlogged, oxygen-poor soils and sediments return nitrogen to the air as N₂ and nitrous oxide (N₂O), a potent greenhouse gas. Since the early twentieth century, the Haber–Bosch process has allowed industry to fix atmospheric nitrogen for fertilizer, and human activity now fixes roughly as much nitrogen as all natural processes on land combined, doubling the nitrogen moving through terrestrial ecosystems.
| Process | Transformation | Carried out by |
|---|---|---|
| Nitrogen fixation | N₂ to NH₃ (ammonia) | Rhizobium, Frankia, cyanobacteria, free-living bacteria; Haber–Bosch industry |
| Ammonification (mineralization) | Organic N to NH₄⁺ | Decomposers |
| Nitrification | NH₄⁺ to NO₂⁻ to NO₃⁻ | Nitrifying bacteria and archaea |
| Assimilation | NH₄⁺ or NO₃⁻ to organic N | Plants and microbes |
| Denitrification | NO₃⁻ to N₂ and N₂O | Denitrifying bacteria in low-oxygen conditions |
The phosphorus cycle and eutrophication
Phosphorus has no significant gaseous phase. It enters ecosystems mainly from the slow weathering of rocks and moves through soils, organisms and water before settling into sediments, where it may stay for millions of years. Because it cycles slowly and binds tightly to soil particles, phosphorus is often the nutrient that limits production in fresh water. When phosphorus enters lakes from fertilizer runoff, manure, sewage and detergents, algae and cyanobacteria bloom. When the blooms die and sink, their decomposition uses up oxygen in the deep water, killing fish and invertebrates, a process called eutrophication. Some cyanobacteria also produce toxins harmful to people, pets and livestock.
The decisive evidence came from the Experimental Lakes Area in northwestern Ontario. In 1973, David Schindler and colleagues divided Lake 226 with a plastic curtain and added carbon and nitrogen to both halves but phosphorus to only one. The half with phosphorus turned bright green with algae within weeks; the other stayed clear. Aerial photographs of the divided lake became one of the most famous images in environmental science and helped persuade governments in Canada and the United States to limit phosphorus in detergents and sewage.
Lake Erie, the shallowest and warmest of the Great Lakes, became a symbol of eutrophication in the 1960s and recovered after phosphorus controls under the Canada–United States Great Lakes Water Quality Agreement, first signed in 1972. Since the mid-1990s, however, large cyanobacterial blooms have returned to its western basin each summer, fed now mainly by dissolved phosphorus running off farmland in the Maumee River watershed and elsewhere, with warmer water and heavy spring rains making them worse. In August 2014, a bloom contaminated the drinking water intake of Toledo, Ohio, leaving about half a million people without safe tap water for several days. Under the 2012 amendment to the agreement, Canada and the United States in 2016 adopted targets to cut spring phosphorus loads to the western and central basins by 40 percent from 2008 levels, with domestic action plans in both countries, including a US action plan updated in 2026; progress so far has been slower than hoped.
Worked problem
A phosphorus reduction target
Suppose the spring total phosphorus load from a river to western Lake Erie was 860 metric tons in the 2008 reference year. What load meets a 40 percent reduction target, and by how much must loads fall if this year's load is 780 metric tons?
Show solution
- Target load: 860 × (1 − 0.40) = 516 metric tons.
- Required further reduction from 780 metric tons: 780 − 516 = 264 metric tons.
- As a percentage of this year's load: 264 / 780 ≈ 34 percent.
Answer: The target is 516 metric tons, so loads must fall by about 264 metric tons, or a third of the current load. The figures are invented for illustration; actual loads vary greatly with spring rainfall.
Ecosystem budgets and watersheds
Ecosystem ecologists often study whole watersheds, measuring everything that enters in precipitation and everything that leaves in stream water. At the Hubbard Brook Experimental Forest in New Hampshire, Gene Likens, F. Herbert Bormann and colleagues began such budgets in 1963. When they cut all the trees in one watershed and suppressed regrowth with herbicide, stream nitrate concentrations rose more than fortyfold, showing that living vegetation holds nutrients in the ecosystem. Hubbard Brook research also documented acid rain in North America and, later, the slow recovery of soils and streams after sulfur dioxide emissions were cut under US and Canadian law. Long-term watershed studies remain among the most powerful tools in ecosystem ecology.
Common mistakes
MistakeEnergy cycles through ecosystems like nutrients.
InsteadEnergy flows one way, entering as sunlight and leaving as heat; matter cycles.
MistakeAll energy eaten by a herbivore becomes herbivore biomass.
InsteadMuch is not assimilated and most assimilated energy is lost in respiration; typically 5–20 percent passes to the next level.
MistakeMost carbon in the boreal forest is in the trees.
InsteadMost is in soils and peat, where cold slows decomposition.
MistakeNitrogen limits plants because there is little nitrogen on Earth.
InsteadNitrogen is abundant as N₂ but must be fixed before most organisms can use it.
MistakeNitrogen is always the nutrient that causes algal blooms in lakes.
InsteadPhosphorus is usually limiting in fresh water, as the Lake 226 experiment showed.
Summary and key terms
- Energy flows one way through ecosystems; matter cycles.
- NPP = GPP − plant respiration; it varies with temperature, water and nutrients among biomes.
- Trophic transfer efficiency is typically 5–20 percent, so energy pyramids narrow and food chains are short.
- Decomposition follows M = M₀e^(−kt); cold, wet conditions slow it and build peat.
- Northern soils and peatlands hold vast carbon stores that may be released as permafrost thaws.
- The nitrogen cycle involves fixation, nitrification and denitrification; human fixation now rivals natural fixation.
- Phosphorus limits fresh water; the Lake 226 experiment proved its role in eutrophication, and Lake Erie blooms persist.
- gross primary production (GPP)
- The total rate of energy capture by photosynthesis.
- net primary production (NPP)
- GPP minus plant respiration; energy stored as new plant tissue.
- trophic level
- A position in a food chain, such as producer, herbivore or carnivore.
- trophic transfer efficiency
- The fraction of production at one trophic level that becomes production at the next.
- detritus
- Dead organic matter.
- decay constant (k)
- The rate constant of exponential mass loss during decomposition.
- peatland
- A wetland where waterlogging and cold cause dead plant material to accumulate as peat.
- nitrogen fixation
- Conversion of atmospheric N₂ to ammonia.
- denitrification
- Microbial conversion of nitrate to N₂ and N₂O in low-oxygen conditions.
- eutrophication
- Nutrient enrichment of water causing algal blooms and oxygen depletion.
Practice problems
Work each problem on paper first, then reveal the answer to check.
GPP is 1,800 and plant respiration 900 g C per m² per year. What is NPP?
Show answer
900 g C per m² per year.
With 10 percent efficiency and NPP of 5,000 kJ, how much energy reaches the third trophic level?
Show answer
5,000 × 0.1 × 0.1 = 50 kJ.
Why are food chains short?
Show answer
Energy is lost at each transfer, leaving too little for additional levels.
Why do endotherms have lower production efficiency than ectotherms?
Show answer
They burn more assimilated energy to keep warm.
Litter decays with k = 0.35 per year. What is its half-life?
Show answer
0.693/0.35 ≈ 2.0 years.
Why does peat accumulate in northern wetlands?
Show answer
Cold, waterlogged, oxygen-poor conditions slow decomposition below production.
Name the process that converts nitrate to nitrogen gas, and where it occurs.
Show answer
Denitrification, in waterlogged, low-oxygen soils and sediments.
Why is phosphorus often limiting in lakes?
Show answer
It has no gas phase, enters slowly from rock weathering and binds to particles.
What did the Lake 226 experiment demonstrate?
Show answer
Adding phosphorus caused algal blooms, while carbon and nitrogen alone did not.
What did clear-cutting at Hubbard Brook show?
Show answer
Stream nitrate rose dramatically, showing vegetation retains nutrients in ecosystems.
Lesson quiz · 5 questions
Score 60% or more to complete this lesson.
Create a free account to save your progress, take quizzes and earn a certificate.