
BIOL-208 · Lesson 1 of 12 · 26 min
What ecology is and how ecologists work
Ecology is the scientific study of the interactions that determine where organisms live and how many of them there are. That definition, adapted from the Canadian ecologist Charles Krebs, is deliberately broad. It covers a single caribou trying to stay warm in a January wind, a population of snowshoe hares rising and crashing over ten years, the dozens of plant species competing for light on a prairie, and the carbon moving between the atmosphere, the boreal forest and the peat beneath it. BIOL-108 introduced ecology in one lesson as the final layer of the story of evolution. This course takes ecology apart properly: how the physical environment limits life, how populations grow and are regulated, how species compete, eat and help one another, how communities assemble and change, and how energy and nutrients move through ecosystems. The last lesson applies all of it to the global changes now reshaping North American ecosystems.
This first lesson sets out what ecology studies, the levels at which it works, and the methods ecologists use to turn observations into reliable knowledge. It ends with a short worked example of an ecological study from question to conclusion, which the rest of the course builds on.
Ecology is not environmentalism
In everyday speech, "ecology" is often used to mean caring for the environment. The two are related but not the same. Ecology is a science: it asks how nature works and tests its answers against evidence. Environmentalism is a set of values and political positions about how people should treat nature. Good environmental policy needs good ecology, because a policy built on a wrong idea of how a lake or forest works will fail. But ecology itself does not tell us what we ought to value. An ecologist can predict how much a river's fish population will fall if a dam is built; whether the dam should be built depends also on economics, law, Indigenous rights and public values. Keeping the science separate from the values makes both clearer.
Levels of ecological organization
Ecologists work at several levels of organization, and each level has its own questions and methods. Moving up the levels, new properties appear that do not exist at the level below: a single fish has a body temperature, but only a population has a birth rate, and only a community has a species richness.
| Level | Definition | Typical questions |
|---|---|---|
| Individual (organism) | One living organism | How does a frog survive freezing? What temperatures can a beetle tolerate? |
| Population | Individuals of one species in one area at the same time | Why do hare numbers cycle? What limits the size of a fish stock? |
| Community | All the populations of different species living and interacting in an area | Why do some lakes have more fish species than others? What happens when a predator is removed? |
| Ecosystem | A community plus its physical environment, linked by flows of energy and matter | How much carbon does a peatland store? Where does nitrogen in a stream come from? |
| Landscape | A mosaic of ecosystems across a region | How does forest fragmentation affect songbirds moving between patches? |
| Biosphere | All ecosystems on Earth | How is climate change shifting the ranges of species? |
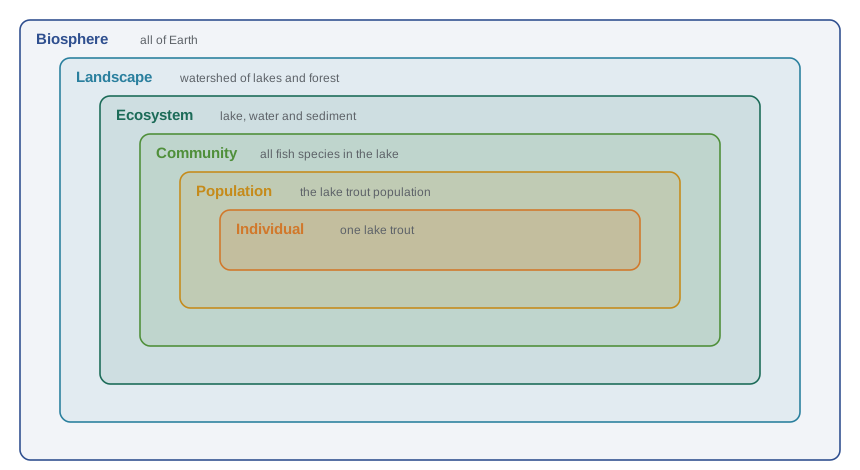
Two terms are worth fixing early. The biotic environment is the living part: other organisms of the same and different species. The abiotic environment is the non-living part: temperature, water, light, soil, nutrients, wind and fire. Most ecological questions involve both. A plant's growth depends on sunlight and soil nitrogen (abiotic) but also on the insects that eat its leaves and the fungi that help its roots absorb water (biotic).
The central questions: distribution and abundance
Krebs's definition focuses on two things: distribution (where organisms are found) and abundance (how many there are). Almost every ecological question reduces to one of these. Why does the sugar maple reach its northern limit near the boundary between the mixed forest and the boreal forest? Why were there millions of passenger pigeons in the nineteenth century and none today? Why do some years bring outbreaks of spruce budworm that defoliate whole forests? Distribution and abundance are linked: a species is absent from places where it cannot maintain a population, and rare where conditions only just allow it to persist.
Ecologists recognize several kinds of explanation for a species' distribution. It may be limited by dispersal: the species has never reached a suitable place, as when a lake isolated after the last glaciation lacks a fish species that could live there. It may be limited by the physical environment: the place is too cold, too dry or too acidic. It may be limited by other species: a competitor, predator or disease excludes it. Or it may be limited by habitat selection: the species could live there but chooses not to. Transplant experiments, which move organisms beyond their current range to see whether they survive and reproduce, are the classic test of these explanations.
Scale in space and time
Ecological processes happen at very different scales. A leaf adjusts its pores within minutes; a population of lemmings may rise and fall over three or four years; a forest recovers from fire over a century; ranges of tree species shifted northward over thousands of years after the ice sheets melted. The scale at which you observe changes what you see. A small quadrat in a forest may show a seedling dying in the shade of a parent tree, while a satellite image of the same forest shows a stable cover of trees over decades. Neither view is wrong; they answer different questions. Good ecological studies state their scale explicitly and avoid drawing conclusions at a scale they did not measure.
How ecologists know: three approaches
Ecologists use three broad approaches, and the strongest conclusions come from combining them.
Observation and description. Careful observation of patterns in nature is where most ecological questions start. Long-term monitoring is especially valuable: the Hudson's Bay Company fur records that revealed the ten-year cycle of lynx and snowshoe hare, or decades of breeding bird surveys, show patterns no short study could. Observations reveal correlations, but correlation alone cannot show cause, because many variables change together in nature.
Experiments. In a manipulative experiment, the researcher changes one factor and compares the result with controls where it was left alone. Field experiments, such as excluding grazers with fences or adding nutrients to whole lakes, test causes in realistic conditions. The Experimental Lakes Area in northwestern Ontario, where whole lakes have been manipulated since 1968, showed in the 1970s that phosphorus caused algal blooms, which helped drive limits on phosphorus in detergents. Laboratory experiments offer more control but less realism. A good experiment has replication (several independent units per treatment), randomization (treatments assigned by chance) and controls.
Models. A model is a simplified description of a system, often written as equations. Models make assumptions explicit, produce testable predictions and let us explore situations we cannot easily observe, such as a population over 200 years. This course uses many small mathematical models written in Python, from exponential growth to predator–prey cycles. A model is judged by how well its predictions match data, not by how realistic it looks.
Hypotheses, predictions and replication
A scientific hypothesis is a proposed explanation that makes testable predictions. "Moose browsing limits the height of balsam fir on Isle Royale" predicts that fir inside fences that exclude moose will grow taller than fir outside. If the prediction fails, the hypothesis is weakened; if it succeeds repeatedly, our confidence grows but never becomes absolute. Ecology often deals with multiple working hypotheses at once, since several causes may act together.
Replication matters because nature is variable. If you fence one plot and leave one plot open, any difference might be due to soil or chance. Pseudoreplication, a term introduced by Stuart Hurlbert in 1984, is the error of treating repeated measurements within one experimental unit as if they were independent replicates. Measuring 50 trees inside a single fenced plot gives 50 measurements but only one replicate of the treatment. Statistical analysis, starting with means, variation and tests of difference, is essential, and the examples in this course use Python to compute them.
Worked problem
Designing a browsing experiment
A park ecologist suspects deer are preventing tree seedlings from establishing in a forest. Design a simple experiment and state what result would support the hypothesis.
Show solution
- Hypothesis: deer browsing reduces seedling density.
- Prediction: plots protected from deer will have more seedlings than unprotected plots after several years.
- Design: choose 10 matched pairs of plots across the forest; within each pair, randomly fence one plot (exclosure) and leave the other open as a control.
- Measure seedling density in every plot at the start and each year for five years.
- Analysis: compare the change in density between fenced and open plots across the 10 pairs, using a paired test.
Answer: If fenced plots consistently gain more seedlings than their paired open plots, the hypothesis is supported. Using 10 pairs, not one, provides genuine replication and controls for differences in soil and light between parts of the forest.
import numpy as np
from scipy import stats

# Invented data: seedlings per plot after 5 years in 10 paired plots
fenced = np.array([42, 37, 51, 29, 46, 39, 55, 33, 48, 40])
open_  = np.array([18, 22, 25, 15, 27, 19, 30, 14, 26, 21])
diff = fenced - open_
t, p = stats.ttest_rel(fenced, open_)
print("mean fenced:", fenced.mean(), " mean open:", open_.mean())
print("mean difference:", diff.mean(), " sd of differences:", round(diff.std(ddof=1), 2))
print(f"paired t = {t:.2f}, p = {p:.6f}")mean fenced: 42.0 mean open: 21.7 mean difference: 20.3 sd of differences: 4.0 paired t = 16.04, p = 0.000000
The paired test asks whether the differences within pairs are consistently above zero. Here every fenced plot has more seedlings than its partner, and the probability of seeing differences this large by chance alone is tiny. The design deals with the problem that the forest is patchy: each fenced plot is compared with an open plot in similar conditions.
Ecological knowledge from Indigenous peoples
Long before ecology became an academic discipline, Indigenous peoples across North America built detailed knowledge of the species and ecosystems they depended on, tested over many generations. This knowledge, often called Indigenous knowledge or traditional ecological knowledge, includes observations of animal movements, plant phenology, fire use and population changes, together with values and responsibilities toward the land. Researchers increasingly work with Indigenous knowledge holders as partners rather than as sources of data. The Mi'kmaw concept of Etuaptmumk, or two-eyed seeing, introduced by Elder Albert Marshall, describes learning to see with the strengths of Indigenous knowledge in one eye and Western science in the other. Lesson 12 returns to how these ways of knowing work together in practice, for example in caribou and fire management.
How this course is organized
The course moves up the levels of organization. Lessons 2 and 3 cover climate, biomes and how individual organisms cope with their physical environment. Lessons 4 to 6 cover populations: growth and regulation, life histories and demography, and populations spread across landscapes. Lessons 7 to 9 cover interactions between species and the structure of communities. Lesson 10 covers how communities change over time and space, and lesson 11 covers ecosystems. Lesson 12 applies the course to global change. Specialized topics have their own courses: field methods in BIOL-430, northern and boreal ecology in BIOL-440, aquatic ecology in BIOL-460, conservation biology in BIOL-367 and population genetics in BIOL-322.
Common mistakes
MistakeEcology means protecting the environment.
InsteadEcology is the science of how organisms interact with each other and their environment; environmental protection is a set of values that should be informed by it.
MistakeMeasuring many individuals within one treated plot gives many replicates.
InsteadRepeated measurements within one experimental unit are pseudoreplicates; you need several independent units per treatment.
MistakeA strong correlation in field data shows cause.
InsteadCorrelation can arise from shared causes; experiments or careful comparisons are needed to test cause.
MistakeA more complex model is always better.
InsteadA model is judged by how well its predictions match data; simple models often perform as well and are easier to understand.
MistakeCommunities and ecosystems are the same thing.
InsteadA community is the set of interacting species; an ecosystem is the community plus its physical environment and the flows of energy and matter.
Summary and key terms
- Ecology is the scientific study of the interactions that determine the distribution and abundance of organisms.
- It works at the levels of individual, population, community, ecosystem, landscape and biosphere, each with its own questions.
- Distributions may be limited by dispersal, the physical environment, other species or habitat selection.
- Ecological processes act at very different spatial and temporal scales, and conclusions should match the scale studied.
- Ecologists combine observation, experiments and models; good experiments have replication, randomization and controls.
- Pseudoreplication treats non-independent measurements as replicates and inflates confidence.
- Indigenous knowledge is a long-tested source of ecological understanding, and two-eyed seeing describes using it alongside Western science.
- ecology
- The study of the interactions that determine the distribution and abundance of organisms.
- population
- Individuals of one species living in the same area at the same time.
- community
- All the interacting populations of different species in an area.
- ecosystem
- A community together with its physical environment and the flows of energy and matter between them.
- abiotic
- Non-living factors such as temperature, water, light and nutrients.
- biotic
- Living factors: other organisms of the same or different species.
- distribution
- Where a species is found.
- abundance
- How many individuals of a species are present.
- replication
- Using several independent experimental units per treatment.
- pseudoreplication
- Treating non-independent measurements as independent replicates.
Practice problems
Work each problem on paper first, then reveal the answer to check.
Give one question each at the population, community and ecosystem levels about a prairie.
Show answer
Population: what limits the number of burrowing owls? Community: how does grazing change plant species richness? Ecosystem: how much carbon is stored in prairie soil?
List four kinds of explanation for why a species is absent from an area.
Show answer
Dispersal limitation, unsuitable physical environment, exclusion by other species, and habitat selection.
What experiment tests whether a plant is absent from a mountain because of cold rather than dispersal?
Show answer
A transplant experiment: move plants above their range limit and see whether they survive and reproduce.
Why was the Experimental Lakes Area important for water policy?
Show answer
Whole-lake experiments showed that phosphorus caused algal blooms, supporting limits on phosphorus in detergents.
A student fences one plot and measures 40 seedlings inside. Why is this weak evidence?
Show answer
There is only one replicate; the plot may differ from others for reasons unrelated to fencing.
Give one strength and one weakness of laboratory experiments in ecology.
Show answer
Strength: control of conditions. Weakness: less realism than the field.
What makes a hypothesis scientific?
Show answer
It makes predictions that can be tested and could be shown wrong.
Why might the same forest look stable from a satellite but unstable in a small plot?
Show answer
Processes at small scales (individual deaths) average out at large scales; the scale of observation changes the pattern seen.
Explain the difference between ecology and environmentalism.
Show answer
Ecology describes how nature works; environmentalism is a set of values about how people should treat nature.
What does two-eyed seeing mean?
Show answer
Using the strengths of Indigenous knowledge and of Western science together, as introduced by Mi'kmaw Elder Albert Marshall.
Lesson quiz · 5 questions
Score 60% or more to complete this lesson.
Create a free account to save your progress, take quizzes and earn a certificate.