
ARCH-340 · Lesson 11 of 12 · 19 min
Equity and the city
Beatrice Lafontaine, executive director of Greenway Homes, was the client for the housing studio in ARCH-201. She comes to the class with a question instead of a talk. 'Your framework is good,' she says. 'Frequent buses, a plaza, a park, trees, a greenway that floods in the right places, two thousand six hundred new homes. Now tell me: in fifteen years, will the people who live on Aldous Street today still be living here? Or will they have been priced out by the very improvements they asked for?' The students have no ready answer. Lafontaine has seen it happen in other neighborhoods. 'Every good thing you add makes the district more desirable,' she says. 'That is the point. But desirability is a price, and someone pays it. Your job this week is to figure out who, and what you can do about it.'
Cities are not neutral
Cities distribute benefits and burdens unequally: clean air and polluted air, shade trees and hot pavement, parks and highways, good schools and closed ones, frequent transit and none, safe streets and dangerous ones. Much of this pattern was designed. Equity in urban design means recognizing how past decisions produced present inequalities, and making decisions now that reduce rather than reproduce them. It is related to, but different from, equality: treating every area the same may leave existing gaps in place, whereas equity directs more resources to those who have had less.
The history is specific to each city. In the United States, the federal Home Owners' Loan Corporation drew maps in the 1930s grading neighborhoods for lending risk, outlining Black, immigrant and mixed areas in red; these redlined areas were then largely denied mortgages for decades. Racial covenants in deeds barred Black people and other people of color from many neighborhoods; the University of Minnesota's Mapping Prejudice project has documented thousands in Hennepin County alone. Covenants were made unenforceable by the Supreme Court in Shelley v. Kraemer in 1948 and illegal by the Fair Housing Act of 1968. Urban renewal and highways then cleared or divided many of the communities that had been confined, as Lesson 2 described.
Research has linked these histories to present patterns. Studies in many cities have found, for example, that formerly redlined or excluded areas tend today to have fewer trees, hotter summer temperatures, more pollution and lower life expectancy. In the greenway district, the students find that the streets south of the greenway, where the rail yards and lumber yard were and where most renters and newcomers live, have about half the tree canopy of the streets north of the avenue, and that its only park is a fenced lot beside the rail line.
Gentrification and displacement
Gentrification is the process by which an area that has had little investment attracts new investment and wealthier residents, raising land values and rents. It can bring benefits to existing residents, such as new shops, better services and safer streets, if they are able to stay. The risk is displacement. The planner Peter Marcuse distinguished three kinds in 1985:
- Direct displacement: people are forced out by rising rents, evictions, demolition or conversion of their homes.
- Exclusionary displacement: people like the current residents can no longer move into the area because it has become too expensive, so the community cannot renew itself.
- Cultural or displacement pressure: the shops, services, institutions and social networks that serve a community disappear, so even those who stay feel pushed out.
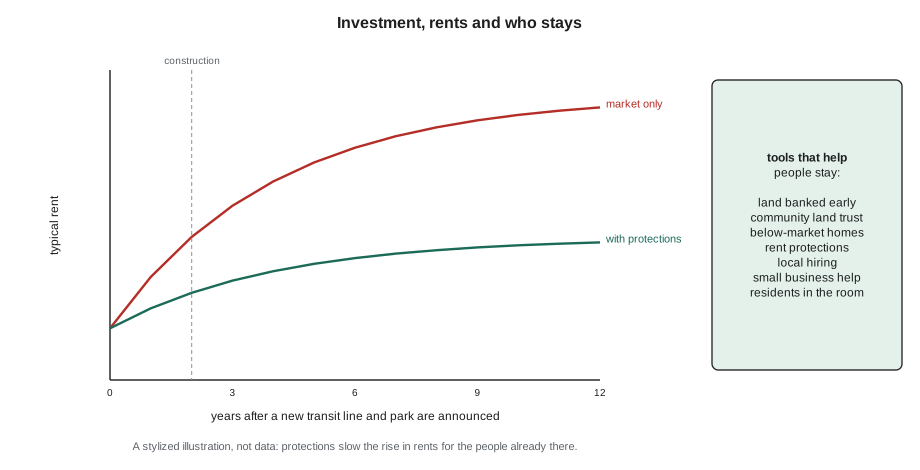
Public investments such as transit lines and parks are among the most powerful triggers of rising land values. Researchers use the term green gentrification for the effect of new parks and greenways, and have studied it around projects such as the High Line in New York and the 606 trail in Chicago, where property values near the trail rose markedly in some neighborhoods. The students' framework, with its frequent transit, plaza, greenway and stormwater park, is exactly the kind of plan that could cause it.
Measuring risk
Cities and researchers map displacement risk using indicators such as the share of renters, household income, recent rent increases, the share of residents who are racialized or newcomers, and proximity to new investment. The students build a simple index for four areas of the district, standardizing each indicator and averaging them.
# A simple displacement risk index for four areas (z-scores, equal weights)
areas = {  # renters share, median income (thousands), rent change over 5 years, distance to new transit (ft)
    "A": (0.72, 38, 0.24, 1000),
    "B": (0.55, 52, 0.12, 3000),
    "C": (0.81, 31, 0.31, 1500),
    "D": (0.40, 74, 0.08, 5200),
}
sign = (1, -1, 1, -1)          # more renters, lower income, faster rent rises, closer transit = more risk
cols = list(zip(*areas.values()))
def z(col):
    m = sum(col) / len(col)
    s = (sum((x - m) ** 2 for x in col) / len(col)) ** 0.5
    return [(x - m) / s for x in col]
zs = [z(c) for c in cols]
names = list(areas)
score = {n: sum(sign[k] * zs[k][i] for k in range(4)) / 4 for i, n in enumerate(names)}
for n in sorted(score, key=score.get, reverse=True):
print(f"area {n}: risk index {score[n]:+.2f}")area C: risk index +1.08 area A: risk index +0.72 area B: risk index -0.39 area D: risk index -1.41
Areas C and A, the apartment blocks south of the greenway and the streets beside the rail yard, score highest; they have the most renters, the lowest incomes, the fastest rent rises and are closest to the new station. Area D, the owner-occupied streets north of the avenue, scores lowest. Desrosiers warns that indices like this hide as much as they show: the weights are a judgment, the data are old, and people are not averages. But it tells the students where their protections must start before construction does.
Tools to share the benefits
No single tool prevents displacement, and many depend on state and national policy beyond the reach of designers. But urban designers can shape a framework so that the people who live in a district now are more likely to benefit from its improvement.
- Secure land early. Public, non-profit and community ownership of land before values rise is the most durable protection. The students' proposal that the city buy the rail yard before announcing the plan (Lesson 9) is the key move.
- Community land trusts own land on behalf of a community and lease it for homes, shops or gardens that stay affordable permanently, because the land is never resold at market price. The City of Lakes Community Land Trust in Minneapolis, founded in 2002, has helped hundreds of households buy homes on land it holds in trust.
- Below-market and social housing: the framework commits 30% of new homes to below-market rents, built by Greenway Homes and other non-profits on the rail yard and lumber yard sites.
- Protections for tenants: St. Paul voters approved a rent stabilization ordinance in 2021, later amended, while Minneapolis has debated similar measures. The framework recommends right-of-first-return policies for tenants of any building that is redeveloped.
- Community benefits agreements: legally binding agreements between developers and community coalitions on local hiring, affordable space for local businesses and community facilities.
- Local businesses: affordable commercial space, help through construction, and keeping the small storefronts that new buildings tend to replace with large ones.
- Phasing: building the affordable homes first, on public land, before the investments that raise values most.
- Residents in the room: giving people who are most at risk real influence over decisions, at the collaborate or empower levels of Lesson 10.
Phasing the framework for equity
The students rewrite the order in which their framework would be built, putting the protections first. Lafontaine helps them think it through: what must happen before the plan is announced, before the first construction and before the biggest public investments open?
| Phase | Timing | Main actions |
|---|---|---|
| 0. Before announcement | Year 0 | City buys the rail yard; land trust formed with the tenants' group; tenant protections and right of first return adopted |
| 1. First homes | Years 1 to 4 | Below-market rental homes on the lumber yard and part of the rail yard; trees and rain gardens south of the greenway |
| 2. Streets and transit | Years 3 to 7 | Frequent buses, the plaza and the complete street on the avenue, with construction help and affordable space for local shops |
| 3. Park and growth | Years 5 to 15 | Stormwater park; mixed-use buildings on the avenue under inclusionary rules; infill on residential streets |
| 4. Review | Every 5 years | Track rents, tenure, who has moved and who has stayed; adjust tools |
Joon-ho notices that the order slows down the visible improvements that residents asked for at the charrette, such as the plaza and the skate court. Lafontaine agrees that this is a real trade-off, and suggests that some quick, low-cost improvements, such as temporary seating, lighting and the youth court under a simple canopy, go ahead in the first year so that residents see change without a sharp rise in land values. Ingrid adds a monitoring measure to phase 4: the share of households in the district five years later that were already there at the start. If it falls sharply, the protections are not working. Callum asks what happens if the city cannot afford to buy the rail yard. 'Then you say so, and you say what it will cost the people on Aldous Street,' Lafontaine replies. 'A plan that hides its risks is not a plan for them.'
Designing for everyone
Equity is also about who the public realm is designed for. Cities have long been designed around an imagined able-bodied adult driver commuting to work. Many people's daily lives look different.
- Children need safe routes to school, places to play close to home and streets slow enough to cross. A district that works for an eight-year-old walking alone works for almost everyone.
- Older people need places to sit every short distance, level and well-maintained sidewalks free of ice, enough time to cross at signals, and washrooms. The World Health Organization's guide to age-friendly cities (2007) set out these needs.
- People with disabilities need accessible routes, crossings, transit and buildings, designed in from the start following the principles of universal design.
- Women and gender-diverse people often make more complex trips combining work, care and errands, and are more affected by fear of harassment in poorly lit or deserted places. Cities such as Vienna have practiced gender-sensitive planning since the 1990s.
- People with low incomes depend most on transit, walking, public spaces, libraries and free amenities.
Environmental justice adds that pollution, heat and flooding fall unevenly. The students' framework directs the first tree planting and the first green infrastructure to the streets south of the greenway, where canopy is lowest, heat is highest and basements flooded in May.
Exercise 11: equity audit
- Research the history of your district: who lived there, who was excluded or displaced, and how.
- Map tree canopy, park access, transit service and flood risk, and compare the areas with the highest and lowest incomes.
- Build a simple displacement risk index for four to six areas of your district, and explain its limits.
- Propose a package of at least five tools to help existing residents benefit and stay.
- Walk your district imagining you are eight years old, then eighty. List what you would change.
Designers' responsibility
Some students ask whether these questions belong to architects at all, or only to politicians and housing agencies. Desrosiers answers that designers cannot fix housing markets alone, but they make many decisions that matter: whether a framework places affordable homes on the best sites near transit or on leftover land by the rail line, whether a park is designed for people who already live nearby or for visitors from elsewhere, whether a street design keeps room for small shops, and whether the drawings shown at public meetings depict the people who live in the district now. Professional codes of conduct in the United States ask architects to serve the public interest, and the public includes people who will never hire an architect. She asks each student to write one paragraph on how their own part of the framework affects the people most at risk, and to change one thing in their design as a result.
Common mistakes
MistakeAssuming improvements benefit everyone equally.
InsteadAsk who will pay for rising values and plan protections before construction.
MistakeTreating equity as equal treatment of every area.
InsteadDirect resources first to areas that have had the least.
MistakeRelying on a risk index as truth.
InsteadUse it to start conversations and check it with residents.
MistakeLeaving affordable housing to the end of a plan.
InsteadSecure land and build affordable homes first.
MistakeDesigning for an imagined average adult.
InsteadDesign for children, older people, people with disabilities and people with low incomes.
Summary and key terms
- Cities distribute benefits and burdens unequally, often by design; equity directs resources to reduce gaps.
- Dispossession, covenants, redlining, renewal and highways shaped today's inequalities in trees, heat, pollution and health.
- Gentrification can cause direct, exclusionary and cultural displacement; public investment in transit and parks can trigger it.
- Displacement risk can be mapped with indicators of tenure, income, rents and proximity to investment.
- Early land acquisition, land trusts, below-market housing, tenant protections, benefits agreements, business support and phasing help people stay.
- Equitable design serves children, older people, people with disabilities, women and people with low incomes.
- Equity
- Fairness in the distribution of benefits and burdens, directing more to those who have had less.
- Redlining
- The practice of denying loans and investment to areas outlined in red on lending maps, often because of the race of residents.
- Gentrification
- Investment and an influx of wealthier residents that raise land values and rents in a lower-income area.
- Displacement
- The forced or effective removal of residents, businesses or institutions from an area.
- Community land trust
- A non-profit that holds land for a community and leases it for permanently affordable uses.
- Community benefits agreement
- A binding agreement between a developer and community groups on local benefits.
Practice problems
Work each problem on paper first, then reveal the answer to check.
Name Marcuse's three kinds of displacement.
Show answer
Direct, exclusionary and cultural (displacement pressure).
Why are public investments such as transit and parks linked to displacement?
Show answer
They raise land values and rents, which can price out existing residents.
Why does a community land trust keep homes affordable permanently?
Show answer
The land is held in trust and never resold at market price, so only the building's limited value changes hands.
Give two design measures that make a district work better for older people.
Show answer
Frequent seating, level and ice-free sidewalks, longer crossing times, public washrooms.
What does the code's risk index show, and what are its limits?
Show answer
Which areas combine the most risk factors; its weights are judgments, its data may be old and it cannot capture individual circumstances.
Lesson quiz · 5 questions
Score 60% or more to complete this lesson.
Create a free account to save your progress, take quizzes and earn a certificate.