
STAT-252 · Lesson 3 of 12 · 23 min
Point estimators: bias, variance and mean squared error
An estimator is a rule for turning data into a guess at a parameter. There are always many rules to choose from. To estimate the centre of a symmetric distribution we could use the sample mean, the median, the midrange or a trimmed mean; to estimate a variance we could divide the sum of squared deviations by \(n\), by \(n - 1\) or by \(n + 1\). This lesson sets out the criteria for comparing estimators: bias, variance, mean squared error, consistency and efficiency. The criteria are properties of sampling distributions, so they describe how a rule performs on average over many samples, not how close a particular estimate happens to be to the truth.
Bias
Let \(T = T(X_1, \ldots, X_n)\) be an estimator of \(\theta\). Its bias is
and \(T\) is unbiased if the bias is zero for every \(\theta \in \Theta\). The phrase 'for every \(\theta\)' matters: the estimator \(T = 5\) is unbiased when \(\theta = 5\) and badly biased otherwise, and nobody would call it a good estimator. Unbiasedness says that the sampling distribution is centred at the truth, so that over many samples the errors average out. The sample mean is unbiased for the population mean, the sample proportion for a population proportion, and \(\hat F_n(x)\) for \(F(x)\), all by linearity of expectation.
The sample variance \(S^2 = \frac{1}{n-1}\sum (X_i - \bar X)^2\) is unbiased for \(\sigma^2\) for any distribution with a finite variance, not only the normal. The proof uses the decomposition \(\sum (X_i - \mu)^2 = \sum (X_i - \bar X)^2 + n(\bar X - \mu)^2\). Taking expectations, the left side has expectation \(n\sigma^2\) and \(n(\bar X - \mu)^2\) has expectation \(n\operatorname{Var}(\bar X) = \sigma^2\). So \(E[\sum (X_i - \bar X)^2] = (n - 1)\sigma^2\), and dividing by \(n - 1\) gives an unbiased estimator. Dividing by \(n\) gives \(\hat\sigma^2 = \frac{n-1}{n}S^2\), whose bias is \(-\sigma^2/n\): it underestimates on average because the deviations are measured from \(\bar X\), which is closer to the data than \(\mu\) is.
Unbiasedness does not survive nonlinear transformation. Since \(S^2\) is unbiased for \(\sigma^2\) and \(\sqrt{\cdot}\) is concave, Jensen's inequality gives \(E[S] \le \sqrt{E[S^2]} = \sigma\), with strict inequality unless \(S\) is constant. So the sample standard deviation is biased downward. For normal samples the bias factor \(E[S]/\sigma\), called \(c_4\) in quality control, is about 0.94 for \(n = 5\) and 0.99 for \(n = 25\). An unbiased estimator of \(\theta\) gives an unbiased estimator of \(g(\theta)\) only when \(g\) is linear.
Variance and mean squared error
An unbiased estimator can still be useless if it is very variable. The single observation \(X_1\) is unbiased for \(\mu\), but it ignores \(n - 1\) of the observations. The natural measure that combines both kinds of error is the mean squared error
The decomposition follows by adding and subtracting \(E[T]\) inside the square: \((T - \theta)^2 = (T - E[T])^2 + 2(T - E[T])(E[T] - \theta) + (E[T] - \theta)^2\), and the middle term has expectation zero. MSE is the expected squared distance of the estimator from the truth. Its square root, the root mean squared error, is on the scale of the data and is often reported in simulation studies.
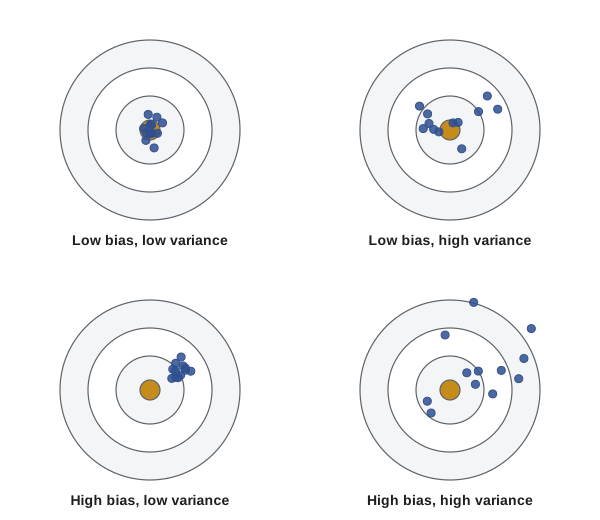
The decomposition explains why a biased estimator can beat an unbiased one: accepting a little bias can buy a large reduction in variance. For a normal sample, consider estimators of \(\sigma^2\) of the form \(c\sum (X_i - \bar X)^2\). Let \(W = \sum(X_i - \bar X)^2\), so \(W/\sigma^2 \sim \chi^2_{n-1}\) with mean \(n - 1\) and variance \(2(n - 1)\). Then \(E[cW] = c(n - 1)\sigma^2\) and \(\operatorname{Var}(cW) = 2c^2(n - 1)\sigma^4\), so
Differentiating in \(c\) and setting the derivative to zero gives \(4c(n - 1) + 2(n - 1)(c(n - 1) - 1) = 0\), so \(c = 1/(n + 1)\). Among estimators of this form, dividing by \(n + 1\) minimizes mean squared error; dividing by \(n\) comes second; the unbiased divisor \(n - 1\) comes last. The differences are small for large \(n\), but the example makes a general point: unbiasedness is one desirable property, not the definition of a good estimator. Ridge regression, shrinkage estimators and much of modern machine learning deliberately trade bias for variance.
Comparing estimators: efficiency
For two unbiased estimators \(T_1\) and \(T_2\), the relative efficiency of \(T_2\) with respect to \(T_1\) is \(\operatorname{Var}(T_1)/\operatorname{Var}(T_2)\). If it is 0.64, then \(T_2\) needs about \(1/0.64 \approx 1.56\) times as many observations to match the precision of \(T_1\). For a normal sample, the sample median has variance approximately \(\pi\sigma^2/(2n)\) for large \(n\), against \(\sigma^2/n\) for the mean, so its efficiency relative to the mean is \(2/\pi \approx 0.64\). That is the price of robustness: the median ignores how far the extreme observations are from the centre, which wastes information when the data really are normal and protects against outliers when they are not. For the double-exponential (Laplace) distribution, whose tails are heavier, the order reverses and the median has efficiency 2 relative to the mean.
Worked problem
Estimating the upper limit of a uniform distribution
Waiting times at a crossing light are uniform on \([0, \theta]\) with \(\theta\) unknown. From a sample of \(n\) waiting times, compare \(T_1 = 2\bar X\) and \(T_2 = \frac{n+1}{n}X_{(n)}\).
Show solution
- \(E[X_i] = \theta/2\) and \(\operatorname{Var}(X_i) = \theta^2/12\), so \(E[T_1] = \theta\) and \(\operatorname{Var}(T_1) = 4\theta^2/(12n) = \theta^2/(3n)\).
- From lesson 1, \(X_{(n)}\) has density \(nx^{n-1}/\theta^n\), mean \(n\theta/(n + 1)\) and \(E[X_{(n)}^2] = n\theta^2/(n + 2)\), so \(\operatorname{Var}(X_{(n)}) = \frac{n\theta^2}{(n+1)^2(n+2)}\).
- Hence \(T_2\) is unbiased with \(\operatorname{Var}(T_2) = \frac{(n+1)^2}{n^2}\operatorname{Var}(X_{(n)}) = \frac{\theta^2}{n(n+2)}\).
- The relative efficiency of \(T_1\) to \(T_2\) is \(\frac{\theta^2/(n(n+2))}{\theta^2/(3n)} = \frac{3}{n + 2}\), which tends to zero.
Answer: Both are unbiased, but \(T_2\) is far better: its variance falls like \(1/n^2\) rather than \(1/n\). With \(n = 28\), \(T_1\) is only one tenth as efficient. The maximum carries almost all the information about the upper endpoint.
The uniform example also shows that the usual \(1/n\) rate is not a law of nature. When the support of the distribution depends on the parameter, estimators can converge faster, and lesson 7 explains why the Cramér–Rao bound does not apply there.
Consistency
A sequence of estimators \(T_n\) is consistent for \(\theta\) if \(T_n \to \theta\) in probability for every \(\theta\): for each \(\varepsilon > 0\), \(P_\theta(|T_n - \theta| > \varepsilon) \to 0\) as \(n \to \infty\). Consistency is the minimal requirement of a sensible estimator: with enough data it should get the answer right. A convenient sufficient condition comes from Chebyshev's inequality applied to \((T_n - \theta)^2\): by Markov's inequality, \(P(|T_n - \theta| > \varepsilon) \le \operatorname{MSE}(T_n)/\varepsilon^2\), so if the MSE tends to zero, the estimator is consistent. In particular, an estimator whose bias and variance both tend to zero is consistent. Thus \(\bar X\), \(S^2\), \(\hat\sigma^2\) and both uniform estimators above are consistent.
The law of large numbers gives consistency of sample moments directly, and the continuous mapping theorem extends it: if \(T_n \to \theta\) in probability and \(g\) is continuous at \(\theta\), then \(g(T_n) \to g(\theta)\) in probability. So \(S = \sqrt{S^2}\) is consistent for \(\sigma\), although it is biased for every \(n\). Consistency and unbiasedness are logically independent. \(X_1\) is unbiased but not consistent; \(\hat\sigma^2\) is biased but consistent.
import random, math
from statistics import mean, median, variance, pvariance

rng = random.Random(252)
n, reps, sigma2 = 10, 40000, 4.0

# three divisors for the variance of a normal sample
res = {"n-1": [], "n": [], "n+1": []}
for _ in range(reps):
    x = [rng.gauss(0, 2) for _ in range(n)]
    w = sum((v - mean(x)) ** 2 for v in x)
    res["n-1"].append(w / (n - 1)); res["n"].append(w / n); res["n+1"].append(w / (n + 1))
print("divisor   bias     variance   MSE")
for k, est in res.items():
    b = mean(est) - sigma2; v = pvariance(est)
    print(f"{k:>5}  {b:+.4f}   {v:.4f}   {v + b * b:.4f}")
print(f"theory MSE: n-1 {2*sigma2**2/(n-1):.4f}, n {(2*(n-1)+1)*sigma2**2/n**2:.4f}, n+1 {2*sigma2**2/(n+1):.4f}")

# mean versus median: normal and Laplace data
def laplace():
    return rng.expovariate(1) * (1 if rng.random() < 0.5 else -1)
for name, gen in (("normal", lambda: rng.gauss(0, 1)), ("Laplace", laplace)):
    ms, md = [], []
    for _ in range(10000):
        x = [gen() for _ in range(51)]
        ms.append(mean(x)); md.append(median(x))
    print(f"{name:>7}: var(mean) {pvariance(ms):.5f}, var(median) {pvariance(md):.5f}, "
          f"efficiency of median {pvariance(ms) / pvariance(md):.2f}")

# uniform endpoint: 2*mean versus (n+1)/n * max
theta, m = 90.0, 28
t1, t2 = [], []
for _ in range(20000):
    x = [rng.uniform(0, theta) for _ in range(m)]
    t1.append(2 * mean(x)); t2.append((m + 1) / m * max(x))
print(f"uniform n={m}: mean T1 {mean(t1):.2f}, T2 {mean(t2):.2f};"
f" var T1 {pvariance(t1):.2f} (theory {theta**2/(3*m):.2f}), var T2 {pvariance(t2):.2f} (theory {theta**2/(m*(m+2)):.2f})")divisor bias variance MSE
n-1 +0.0018 3.5792 3.5792
n -0.3984 2.8992 3.0579
n+1 -0.7258 2.3960 2.9228
theory MSE: n-1 3.5556, n 3.0400, n+1 2.9091
normal: var(mean) 0.01986, var(median) 0.03076, efficiency of median 0.65
Laplace: var(mean) 0.03830, var(median) 0.02415, efficiency of median 1.59
uniform n=28: mean T1 90.00, T2 90.02; var T1 97.14 (theory 96.43), var T2 9.60 (theory 9.64)The simulation confirms the algebra: the unbiased divisor has the largest MSE of the three, and dividing by \(n + 1\) has the smallest. The median's efficiency is near 0.64 for normal data and above 1 for the heavier-tailed Laplace data, so which estimator is better depends on the distribution, which is the starting point of robust statistics. For the uniform endpoint the maximum-based estimator's variance is about a tenth of the other's, matching the theory.
No estimator is best everywhere
Why not simply look for the estimator with the smallest MSE? Because MSE is a function of \(\theta\), and two estimators' MSE curves usually cross. The constant estimator \(T = 5\) has MSE \((5 - \theta)^2\), which is zero at \(\theta = 5\), so no estimator can have uniformly smallest MSE unless it is perfect at every parameter value, which is impossible. Statistical theory responds in three ways. The first restricts the class of estimators, for instance to unbiased ones, and then looks for the best within it: lesson 7 shows that among unbiased estimators there is often one with uniformly smallest variance, and gives a lower bound that no unbiased estimator can beat. The second summarizes the MSE curve by a single number, either its maximum over \(\Theta\), which leads to minimax estimators, or its average with respect to a weighting of the parameter values, which leads to Bayes estimators (lesson 12). The third studies large samples, where the comparison simplifies: lesson 6 shows that maximum likelihood estimators are asymptotically unbiased with the smallest possible asymptotic variance under regularity conditions. Squared error is itself a choice. Absolute error \(|T - \theta|\) penalizes large mistakes less severely and leads to medians rather than means; asymmetric losses are natural when overestimating a reserve is cheaper than underestimating it. The choice of loss should come from the problem, but squared error is the default because it is mathematically convenient and leads to the clean variance-plus-bias decomposition.
Standard errors
Reporting an estimate without a measure of its precision is half an answer. The standard error of an estimator is its standard deviation, and in practice we report an estimate of it: \(S/\sqrt n\) for the mean, \(\sqrt{\hat p(1 - \hat p)/n}\) for a proportion. When no formula is available, lesson 8 shows how the bootstrap estimates a standard error by resampling. A standard error answers the question of how much an estimate would vary from sample to sample. It does not include bias, and it does not account for errors that the model leaves out, such as a sample that is not random.
Common mistakes
MistakeBelieving that an unbiased estimator is always better than a biased one.
InsteadMean squared error charges for variance as well as bias; for normal variances, dividing by \(n + 1\) beats the unbiased divisor \(n - 1\).
MistakeAssuming \(S\) is unbiased because \(S^2\) is.
InsteadBy Jensen’s inequality \(E[S] < \sigma\); unbiasedness is not preserved by nonlinear functions.
MistakeThinking a consistent estimator must be unbiased.
Instead\(\hat\sigma^2\) is biased for every \(n\) but consistent; \(X_1\) is unbiased but not consistent.
MistakeReading a small standard error as proof that an estimate is accurate.
InsteadThe standard error measures sampling variability only; bias and model failure are not included.
MistakeAssuming every estimator converges at the rate \(1/\sqrt n\).
InsteadWhen the support depends on the parameter, as for the uniform endpoint, the rate can be \(1/n\).
Summary and key terms
- Bias is \(E[T] - \theta\); \(T\) is unbiased if the bias is zero for every \(\theta\).
- \(\operatorname{MSE} = \operatorname{Var} + \operatorname{bias}^2\); a little bias can buy a large reduction in variance.
- \(S^2\) is unbiased for \(\sigma^2\) for any distribution; \(S\) is biased downward.
- Relative efficiency compares variances of unbiased estimators; the median has efficiency \(2/\pi\) for normal data.
- Consistency means convergence in probability to \(\theta\); MSE tending to zero is sufficient.
- estimator
- A statistic used to estimate a parameter.
- bias
- \(E_\theta[T] - \theta\).
- unbiased
- Having zero bias for every value of \(\theta\).
- mean squared error
- \(E[(T - \theta)^2]\), equal to variance plus squared bias.
- relative efficiency
- The ratio of the variances of two unbiased estimators.
- consistent
- Converging in probability to the true parameter as the sample grows.
- standard error
- The standard deviation of an estimator.
Practice problems
Work each problem on paper first, then reveal the answer to check.
Show that \(\hat p = X/n\) is unbiased for \(p\) when \(X \sim \text{Binomial}(n, p)\), and find its MSE.
Show answer
\(E[\hat p] = np/n = p\); MSE equals the variance \(p(1 - p)/n\).
Find the bias of \(\hat\sigma^2 = \frac1n\sum(X_i - \bar X)^2\) and show it is consistent.
Show answer
\(E[\hat\sigma^2] = \frac{n-1}{n}\sigma^2\), so the bias is \(-\sigma^2/n \to 0\). For normal data its variance is \(2(n-1)\sigma^4/n^2 \to 0\), so MSE tends to zero and it is consistent; in general the law of large numbers gives the same conclusion.
Is \(\bar X^2\) unbiased for \(\mu^2\)? If not, find an unbiased estimator.
Show answer
\(E[\bar X^2] = \mu^2 + \sigma^2/n\), so it is biased upward. \(\bar X^2 - S^2/n\) is unbiased.
For an exponential sample with mean \(\theta\), compare \(\bar X\) and \(nX_{(1)}\) as estimators of \(\theta\).
Show answer
Both are unbiased: \(X_{(1)}\) is exponential with mean \(\theta/n\). But \(\operatorname{Var}(nX_{(1)}) = \theta^2\) does not shrink, while \(\operatorname{Var}(\bar X) = \theta^2/n\); \(\bar X\) is far better and \(nX_{(1)}\) is not consistent.
Using the MSE formula for \(cW\) in a normal sample with \(n = 5\), compute the MSE relative to \(\sigma^4\) for \(c = 1/4\), \(1/5\) and \(1/6\).
Show answer
\(2c^2 \times 4 + (4c - 1)^2\): \(c = 1/4\) gives 0.5, \(c = 1/5\) gives 0.36, \(c = 1/6\) gives about 0.333.
An estimator has bias \(3/n\) and variance \(5/n\). Is it consistent? Find its MSE for \(n = 100\).
Show answer
Yes, since both tend to zero. \(\operatorname{MSE} = 5/100 + 9/10\,000 = 0.0509\).
Lesson quiz · 5 questions
Score 60% or more to complete this lesson.
Create a free account to save your progress, take quizzes and earn a certificate.