
STAT-252 · Lesson 10 of 12 · 22 min
Likelihood ratio tests
The Neyman–Pearson lemma gives the best test for two simple hypotheses, and lesson 9 showed that optimal tests exist in a few other cases. Most real questions are more complicated: the null hypothesis is composite, there are nuisance parameters, and the alternative may involve several parameters at once. The generalized likelihood ratio test extends the lemma's idea to all of these settings by comparing the best fit under the null with the best fit overall. Neyman and Pearson proposed it in 1928, and Samuel Wilks proved in 1938 that its statistic has an approximate chi-square distribution in large samples, which made it usable almost everywhere. Together with the closely related score and Wald tests, it is the standard machinery behind the tests reported by regression software, the chi-square tests for tables, and model comparison in general.
The generalized likelihood ratio
To test \(H_0: \theta \in \Theta_0\) against \(H_1: \theta \in \Theta \setminus \Theta_0\), compute
where \(\hat\theta_0\) is the MLE under the null, the restricted MLE, and \(\hat\theta\) is the unrestricted MLE. Because the denominator maximizes over a larger set, \(0 \le \Lambda \le 1\). A value near 1 means the null fits nearly as well as the best model; a small value means the data are much more probable under some alternative. The test rejects \(H_0\) when \(\Lambda\) is small, or equivalently when the deviance-type statistic
is large. When both hypotheses are simple, this is the Neyman–Pearson test. In other cases it is not guaranteed to be optimal, but it usually performs very well and has the great advantage of being defined for any model with a likelihood.
Example: the t test is a likelihood ratio test
Let \(X_1, \ldots, X_n\) be normal with both parameters unknown, and test \(H_0: \mu = \mu_0\). The unrestricted MLEs are \(\bar x\) and \(\hat\sigma^2 = \frac1n\sum(x_i - \bar x)^2\); under the null, \(\hat\sigma_0^2 = \frac1n\sum(x_i - \mu_0)^2\). Substituting into the normal likelihood, the exponential terms both reduce to \(e^{-n/2}\), and
using the identity \(\sum(x_i - \mu_0)^2 = \sum(x_i - \bar x)^2 + n(\bar x - \mu_0)^2\). Since \(\Lambda\) is a decreasing function of \(|T|\), the likelihood ratio test is exactly the two-sided \(t\) test, and the exact \(t_{n-1}\) distribution gives its critical values. Many classical tests, including the \(F\) test of lesson 11, arise in the same way, so the likelihood ratio principle unifies them.
Wilks's theorem
Usually the exact distribution of \(\Lambda\) is not available. Wilks's theorem supplies an approximation: under the regularity conditions of lesson 6, if \(H_0\) is true and fixes \(r\) of the parameters (so the dimension of \(\Theta_0\) is \(r\) less than that of \(\Theta\)), then
The degrees of freedom equal the number of free parameters under the alternative minus the number under the null. For one parameter, the result follows from a second-order expansion: \(\ell(\theta_0) \approx \ell(\hat\theta) - \frac12 J(\hat\theta)(\hat\theta - \theta_0)^2\), so \(-2\log\Lambda \approx J(\hat\theta)(\hat\theta - \theta_0)^2\), the square of an approximately standard normal variable. A test at level 0.05 with one degree of freedom rejects when \(-2\log\Lambda > 3.84\).
Worked problem
Comparing two accident rates
A road authority records 30 accidents at site A over 10 months and 48 at site B over 12 months. Assuming Poisson counts with rates \(\lambda_A\) and \(\lambda_B\) per month, test \(H_0: \lambda_A = \lambda_B\).
Show solution
- Unrestricted MLEs: \(\hat\lambda_A = 3.0\) and \(\hat\lambda_B = 4.0\) per month. Under \(H_0\), \(\hat\lambda_0 = 78/22 \approx 3.545\).
- With \(\ell = \sum[x\log(\lambda t) - \lambda t]\), the \(\lambda t\) terms sum to 78 in both fits and cancel, leaving \(G = 2\sum x\log(x/(\hat\lambda_0 t))\).
- \(G = 2[30\log(30/35.45) + 48\log(48/42.55)] \approx 2[-5.01 + 5.79] \approx 1.56\).
- The null fixes one parameter, so compare with \(\chi^2_1\): the p-value is about 0.21.
Answer: \(-2\log\Lambda \approx 1.56\) with 1 degree of freedom, p about 0.21. The data are compatible with equal rates; the apparent difference of one accident per month could easily be chance.
Goodness of fit and contingency tables
For multinomial counts \(O_1, \ldots, O_k\) in \(k\) categories, a null hypothesis specifies category probabilities \(p_j(\theta)\), possibly depending on \(q\) estimated parameters. The likelihood ratio statistic is
and it is approximately \(\chi^2_{k-1-q}\). Karl Pearson's 1900 statistic \(X^2 = \sum(O_j - E_j)^2/E_j\) is a quadratic approximation to \(G^2\), obtained by expanding the logarithm, and the two usually agree closely. Fisher corrected Pearson's degrees of freedom in 1922 by showing that one degree is lost for each estimated parameter. A common rule of thumb asks for expected counts of at least 5 in most cells; otherwise exact methods or merged categories are safer.
For example, a plant cross predicted to give tall and short offspring in the ratio 3:1 produces 290 tall and 110 short plants out of 400. The expected counts are 300 and 100. Then \(X^2 = 100/300 + 100/100 = 1.33\) and \(G^2 = 2[290\log(290/300) + 110\log(110/100)] \approx 1.31\), each with 1 degree of freedom and a p-value of about 0.25. The data are consistent with the 3:1 ratio.
For an \(r \times c\) contingency table, independence of rows and columns gives expected counts \(E_{ij} = (\text{row total})(\text{column total})/n\), and \(G^2\) or \(X^2\) has \((r - 1)(c - 1)\) degrees of freedom: \(rc - 1\) free cell probabilities under the alternative minus \((r - 1) + (c - 1)\) under independence.
The score and Wald tests
Two asymptotically equivalent alternatives complete what is often called the trinity of likelihood tests. The Wald test, proposed by Abraham Wald in 1943, uses only the unrestricted MLE: \(W = (\hat\theta - \theta_0)^2/\mathrm{se}(\hat\theta)^2\). The score test, proposed by Rao in 1948 and known in econometrics as the Lagrange multiplier test, uses only the restricted fit: \(S = U(\theta_0)^2/(nI(\theta_0))\), which measures how steeply the log-likelihood is still rising at the null value. All three are approximately \(\chi^2_r\) under the null, and they agree in large samples.
In smaller samples they can differ noticeably. The Wald test is not invariant to reparameterization: testing \(\lambda = 1\) and testing \(\log\lambda = 0\) can give different answers. The score test is convenient when the restricted model is easy to fit and the full one is not, as when testing whether extra terms are needed in a regression. Pearson's \(X^2\) is in fact the score test for a multinomial, and the Wilson interval of lesson 8 inverts the score test for a proportion. The likelihood ratio test is invariant and usually the most reliable of the three, at the cost of fitting both models.
Likelihood ratio intervals
Inverting the likelihood ratio test gives a confidence set: all \(\theta_0\) for which \(2[\ell(\hat\theta) - \ell(\theta_0)] \le \chi^2_{1, \alpha}\). For 95% the cut-off is 3.84, so the interval consists of the parameter values whose log-likelihood is within 1.92 of the maximum. Unlike the Wald interval, this interval need not be symmetric, it respects the boundaries of the parameter space, and it is the same whatever parameterization is used.
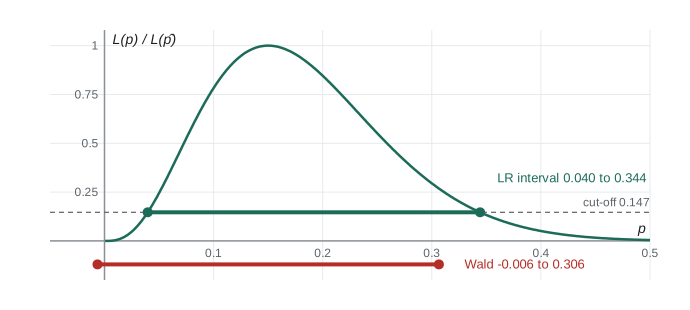
With 3 successes in 20 trials, the likelihood ratio interval runs from about 0.040 to 0.344, skewed to the right as the asymmetric log-likelihood suggests. The Wald interval, \(0.15 \pm 0.156\), runs from below zero to 0.306, an impossible lower end and an upper end that is too low.
Nuisance parameters and the profile likelihood
Most hypotheses concern one parameter while others, called nuisance parameters, must be estimated along the way. In the \(t\) test, \(\sigma\) is a nuisance parameter; in the accident comparison, the common rate is. The likelihood ratio handles them automatically, because both numerator and denominator maximize over every parameter not fixed by the hypothesis. Writing \(\theta = (\psi, \lambda)\) with \(\psi\) of interest, the profile log-likelihood \(\ell_p(\psi) = \max_\lambda \ell(\psi, \lambda)\) replaces each nuisance parameter by its best value for the given \(\psi\). Then \(-2\log\Lambda\) for \(H_0: \psi = \psi_0\) is just \(2[\ell_p(\hat\psi) - \ell_p(\psi_0)]\), and Wilks's theorem applies with as many degrees of freedom as \(\psi\) has components. A profile likelihood interval for \(\psi\) is found exactly as in the one-parameter case, by cutting the profile 1.92 units below its peak. This is how software computes intervals for a single regression coefficient or a gamma shape while accounting for the uncertainty in all the other parameters. When there are many nuisance parameters relative to the sample size, as in the Neyman–Scott problem of lesson 5, the profile likelihood can mislead, and adjusted or conditional likelihoods are needed.
When Wilks's theorem fails
The chi-square approximation needs the null value to lie in the interior of the parameter space. When it lies on the boundary, as in testing whether a variance component is zero or whether a mixture has a second component, the limit changes. For one parameter on the boundary, Steven Self and Kung-Yee Liang showed in 1987 that the limit is an equal mixture of a point mass at 0 and \(\chi^2_1\), so the correct p-value is half the naive one. Wilks's theorem also needs the null model to be nested within the alternative; comparing non-nested models, such as a gamma against a lognormal fit, calls for other tools such as Akaike's information criterion of 1973, \(\mathrm{AIC} = -2\ell(\hat\theta) + 2k\), which penalizes the number of parameters \(k\).
import math
from statistics import NormalDist

Z = NormalDist()
chi2_1_p = lambda g: 2 * (1 - Z.cdf(math.sqrt(g)))     # upper tail of chi-square(1)

# two Poisson rates
x, t = (30, 48), (10, 12)
l0 = sum(x) / sum(t)
G = 2 * sum(xi * math.log(xi / (l0 * ti)) for xi, ti in zip(x, t))
print(f"Poisson rates: pooled {l0:.3f}, G = {G:.3f}, p = {chi2_1_p(G):.3f}")

# goodness of fit to a 3:1 ratio
obs, exp = (290, 110), (300, 100)
X2 = sum((o - e) ** 2 / e for o, e in zip(obs, exp))
G2 = 2 * sum(o * math.log(o / e) for o, e in zip(obs, exp))
print(f"3:1 ratio: X^2 = {X2:.3f} (p {chi2_1_p(X2):.3f}), G^2 = {G2:.3f} (p {chi2_1_p(G2):.3f})")

# the trinity for a proportion: 3 successes in 20, test p = 0.4
k, n, p0 = 3, 20, 0.4
ph = k / n
ll = lambda p: k * math.log(p) + (n - k) * math.log(1 - p)
lrt = 2 * (ll(ph) - ll(p0))
wald = (ph - p0) ** 2 / (ph * (1 - ph) / n)
score = (ph - p0) ** 2 / (p0 * (1 - p0) / n)
print(f"test p = 0.4: LR {lrt:.2f}, Wald {wald:.2f}, score {score:.2f}")

# likelihood ratio interval versus Wald interval
grid = [i / 100000 for i in range(1, 100000)]
inside = [p for p in grid if 2 * (ll(ph) - ll(p)) <= 3.8415]
se = math.sqrt(ph * (1 - ph) / n)
print(f"LR interval {min(inside):.3f} to {max(inside):.3f}; "
f"Wald interval {ph - 1.96 * se:.3f} to {ph + 1.96 * se:.3f}")Poisson rates: pooled 3.545, G = 1.557, p = 0.212 3:1 ratio: X^2 = 1.333 (p 0.248), G^2 = 1.305 (p 0.253) test p = 0.4: LR 5.96, Wald 9.80, score 5.21 LR interval 0.040 to 0.344; Wald interval -0.006 to 0.306
For the test of \(p = 0.4\) with 3 successes in 20, the three statistics differ markedly even though they are asymptotically equivalent. The Wald statistic uses the small estimated variance at \(\hat p = 0.15\) and is the largest; the score statistic uses the variance at \(p = 0.4\) and is the smallest; the likelihood ratio lies between them. All three reject at the 5% level here, but with smaller effects they can disagree, and the likelihood ratio is usually the safest choice.
Common mistakes
MistakeCounting degrees of freedom as the number of parameters in the full model.
InsteadUse the difference in the number of free parameters between the two models.
MistakeUsing Wilks’s theorem when the null value is on the boundary.
InsteadThe limit is a mixture; for one parameter, halve the naive \(\chi^2_1\) p-value.
MistakeComparing non-nested models with a likelihood ratio test.
InsteadWilks’s theorem requires nesting; use AIC or other criteria.
MistakeApplying \(X^2\) with very small expected counts.
InsteadMerge categories or use an exact test when many expected counts are below 5.
MistakeForgetting to subtract a degree of freedom for each estimated parameter in goodness of fit.
InsteadUse \(k - 1 - q\) degrees of freedom, as Fisher showed.
Summary and key terms
- The generalized likelihood ratio \(\Lambda = L(\hat\theta_0)/L(\hat\theta)\) compares the best fits under the null and overall.
- Wilks: \(-2\log\Lambda \to \chi^2_r\), with \(r\) the difference in the number of free parameters.
- The two-sided \(t\) test is a likelihood ratio test.
- \(G^2\) and Pearson’s \(X^2\) test goodness of fit and independence with \(k - 1 - q\) or \((r - 1)(c - 1)\) degrees of freedom.
- Wald, score and likelihood ratio tests are asymptotically equivalent but can differ in small samples.
- Likelihood ratio intervals contain the values within 1.92 log-likelihood units of the maximum.
- generalized likelihood ratio
- The ratio of maximized likelihoods under the null and under the full model.
- Wilks’s theorem
- The asymptotic \(\chi^2\) distribution of \(-2\log\Lambda\) under the null.
- deviance
- Twice the difference in maximized log-likelihoods between two models.
- Wald test
- A test based on the distance of the unrestricted MLE from the null value in standard error units.
- score test
- A test based on the slope of the log-likelihood at the null value.
- nested models
- Models in which one is a special case of the other.
- AIC
- Akaike’s criterion \(-2\ell(\hat\theta) + 2k\) for comparing models.
Practice problems
Work each problem on paper first, then reveal the answer to check.
A 4 by 3 contingency table is tested for independence. How many degrees of freedom does \(G^2\) have?
Show answer
\((4 - 1)(3 - 1) = 6\).
For an exponential sample, derive \(-2\log\Lambda\) for \(H_0: \lambda = \lambda_0\).
Show answer
\(2[n\log(\hat\lambda/\lambda_0) - (\hat\lambda - \lambda_0)\sum x_i]\) with \(\hat\lambda = 1/\bar x\), which simplifies to \(2n[\lambda_0\bar x - 1 - \log(\lambda_0\bar x)]\).
A die is rolled 120 times with counts 25, 17, 15, 23, 24, 16. Compute Pearson’s \(X^2\) for fairness.
Show answer
Expected 20 each: \(X^2 = (25 + 9 + 25 + 9 + 16 + 16)/20 = 5.0\) with 5 degrees of freedom, p about 0.42; no evidence against fairness.
Why is the Wald test not invariant to reparameterization?
Show answer
Its standard error depends on the scale; the normal approximation is better on some scales than others.
A log-likelihood is maximized at \(\hat\theta = 2.4\) with value \(-51.3\). Is \(\theta = 3\), where \(\ell = -54.1\), inside the 95% LR interval?
Show answer
\(2(54.1 - 51.3) = 5.6 > 3.84\), so no.
Testing whether a variance component is zero gives \(-2\log\Lambda = 3.0\). What p-value should be reported?
Show answer
The naive \(\chi^2_1\) p-value is 0.083; the boundary correction halves it to about 0.042.
Lesson quiz · 5 questions
Score 60% or more to complete this lesson.
Create a free account to save your progress, take quizzes and earn a certificate.