
MSAZ-121 · Lesson 9 of 12 · 18 min
Batch and streaming data
▶ Video coming soon A video version of this lesson is on the way.
On October 31, 2026, a freezer at the Brandon store failed overnight. By the time staff opened the store at seven, the temperature inside had risen for hours, and the store threw away 3,800 dollars of frozen food. The freezer already had a temperature sensor, and the readings were already being collected. They were simply collected into a file that was uploaded once a night and loaded into a report the next morning. The data that could have saved the food existed; it just arrived too late to matter.
Grace Oduya brought the story to the data clinic on November 10, and Nikolai used it to introduce the difference that the next two lessons are about: batch processing versus streaming processing.
Batch processing
In batch processing, data is collected over a period and processed together as a bounded set: last night's sales, this month's invoices, the past hour's log files. Batch jobs run on a schedule or when a set of data is complete. They can process very large volumes efficiently, because the whole set is available at once, and they can run complex calculations and joins that need all the data. The cost is latency: results are only as fresh as the last run, which may be hours old.
Most of what Keiko does is, and should remain, batch. The nightly sales report summarizes a complete day; it would gain nothing from being recalculated every second, and it is cheaper and simpler to run once. The medallion pipelines from lesson 7 are batch pipelines.
Streaming processing
In streaming processing, data is processed continuously, record by record or in small groups, as it arrives. The data is unbounded: a stream of events from tills, sensors, apps or websites that never ends. Streaming systems process each event within seconds or less of its creation, so results are always current. They are used when the value of data falls quickly with time: fraud detection, equipment monitoring, live dashboards, stock alerts, and personalization while a customer is still on the website.
| Batch | Streaming | |
|---|---|---|
| Data scope | A bounded set: all data for a period | Unbounded: each event or a short recent window |
| Data size | Large volumes processed together | Individual events or micro-batches |
| Latency | Minutes to hours or more | Seconds or less |
| Analysis | Complex, across all the data | Simple, often aggregates over time windows |
| Examples | Nightly sales report, monthly payroll | Freezer alerts, fraud checks, live store traffic |
Many organizations combine the two. Events are processed as a stream for immediate action and also written to a lake or warehouse, where batch jobs analyze the full history. A freezer reading might trigger an alert within a minute and also be stored for a monthly report on which freezers need maintenance.
Events, producers and consumers
Streaming systems use some new vocabulary. An event is a record that something happened, usually small, with a timestamp and a few values: freezer 3 at the Brandon store read minus 17 degrees Celsius at 02:14:30. A producer sends events, such as a sensor gateway, a till or an app. A message broker or event ingestion service receives events from many producers, keeps them in order and durable, and lets several consumers read them independently. In Azure, Azure Event Hubs is the main high-volume event ingestion service, and Azure IoT Hub adds device management for connected devices. In Fabric, Eventstream collects and routes events, as lesson 10 explains.
Streams raise a timing question that batch data does not. Each event has an event time, when it happened, and an arrival time, when the system received it. They differ when networks are slow or devices go offline and send a burst later. Good streaming designs aggregate by event time and allow a short grace period for late events.
Windows: aggregating a stream
An unbounded stream has no end, so you cannot ask for its total. Instead, streaming queries aggregate over windows of time. A tumbling window divides time into fixed, non-overlapping intervals, such as every five minutes; each event belongs to exactly one window. A hopping window has a fixed length but starts at regular intervals that can be shorter than its length, so windows overlap, such as a ten-minute average calculated every five minutes. A sliding window produces a result whenever an event enters or leaves a window of fixed length. A session window groups events that arrive close together and closes after a gap with no events, which suits activity such as a customer's visit to the website.
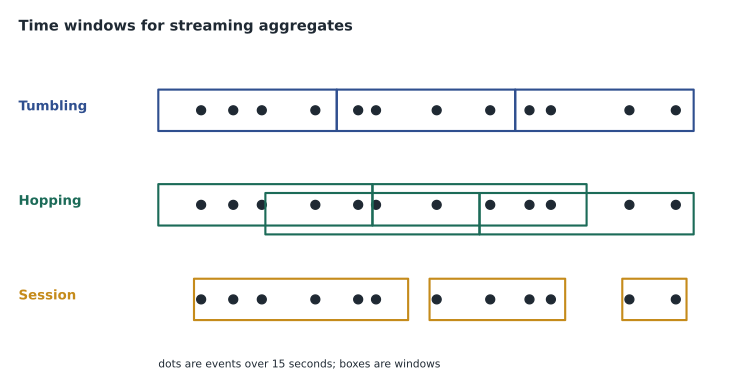
For the freezer pilot, Nikolai proposed a tumbling window of one minute: compute each freezer's average temperature every minute, and raise an alert if the average is above minus 12 degrees for five consecutive windows. Using an average over a minute avoids false alarms when a door is opened briefly, and requiring five windows avoids alarms during a short defrost cycle.
# Simulating one-minute tumbling windows over freezer readings (degrees Celsius)
readings = [  # (seconds since 02:00, temperature)
    (5, -18.2), (35, -18.0), (65, -17.9), (95, -16.5), (125, -14.0), (155, -13.1),
    (185, -12.4), (215, -11.8), (245, -11.0), (275, -10.6), (305, -9.9), (335, -9.5),
    (365, -9.0), (395, -8.4), (425, -8.1), (455, -7.6), (485, -7.2), (515, -6.9),
]
windows = {}
for t, temp in readings:
    windows.setdefault(t // 60, []).append(temp)
warm_run = 0
for w in sorted(windows):
    avg = sum(windows[w]) / len(windows[w])
    warm_run = warm_run + 1 if avg > -12 else 0
    flag = "ALERT" if warm_run >= 5 else ""
print(f"02:{w:02d} avg {avg:6.1f} warm minutes in a row: {warm_run} {flag}")02:00 avg -18.1 warm minutes in a row: 0 02:01 avg -17.2 warm minutes in a row: 0 02:02 avg -13.6 warm minutes in a row: 0 02:03 avg -12.1 warm minutes in a row: 0 02:04 avg -10.8 warm minutes in a row: 1 02:05 avg -9.7 warm minutes in a row: 2 02:06 avg -8.7 warm minutes in a row: 3 02:07 avg -7.8 warm minutes in a row: 4 02:08 avg -7.1 warm minutes in a row: 5 ALERT
What this code does
Groups freezer temperature readings into one-minute tumbling windows, which are fixed non-overlapping blocks, and averages each window. It counts how many minutes in a row the average has been warmer than the safe limit. This is how a stream processing job turns raw sensor readings into a signal worth alerting on.
In the simulation the freezer warms steadily. The first window above minus 12 is minute 4, and the alert condition is met at minute 8, a few minutes after the readings began to climb instead of five hours later when the store opened.
Stream processing services
Several Microsoft services process streams, and lesson 10 compares them. Azure Stream Analytics runs SQL-like queries over streams from Event Hubs or IoT Hub and writes results to databases, storage, Power BI or Fabric. Real-Time Intelligence in Microsoft Fabric captures streams with Eventstream, stores them in an Eventhouse for fast queries with KQL, and acts on them with Activator. Apache Spark Structured Streaming processes streams in notebooks in Fabric or Azure Databricks, which suits teams that already write Spark. Azure Data Explorer is a stand-alone service for fast analysis of large volumes of log and telemetry data, using the same KQL engine as an Eventhouse.
SELECT
    FreezerId,
    System.Timestamp() AS WindowEnd,
    AVG(Temperature) AS AvgTemp
FROM FreezerReadings TIMESTAMP BY EventTime
GROUP BY FreezerId, TumblingWindow(minute, 1)
Choosing batch or streaming
Nikolai's rule of thumb was to ask what happens if the answer arrives an hour late. If nothing changes, batch is cheaper and simpler. If money, safety or a customer's experience is lost, consider streaming. Streaming costs more to run and to design well, because services are always on and every component must cope with late, duplicated or out-of-order events. For Harrow & Finch, the freezers, the live store traffic counter on Grace's tablet and website stock levels during sales events were streaming candidates; the sales report, supplier analysis and monthly loyalty summaries stayed batch.
Delivery guarantees
Streams raise another question that batch rarely does: if a message is lost or sent twice, what happens? Streaming systems describe their behaviour with delivery guarantees. At most once means an event is delivered once or not at all, so events can be lost. At least once means every event is delivered, but some may be delivered more than once after a failure. Exactly once means each event affects the result once, which is the hardest to achieve and usually depends on how both the processing engine and the destination handle retries. Most event ingestion services, including Event Hubs, provide at-least-once delivery, so consumers should be built to tolerate duplicates.
For the freezer readings, duplicates are harmless: a reading counted twice barely changes a one-minute average. For till events feeding a live sales total, duplicates would inflate the figure, so each event would carry a unique sale id and the consumer would ignore ids it had already seen. Nikolai's rule was simple: assume every message might arrive twice, late or out of order, and design so that the answer is still right.
The lambda and kappa ideas
Two architecture patterns describe how organizations combine batch and streaming, and they appear in study material. The lambda architecture runs two paths side by side: a speed layer that processes the stream for fast, approximate results, and a batch layer that periodically reprocesses all the data for complete, accurate results, with a serving layer that combines them. It is reliable but means maintaining two sets of logic. The kappa architecture uses a single streaming path for everything, replaying the stored stream when results must be recomputed. Modern platforms, such as Fabric and Databricks with Delta tables, blur the line, because the same table can be written by a stream and read by batch queries.
The Finch Data Hub would use the simple version of this idea. Freezer readings would flow through the stream for alerts and also land in the lakehouse, where the monthly maintenance report would read them in batch. There would be one copy of each reading and two ways to use it.
Streams in everyday retail
Once Keiko started looking, she found streaming opportunities everywhere in the business. Online stock levels during a holiday sale, so the website stops selling items that have just sold out. Queue length at the tills, estimated from door counts and transaction rates, so managers can open another till before lines form. Card payment patterns, so unusual activity is flagged while the customer is still at the counter. Delivery van locations, so customers get accurate arrival times. Each needs data within seconds or minutes; none needs a complex calculation. That combination, simple logic and short deadlines, is the signature of a streaming workload.
Testing a streaming design
Streaming logic is harder to test than batch logic, because the data never stops and timing matters. Nikolai planned three tests before the freezer pilot went live. First, replay a day of recorded readings, including the October 31 failure, through the pipeline and check that the alert fires at the right minute. Second, inject late, duplicated and out-of-order readings and check that the averages and alerts are still correct. Third, cut off the gateway for fifteen minutes and check that the missing-data alert fires and that readings sent after reconnection are handled properly. Only after all three passed would the duty managers receive real alerts.
Keiko asked why the team could not simply wait for the next real failure. Nikolai pointed out that a real failure costs thousands of dollars of stock, and that a test with recorded data costs nothing but an afternoon.
Worked problem
Batch or streaming?
Classify each need: (a) a weekly report of sales by department; (b) a text message to the store manager within two minutes if a freezer warms; (c) a dashboard of the number of shoppers currently in each store; (d) a year-end analysis of which promotions increased basket size.
Show solution
- Weekly and year-end analyses use complete, bounded sets and tolerate delay: batch.
- The freezer alert and live shopper counts lose their value within minutes: streaming.
Answer: Batch: (a) and (d). Streaming: (b) and (c).
Common mistakes
MistakeMaking every report real time because it sounds better.
InsteadUse streaming only when delay causes real loss; batch is cheaper and simpler.
MistakeAsking for a total of an unbounded stream.
InsteadAggregate streams over time windows.
MistakeGrouping events by arrival time when devices can send late.
InsteadGroup by event time and allow a grace period for late events.
MistakeConfusing hopping and tumbling windows.
InsteadTumbling windows never overlap; hopping windows can.
Summary and key terms
- Batch processing handles bounded sets of data together on a schedule, efficiently and with complex analysis, at the cost of latency.
- Streaming processing handles unbounded events continuously within seconds, usually with simple aggregates over time windows.
- Producers send events to ingestion services such as Azure Event Hubs, IoT Hub or Fabric Eventstream, and consumers process them.
- Tumbling, hopping, sliding and session windows group events by time.
- Services that process streams include Azure Stream Analytics, Fabric Real-Time Intelligence, Spark Structured Streaming and Azure Data Explorer.
- Batch processing
- Processing a bounded set of collected data together.
- Streaming processing
- Processing unbounded data continuously as each event arrives.
- Event
- A small record that something happened, with a timestamp.
- Latency
- The delay between something happening and the result being available.
- Tumbling window
- Fixed, non-overlapping time intervals.
- Hopping window
- Fixed-length windows that start at intervals and can overlap.
- Event time
- When an event happened, as opposed to when it arrived.
Practice problems
Work each problem on paper first, then reveal the answer to check.
Which processing type suits a nightly sales summary?
Show answer
Batch.
Which window type never overlaps?
Show answer
Tumbling.
Name an Azure service that ingests high volumes of events.
Show answer
Azure Event Hubs, or IoT Hub for devices.
Lesson quiz · 5 questions
Score 60% or more to complete this lesson.
Create a free account to save your progress, take quizzes and earn a certificate.