
MSAZ-121 · Lesson 7 of 12 · 19 min
Data ingestion and pipelines
▶ Video coming soon A video version of this lesson is on the way.
Designing the Finch Data Hub on a whiteboard was the easy part. Getting data into it, every night, reliably, from nine different sources, was where Keiko's old report had always struggled. Her existing process was a chain of SQL Server Agent jobs and a scheduled Excel macro. When a job failed at three in the morning, nobody knew until a store manager phoned at eight to ask why the report was blank. Nikolai's fifth clinic was about ingestion and pipelines: how data moves into an analytical store, how it is transformed, and how the whole process is scheduled, monitored and repaired.
What ingestion involves
Data ingestion is the process of capturing data from source systems and bringing it into a data store for processing. The DP-900 outline asks you to describe considerations for ingestion and processing, and Nikolai grouped them into five questions. Where is the data, and how do we connect to it: a database, an application's API, files on a server, a cloud service? How much is there, and how fast does it grow? How often must it arrive: once a night, every hour, or continuously? Does it need to be transformed before it is useful, and where should that happen? And what happens when something fails?
Answers vary by source. StockLine is a SQL Server database reached over the VPN, with about 600,000 new sale lines a day, needed every morning. Supplier price lists arrive as spreadsheets by email and should be loaded within a day. Clickstream logs land as JSON files in a storage account every hour. Freezer sensors send readings every ten seconds, which is a streaming problem for lessons 9 and 10.
ETL and ELT
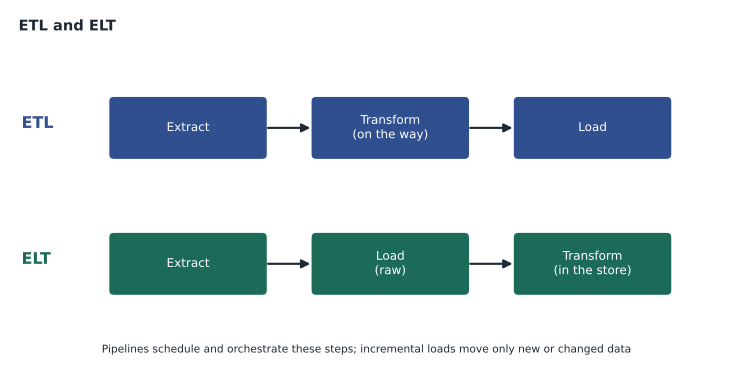
There are two classic patterns for moving and transforming data. In extract, transform, load (ETL), data is extracted from the source, transformed in a separate processing engine, and then loaded into the target already cleaned and shaped. ETL suits targets that expect clean, structured data, such as a traditional warehouse, and situations where sensitive fields must be removed before data ever reaches the target.
In extract, load, transform (ELT), data is extracted and loaded into the target store first, usually in raw form, and then transformed there using the store's own processing power. ELT suits modern lakes and lakehouses, which can hold raw data cheaply and process it at scale, and it keeps a raw copy that can be reprocessed when rules change. The medallion architecture from lesson 6 is an ELT pattern: raw data lands in bronze and is transformed into silver and gold inside the lakehouse.
Pipelines and orchestration
A pipeline is a logical grouping of activities that together perform a task, such as copying data, running a transformation, or sending a notification. Pipelines orchestrate work: they run activities in order, run independent ones in parallel, pass values between them, branch on conditions and retry when something fails. A pipeline is started by a trigger, such as a schedule (every night at 1 a.m.), an event (a file arriving in a storage account) or a manual run.
In Microsoft's platform, pipelines are provided by Azure Data Factory, a stand-alone Azure service, and by Data Factory in Microsoft Fabric, which offers pipelines and Dataflow Gen2 inside a Fabric workspace. Azure Synapse Analytics includes the same pipeline engine for customers who use it. A pipeline connects to sources and destinations through connectors, and reaches systems in private networks or on premises through a gateway or integration runtime installed close to them, which is how a pipeline would reach StockLine in the head office server room.
| Pipeline element | What it is | Finch Data Hub example |
|---|---|---|
| Activity | One step: copy, transform, run a notebook, send a message | Copy last night's sale lines from StockLine |
| Pipeline | Activities grouped and ordered into a workflow | Nightly sales load: copy, then build silver, then build gold |
| Trigger | What starts a pipeline: schedule, event or manual | Every night at 1:30 a.m., store time |
| Connector | A built-in way to read from or write to a system | SQL Server, Blob storage, SharePoint, a REST API |
| Gateway or runtime | Software that lets the cloud reach private or on-premises sources | Installed on a server at head office |
| Monitoring | Run history, durations, errors and alerts | Email the data team if the 1:30 run fails |
Transforming data
Transformations turn raw data into useful data. Common ones are cleaning (fixing data types, trimming spaces, handling missing values), standardizing (one code for each store, one spelling of each product category), deduplicating, joining sources on common keys, aggregating to daily or weekly totals, and reshaping into a star schema. Each tool offers several ways to express them. Dataflow Gen2 uses Power Query, a visual, low-code tool familiar from Excel and Power BI. Notebooks run code in Apache Spark, using Python, Scala, SQL or R, for large or complex work. SQL scripts and stored procedures transform data inside a warehouse.
Keiko already knew Power Query from Excel, which gave her a head start: Dataflow Gen2 would let her rebuild much of her spreadsheet logic in a form that runs on a schedule in Fabric. Nikolai planned to write the heavy silver-layer joins in a Spark notebook.
# A small transformation: clean, standardize and aggregate sale lines
raw = [
    {"store": " Brandon", "sku": "7731", "qty": "2", "price": "59.99"},
    {"store": "BRANDON", "sku": "1180", "qty": "1", "price": "7.99"},
    {"store": "Store 12", "sku": "7731", "qty": "", "price": "59.99"},     # missing quantity
    {"store": "store 12", "sku": "7731", "qty": "3", "price": "59.99"},
]
clean = []
for r in raw:
    if not r["qty"]:
        continue                                  # reject incomplete rows (log them in practice)
    clean.append((r["store"].strip().title(), r["sku"], int(r["qty"]) * float(r["price"])))
totals = {}
for store, sku, amount in clean:
    totals[store] = round(totals.get(store, 0) + amount, 2)
print(totals){'Brandon': 127.97, 'Store 12': 179.97}What this code does
Cleans raw sale lines by trimming and standardising store names and rejecting a row with a missing quantity. It turns each remaining line's text quantity and price into numbers, multiplies them, and totals the amounts per store. These are the typical transformation steps in a data pipeline before the data is loaded for reporting.
Full and incremental loads
A full load copies all of a source's data every time. It is simple and suits small tables, such as the list of stores. An incremental load copies only data that is new or changed since the last run, which is essential for large tables such as sale lines. Incremental loads need a reliable way to find changes: a watermark column such as a last-modified timestamp or an increasing id, change data capture in the source database, or mirroring, which keeps a continuous copy.
The nightly sales load would be incremental: each run would record the highest sale id it copied and start from there next time. Nikolai warned Keiko about one trap: if a till uploads late, its sales may have ids lower than the watermark. The pipeline would therefore copy everything modified in the last two days and remove duplicates in silver, a common safety margin.
# Incremental load with a watermark and a safety overlap (illustrative)
source = [(1001, "2026-11-08"), (1002, "2026-11-08"), (1003, "2026-11-09"), (1004, "2026-11-09"), (998, "2026-11-09")]
already_loaded = {1001, 1002}         # ids loaded by last night's run
watermark = 1002
new_by_id = [r for r in source if r[0] > watermark]
print("Watermark only:", new_by_id)   # misses id 998, a late till upload
overlap = [r for r in source if r[1] >= "2026-11-08" and r[0] not in already_loaded]
print("Two-day overlap, deduplicated:", sorted(overlap))Watermark only: [(1003, '2026-11-09'), (1004, '2026-11-09')] Two-day overlap, deduplicated: [(998, '2026-11-09'), (1003, '2026-11-09'), (1004, '2026-11-09')]
What this code does
Compares two ways of finding new rows for a nightly incremental load. Using only the highest ID already loaded (the watermark) misses a late upload that has a lower ID. Reloading a two-day overlap and skipping IDs already loaded catches it without duplicating anything.
Reliability and monitoring
Pipelines fail: a source is offline, a file arrives late, a column changes type. Good pipelines are designed for this. They retry transient errors automatically. They are idempotent, meaning that running them twice produces the same result as running them once, so a failed run can simply be repeated. They validate data, for example by checking that the number of rows is within the usual range, and stop or alert when it is not. And they are monitored: every run is logged with its duration and outcome, and failures send alerts to people who can act. Keiko's 8 a.m. phone calls would become a 1:45 a.m. alert to the on-call data engineer.
az datafactory pipeline create-run \
  --resource-group rg-data-prod-cc \
  --factory-name adf-hf-prod-cc \
  --name pl-nightly-sales
Dataflow Gen2 and Power Query
For transformations that analysts own, Fabric offers Dataflow Gen2, built on Power Query. A dataflow connects to sources, applies a recorded sequence of steps, such as removing columns, splitting text, changing types, merging queries and grouping rows, and writes the result to a destination such as a lakehouse or warehouse table. Each step appears in a list and can be edited or removed, and Power Query records the steps in a language called M, which is visible but rarely needs to be written by hand. Dataflows can be run on their own schedule or as an activity inside a pipeline.
Keiko rebuilt her supplier price list cleanup as a dataflow during the clinic. Her Excel macro had trimmed spaces, converted text prices to numbers, mapped supplier names to codes and removed discontinued items. In Power Query, each of those became a visible step, and the dataflow would run every morning without anyone opening Excel. It was her first piece of the Finch Data Hub, and it took less than an hour.
Notebooks and Spark for heavy work
When data is large or logic is complex, engineers use notebooks that run on Apache Spark, a distributed processing engine that splits work across many machines. Spark reads Delta tables and files into DataFrames, which are like tables in memory, applies transformations written in Python, SQL, Scala or R, and writes the results back to Delta tables. Spark can join hundreds of millions of rows in minutes because each machine processes part of the data at the same time, the same massively parallel idea warehouses use.
sales = spark.read.table("bronze_sales_lines")
stores = spark.read.table("silver_dim_store")
clean = (sales
    .dropDuplicates(["SaleId", "LineNo"])
    .filter("Quantity > 0")
    .join(stores, "StoreCode"))
clean.write.mode("overwrite").saveAsTable("silver_sales_lines")
Building the nightly pipeline
By the end of the clinic, Nikolai had sketched the nightly sales pipeline step by step. At 1:30 a.m. store time, a schedule trigger starts it. A copy activity reads sale lines changed in the last two days from StockLine through the on-premises gateway and appends them to a bronze table. A notebook activity removes duplicates and builds silver sales lines. A second notebook rebuilds the gold fact table for the affected days. A validation step compares the day's row count and sales total with StockLine's own totals and stops the pipeline if they differ by more than a small tolerance. Finally, a notification activity posts a success or failure message to the data team's Teams channel. If any step fails, the pipeline retries it twice before alerting.
Keiko asked how long it would take. Nikolai estimated twenty minutes, which meant the gold tables would be ready by about 2 a.m., five hours before the first stores opened. The old process had finished at about 6:30, on a good night.
Worked problem
Designing a load
The supplier price list table has about 40,000 rows and changes a few hundred times a week. The sale lines table grows by 600,000 rows a day. Which load type suits each, and why?
Show solution
- 40,000 rows is small; copying them all each night is cheap and avoids tracking changes, so a full load is reasonable.
- Sale lines grow quickly and copying years of history each night would waste time and money, so an incremental load with a watermark and overlap is needed.
Answer: Full load for the price list; incremental load for sale lines.
Common mistakes
MistakeLoading only rows with ids above the watermark and assuming nothing is missed.
InsteadAllow an overlap window and remove duplicates, or use change data capture.
MistakeTransforming raw data in place.
InsteadKeep the raw copy and write transformed data to a new layer.
MistakeDiscovering pipeline failures from users' complaints.
InsteadMonitor runs and send alerts on failure or unusual row counts.
MistakeThinking ETL and ELT differ only in spelling.
InsteadETL transforms before loading; ELT loads raw data and transforms it inside the store.
Summary and key terms
- Ingestion captures data from sources and brings it into an analytical store; key considerations are connectivity, volume, frequency, transformation and failure handling.
- ETL transforms data before loading it, while ELT loads raw data and transforms it inside the store, as in the medallion architecture.
- Pipelines group activities, run on triggers, use connectors and gateways, and are monitored; Azure Data Factory and Data Factory in Microsoft Fabric provide them.
- Transformations clean, standardize, join and reshape data with Power Query, Spark notebooks or SQL.
- Incremental loads use watermarks, change data capture or mirroring; reliable pipelines retry, validate, are idempotent and alert on failure.
- Ingestion
- Capturing data from sources and bringing it into a data store.
- ETL
- Extract, transform, load: transform data before loading it into the target.
- ELT
- Extract, load, transform: load raw data and transform it inside the target.
- Pipeline
- An orchestrated group of activities that move and transform data.
- Trigger
- A schedule, event or manual action that starts a pipeline.
- Incremental load
- Copying only data that is new or changed since the last run.
- Watermark
- A stored value, such as the last id or timestamp loaded, used to find new data.
Practice problems
Work each problem on paper first, then reveal the answer to check.
Which pattern loads raw data first and transforms it in the store?
Show answer
ELT.
What starts a pipeline at 1:30 every night?
Show answer
A schedule trigger.
Name two ways to find changed rows for an incremental load.
Show answer
A watermark column, change data capture or mirroring.
Lesson quiz · 5 questions
Score 60% or more to complete this lesson.
Create a free account to save your progress, take quizzes and earn a certificate.