
MSAZ-121 · Lesson 11 of 12 · 18 min
Power BI: reports, dashboards and data models
▶ Video coming soon A video version of this lesson is on the way.
Every pipeline, lakehouse and stream in this course exists so that someone can see something and act on it. At Harrow & Finch, that someone is usually a store manager with ten minutes before opening, a buyer comparing suppliers, or Dana Whitcombe preparing the board pack. Keiko's spreadsheets had served them for seven years. In the Finch Data Hub pilot, they would be replaced by Microsoft Power BI, and Keiko would build the replacement. At the clinic, Nikolai handed over to Keiko herself, who had used Power BI Desktop for two years for side projects, and asked her to explain it to him the way the DP-900 exam would.
What Power BI is
Power BI is Microsoft's business intelligence platform: a set of tools and services for connecting to data, modelling it, visualizing it and sharing the results. It is also one of the workloads in Microsoft Fabric, so Power BI items live in the same workspaces as lakehouses and pipelines. The DP-900 outline asks you to identify Power BI's capabilities, describe features of its data models and choose appropriate visualizations; this lesson covers the first two, and lesson 12 covers the third.
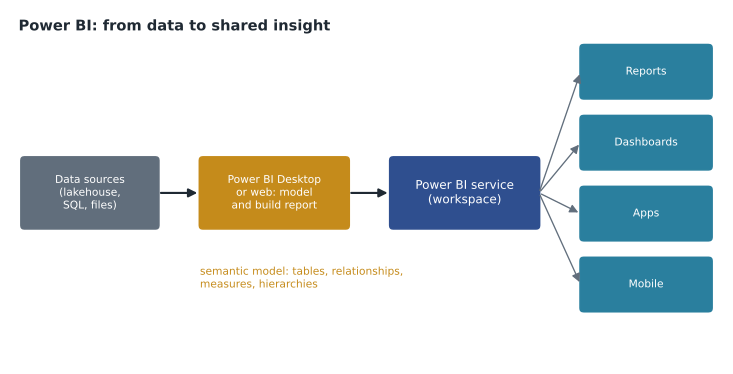
The parts of Power BI
Power BI Desktop is a free Windows application for building reports. Analysts connect to data sources, shape the data with Power Query, build the semantic model, and design report pages. Many of the same tasks can now be done in a web browser in the Power BI service. The Power BI service is the cloud service, at app.powerbi.com and inside Fabric, where reports are published to workspaces, refreshed on a schedule, shared with colleagues, organized into apps and secured. Power BI Mobile apps show reports and dashboards on phones and tablets, with layouts designed for small screens. Power BI Report Server is an on-premises option for organizations that cannot use the cloud service. Power BI also embeds in other places: Microsoft Teams, SharePoint, PowerPoint and custom applications.
| Part | Used for | Typical user |
|---|---|---|
| Power BI Desktop | Connecting, shaping, modelling and designing reports | Report authors such as Keiko |
| Power BI service | Publishing, refreshing, sharing, securing, building dashboards and apps | Authors and report readers |
| Power BI Mobile | Viewing reports and dashboards on phones and tablets | Store managers, executives |
| Power BI Report Server | Hosting reports on premises | Organizations that need on-premises hosting |
Reports and dashboards
Two Power BI terms are easily confused and often tested. A report is a multi-page, interactive view of one semantic model. Each page holds visuals, such as charts, tables, maps and cards, that respond to each other: clicking a store in one chart filters the others. Readers can use slicers to filter, drill down from year to month to day, and see tooltips with detail. Reports are built in Desktop or the web.
A dashboard is a single page, called a canvas, of tiles pinned from one or more reports, built only in the Power BI service. Dashboards give a one-screen summary: Dana's dashboard has tiles for total sales this week, margin by department, loyalty sign-ups and online orders, each pinned from a different report. Selecting a tile opens the report it came from. Dashboards can show tiles from several semantic models, support data alerts on number tiles, and suit executives who want to see the state of the business at a glance.
| Report | Dashboard | |
|---|---|---|
| Pages | One or many | One |
| Data | One semantic model | Tiles from one or many reports and models |
| Built in | Power BI Desktop or the service | The Power BI service only |
| Interaction | Filtering, slicers, drill down, cross-highlighting | Select a tile to open its report |
| Purpose | Explore and analyze | Monitor key figures at a glance |
An app bundles reports and dashboards from a workspace into a package that a group of readers can install, with its own navigation. Keiko planned a Store Performance app for the 23 store managers, so they would see one tidy set of reports rather than a workspace full of drafts.
The semantic model
Behind every report is a semantic model, formerly called a dataset. It holds the tables of data, the relationships between them, calculated measures, hierarchies and formatting, and it defines the business meaning of the data so that every report built on it uses the same definitions. A well-designed model is the difference between reports that agree with each other and reports that each tell a different story.
Most Power BI models follow the star schema from lesson 5: a fact table of sales lines in the middle and dimension tables for date, store, product and customer around it. This shape is efficient for the Power BI engine and easy for report authors to understand. Keiko's model for the pilot would read the gold layer of the Finch Data Hub, which was already a star schema.
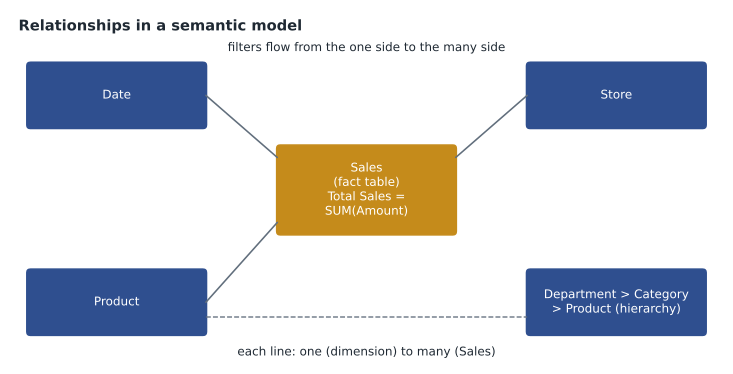
Relationships, measures and hierarchies
A relationship links a column in one table to a column in another, such as StoreKey in the Store table to StoreKey in the Sales table. Each has a cardinality: one-to-many is the normal case, where each store appears once in the Store table and many times in Sales; one-to-one and many-to-many exist but need care. Each relationship also has a cross-filter direction: by default, filters flow from the one side to the many side, so selecting a store filters its sales. Relationships are what let a slicer on one table filter visuals built on another.
A measure is a calculation evaluated when a visual asks for it, written in Data Analysis Expressions (DAX), a formula language that will look familiar to Excel users. Total Sales = SUM(Sales[Amount]) is a measure; it returns the total for whatever store, product and date are filtered at the moment, so the same measure gives a company total in a card and a per-store figure in a table. Measures are preferred over calculated columns, which are computed once per row when data is refreshed and stored in the model, for most aggregations. A hierarchy arranges related columns in levels, such as Year, Quarter, Month and Day, or Department, Category and Product, so that readers can drill down through them.
Total Sales = SUM ( Sales[Amount] )
Total Units = SUM ( Sales[Quantity] )
Average Basket = DIVIDE ( [Total Sales], DISTINCTCOUNT ( Sales[TransactionId] ) )
Sales Last Year = CALCULATE ( [Total Sales], SAMEPERIODLASTYEAR ( 'Date'[Date] ) )# What a measure does: the same formula evaluated under different filters
sales = [("Brandon", "Outdoor", 239.96), ("Brandon", "Paint", 79.90),
("Store 12", "Outdoor", 244.93), ("Brandon", "Outdoor", 24.99)]
def total_sales(store=None, dept=None):
return round(sum(a for s, d, a in sales if (store is None or s == store) and (dept is None or d == dept)), 2)
print("Card, no filter:", total_sales())
print("Row for Brandon:", total_sales(store="Brandon"))
print("Cell for Brandon, Outdoor:", total_sales("Brandon", "Outdoor"))Card, no filter: 589.78 Row for Brandon: 344.85 Cell for Brandon, Outdoor: 264.95
What this code does
Shows what a report measure does by evaluating the same total-sales formula with different filters: no filter for a summary card, one store for a table row, and one store and department for a single cell. The same measure gives different answers depending on its filter context. This is the core idea behind measures in Power BI.
Storage modes and refresh
A semantic model gets data in one of several storage modes. Import copies data into the model's compressed in-memory store, giving the fastest queries; the copy is refreshed on a schedule. DirectQuery leaves data in the source and sends queries to it each time a visual needs data, so results are current but depend on the source's speed. Direct Lake, available with Fabric, reads Delta tables in OneLake directly into memory when needed, combining import-like speed with data that is as fresh as the lakehouse. Keiko's pilot model would use Direct Lake on the gold tables, so a nightly pipeline run would update reports without a separate refresh.
Sharing and security
Power BI uses Microsoft Entra identities. Workspace roles, Admin, Member, Contributor and Viewer, control who can edit and who can only read. Row-level security restricts which rows a reader sees: each store manager would see only their own store, while regional managers see their region, all from one model. Sensitivity labels from Microsoft Purview mark reports that contain confidential data, such as margins, and those labels travel with the data when it is exported. Copilot in Power BI can suggest report pages, summarize visuals and answer questions in natural language for users with the right licences and capacity.
Getting data with Power Query
Before a model can be built, data must be loaded and shaped. In Power BI Desktop, Get data connects to hundreds of sources: databases, files, lakehouses and warehouses in Fabric, SharePoint lists, web APIs and more. Power Query, the same tool used in Excel and Dataflow Gen2, then shapes each table with recorded steps: removing unneeded columns, filtering rows, fixing data types, splitting and merging columns, and combining tables. Because the steps are recorded, they run again on every refresh, so the cleanup happens automatically.
A good practice is to do as much shaping as possible upstream, in the lakehouse or warehouse, so that many reports benefit from it, and to keep Power Query steps in the report light. Keiko's pilot model needed almost none, because the gold layer was already clean. Her old workbook, by contrast, had forty steps of cleanup that ran every morning on her laptop.
Date tables and time intelligence
Almost every business model needs a date table: one row per day, with columns for week, month, quarter, fiscal period, holidays and anything else people group by. Power BI's time intelligence functions in DAX, such as year-to-date totals and comparisons with the same period last year, work properly only when the model has a complete date table marked as such and related to the fact table. Harrow & Finch's fiscal year starts in February, so Keiko's date table included fiscal columns, and her Sales Last Year measure compared fiscal weeks rather than calendar weeks.
Measures in practice
Keiko listed the measures the store report would need: Total Sales, Total Units, Transactions, Average Basket, Margin, Margin Rate, Sales Last Year, Sales Growth and Loyalty Share of Sales. Each would be defined once in the model and reused in every visual, so a store manager and the finance director would always see the same number for the same question. That alone, she said, would end a monthly argument about why finance's figures never matched the stores'. Nikolai added that the model should also hide technical columns, such as surrogate keys, and give every visible field a business-friendly name, because readers explore models through those names.
Licensing in brief
Power BI access depends on licences and capacity. Authors who publish and share content need a paid per-user licence, and readers need either their own licence or access to content stored in a workspace on a Fabric or Power BI capacity of sufficient size. Harrow & Finch's Fabric capacity would let store managers read the pilot reports without individual licences, which was part of the cost case. Exact licence names and thresholds change, so the team checked the current Microsoft pages before budgeting.
Worked problem
Report or dashboard?
Which should each person get? (a) Dana wants one screen with this week's sales, margin and online orders, drawn from three different reports. (b) A buyer wants to filter sales by supplier, drill from category to product and compare months. (c) Store managers want a packaged set of reports with simple navigation.
Show solution
- One screen of key figures from several reports is a dashboard.
- Interactive filtering and drill down on one model is a report.
- A packaged set of reports and dashboards for a group is an app.
Answer: (a) Dashboard, (b) report, (c) app.
Common mistakes
MistakeUsing report and dashboard as synonyms.
InsteadA report has pages of interactive visuals from one model; a dashboard is a single page of pinned tiles built in the service.
MistakeWriting totals as calculated columns.
InsteadUse measures, which respond to filters and use less memory.
MistakeBuilding a separate model for every report.
InsteadShare one well-designed semantic model across many reports.
MistakeCreating a copy of a report for each store.
InsteadUse row-level security so one report shows each manager their own store.
Summary and key terms
- Power BI is Microsoft's business intelligence platform and a Fabric workload.
- Power BI Desktop builds models and reports; the Power BI service publishes, refreshes, shares and secures them in workspaces and apps; mobile apps and embedding extend their reach.
- A report is a multi-page interactive view of one semantic model; a dashboard is a single page of pinned tiles built in the service.
- A semantic model holds tables, relationships with cardinality and filter direction, DAX measures, calculated columns and hierarchies, usually in a star schema.
- Storage modes include Import, DirectQuery and Direct Lake.
- Roles, row-level security and sensitivity labels control access.
- Power BI Desktop
- The application for connecting to data, modelling it and designing reports.
- Power BI service
- The cloud service for publishing, sharing and securing Power BI content.
- Report
- A multi-page, interactive view of one semantic model.
- Dashboard
- A single page of tiles pinned from reports, built in the Power BI service.
- Semantic model
- The tables, relationships and calculations behind Power BI reports.
- Measure
- A DAX calculation evaluated in the context of the current filters.
- Hierarchy
- Columns arranged in levels for drilling down, such as year, month and day.
- Row-level security
- Rules that restrict which rows of data a reader can see.
Practice problems
Work each problem on paper first, then reveal the answer to check.
Where are Power BI dashboards built?
Show answer
In the Power BI service.
What is the most common relationship cardinality in a star schema?
Show answer
One-to-many.
Which storage mode reads Delta tables in OneLake directly?
Show answer
Direct Lake.
Lesson quiz · 5 questions
Score 60% or more to complete this lesson.
Create a free account to save your progress, take quizzes and earn a certificate.