
MSAZ-121 · Lesson 10 of 12 · 18 min
Real-time analytics services
▶ Video coming soon A video version of this lesson is on the way.
After lesson 9, Grace Oduya had one question: "What do we actually build?" The freezer sensors at the Brandon store already sent a reading every ten seconds to a small gateway in the back office. The door counters sent a count every minute. The tills could publish each completed sale as an event. Nikolai's task for the clinic on November 12, 2026 was to show Keiko and Grace the Microsoft services that turn streams like these into dashboards and alerts, and to sketch the pilot planned for early 2027.
The shape of a real-time solution
Every real-time analytics solution has the same parts, whatever the products. Ingestion receives events from producers and holds them durably. Processing filters, enriches and aggregates events as they flow, often in time windows. Storage keeps events, and often aggregates, in a store that can be queried quickly, including recent history. Action and visualization show live dashboards, raise alerts or trigger workflows. Many solutions also send events to a lake or warehouse for long-term batch analysis.
Real-Time Intelligence in Microsoft Fabric
Real-Time Intelligence is the Fabric workload for streaming data. It brings the parts of a real-time solution into Fabric so that they share OneLake, workspaces and security with the rest of the platform. Its main components, as Microsoft describes them, are:
| Component | What it does |
|---|---|
| Real-Time hub | A catalogue for discovering, adding and sharing streaming data across the organization |
| Eventstream | A no-code way to capture events, transform them and route them to destinations |
| Eventhouse | A store and engine optimized for time-based event data, queried with KQL |
| KQL queryset | A place to write and save queries against Eventhouse data in KQL or T-SQL |
| Real-Time dashboard | Dashboards built on streaming data that refresh as new events arrive |
| Activator | Rules that watch data and trigger actions, such as emails, Teams messages or pipelines, when conditions are met |
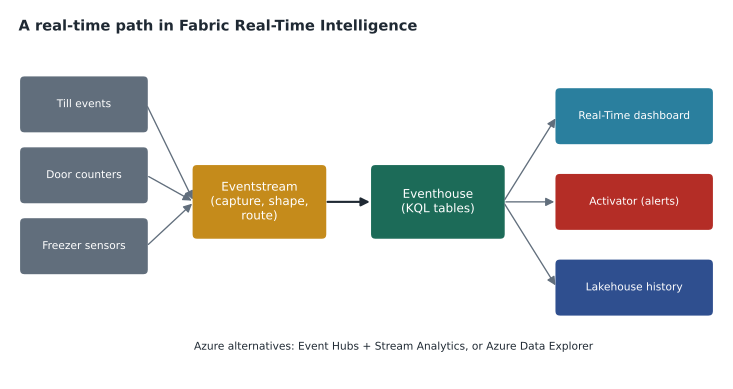
An eventstream connects to sources such as Azure Event Hubs, Azure IoT Hub, database change feeds or custom apps, applies simple transformations such as filtering, adding fields or aggregating over windows, and sends the results to destinations such as an Eventhouse, a lakehouse or Activator. An Eventhouse contains one or more KQL databases, which hold tables optimized for data that arrives continuously and is queried by time: they ingest quickly, index and compress automatically, and answer queries over billions of rows in seconds. Activator watches values and raises actions when they cross thresholds or change in defined ways, without code.
Kusto Query Language
Eventhouse data is queried with Kusto Query Language (KQL), the same language used by Azure Data Explorer and by Log Analytics in Azure Monitor. A KQL query starts with a table name and passes the data through a chain of operators separated by pipe characters, each one filtering, shaping or summarizing the result of the one before. This reads naturally from top to bottom, which makes KQL quick to learn for exploration.
FreezerReadings
| where Timestamp > ago(1h) and Store == "Brandon"
| summarize AvgTemp = avg(Temperature) by FreezerId, bin(Timestamp, 1m)
| where AvgTemp > -12
| order by Timestamp desc
Read the query line by line: start with the FreezerReadings table, keep the last hour of Brandon readings, compute the average temperature for each freezer in each one-minute bin, keep only averages warmer than minus 12, and show the latest first. The same query could feed a tile on a Real-Time dashboard. Keiko noticed that KQL could also be bypassed: a KQL queryset accepts T-SQL too, though KQL offers more time-series functions.
Azure services for real-time analytics
Real-time analytics also has stand-alone Azure services, which many organizations already use and which appear in DP-900 study material. Azure Event Hubs is a big-data event ingestion service that can receive millions of events per second and keep them for a configured period so several consumers can read them. Azure IoT Hub adds secure device registration and two-way communication for connected devices. Azure Stream Analytics is a managed stream processing engine: you write a SQL-like query, such as the tumbling-window query in lesson 9, connect inputs and outputs, and it runs continuously. Azure Data Explorer is a fast analytics service for log and telemetry data, using the same Kusto engine and KQL as an Eventhouse. Spark Structured Streaming, in Fabric notebooks or Azure Databricks, processes streams with Spark code and suits teams that already work in Spark.
| Need | Fabric option | Azure service options |
|---|---|---|
| Receive high volumes of events | Eventstream (with built-in or Azure sources) | Azure Event Hubs; Azure IoT Hub for devices |
| Process a stream with windows | Eventstream transformations; Spark notebooks | Azure Stream Analytics; Azure Databricks |
| Store and query time-based data fast | Eventhouse (KQL databases) | Azure Data Explorer |
| Live dashboards | Real-Time dashboard; Power BI | Power BI; Azure Data Explorer dashboards |
| Alerts and actions | Activator | Stream Analytics outputs to Functions or Logic Apps; Azure Monitor alerts |
These pieces combine. A common pattern is devices sending to IoT Hub, an eventstream reading from IoT Hub, an Eventhouse storing the readings, and Activator sending alerts. Another is Event Hubs feeding Stream Analytics, which writes aggregates to a database and to Power BI. The DP-900 outline asks you to identify the services, not to design them in detail.
The freezer pilot
Nikolai sketched the pilot planned for February 2027. The gateway at the Brandon store would send readings to an IoT hub, because the sensors needed to be registered and managed as devices. A Fabric eventstream would read from the hub, add the store and freezer names from a reference table, and route every reading to an Eventhouse table. An Activator rule would watch the one-minute average for each freezer and, after five warm minutes in a row, post a message to the store's Teams channel and send a text to the duty manager. Grace would get a Real-Time dashboard with a tile for every freezer, and the readings would also land in the lakehouse so that Keiko could produce a monthly maintenance report in batch.
# Activator-style rule: alert once when a freezer has five warm minutes in a row, then reset
minute_avgs = [-18.1, -17.6, -15.0, -12.5, -11.4, -10.7, -9.7, -8.7, -7.8, -14.9, -17.8]
threshold, needed = -12.0, 5
run, alerted = 0, False
for minute, avg in enumerate(minute_avgs):
    run = run + 1 if avg > threshold else 0
    if run >= needed and not alerted:
        print(f"minute {minute}: send alert to duty manager (avg {avg})")
        alerted = True
    if run == 0 and alerted:
        print(f"minute {minute}: back to normal, alert cleared")
alerted = Falseminute 8: send alert to duty manager (avg -7.8) minute 9: back to normal, alert cleared
What this code does
Applies an alert rule to the per-minute freezer averages: it raises one alert when the temperature has been too warm for five minutes in a row, does not repeat it while the problem continues, and clears it once the freezer is back to normal. This avoids a flood of repeated alerts. It mirrors how a Fabric Activator rule triggers an action.
The script shows two details that real rules need: send the alert once, not every minute while the condition lasts, and clear it when the freezer recovers, so the next failure raises a fresh alert.
Costs and cautions
Real-time services run continuously, so they cost money even when nothing interesting happens. Event volume, retention period, query frequency and the number of always-on components all affect the bill. Nikolai planned to keep raw readings in the Eventhouse for 30 days and move older history to the lakehouse, where storage is cheaper. He also listed what could go wrong: a gateway losing its internet connection, sensors sending duplicate readings, clocks drifting so event times are wrong. Each needed a check, such as an alert when a freezer sends no readings for ten minutes, which catches a dead gateway as well as a dead freezer.
Exploring live data in the Real-Time hub
The Real-Time hub is the starting point for streaming data in Fabric. It lists every data stream the organization has already connected, such as eventstreams and KQL tables, so that teams can find and reuse them instead of connecting the same source twice. It also lists Fabric events, such as a file arriving in OneLake or a job finishing, and Azure events, such as a blob being created in a storage account, which can start pipelines or trigger Activator rules. From the hub, a user can preview a stream, subscribe to it or route it to a new destination.
Keiko found the hub reassuring. Once the freezer stream existed, anyone with access could find it there, see who owned it and build on it, rather than asking Nikolai to connect it again for every new report.
A closer look at the Eventhouse
An Eventhouse is designed for data that has a timestamp and arrives continuously: telemetry, logs, clicks and transactions. Tables in its KQL databases ingest quickly, either in streaming mode, where each event is available within seconds, or in small batches, which is cheaper. Data is automatically indexed and compressed by column, and recent data is kept in a hot cache for the fastest queries, while older data stays in cheaper storage and is still queryable. A retention policy deletes data after a set period, and OneLake availability can expose the tables as Delta tables in OneLake, so lakehouse and Power BI users can read the same data.
KQL has many functions built for time series: bin to group timestamps into intervals, ago for relative times, make-series to fill gaps, and functions that detect anomalies or forecast trends. A single line can find freezers whose temperature pattern is unusual compared with their own history, which is the kind of question Grace's team would ask next.
FreezerReadings
| where Timestamp > ago(7d)
| make-series AvgTemp = avg(Temperature) default = 0 on Timestamp step 1h by FreezerId
| extend Anomalies = series_decompose_anomalies(AvgTemp)
| project FreezerId, AvgTemp, Anomalies
Choosing between Fabric and Azure services
If both Fabric and stand-alone Azure services can do the job, which should a company choose? Nikolai's answer depended on context. A company already committed to Fabric for analytics gains a lot from Real-Time Intelligence: one platform, one copy of data in OneLake, shared security and Power BI built in. A company with an existing Event Hubs and Stream Analytics solution, or a software team building streaming into an application, may prefer the Azure services, which are configured and billed individually and can be embedded in application architectures. The two also work together: Event Hubs and IoT Hub are common sources for Fabric eventstreams.
Who owns a real-time solution?
Real-time systems need clear ownership, because an alert that nobody answers is worse than no alert. For the freezer pilot, Grace's store operations team owned the alert rules and the response procedure, the store duty managers owned the immediate action, and Nikolai's data team owned the pipeline and its health. Each alert would include the store, freezer, current average and a link to the dashboard, so the duty manager could act without opening another tool.
Worked problem
Identifying the service
Which service or component fits each requirement? (a) Store billions of sensor readings and answer time-based queries in seconds, inside Fabric. (b) Send a Teams message when a value crosses a threshold, without writing code, inside Fabric. (c) Run a continuous SQL-like windowed query over events from Azure Event Hubs, outside Fabric. (d) Receive millions of events per second from many producers.
Show solution
- Time-based data at scale with fast queries in Fabric is an Eventhouse.
- No-code alerts and actions on data in Fabric are Activator.
- Continuous SQL-like stream queries as a managed Azure service are Azure Stream Analytics.
- High-volume event ingestion is Azure Event Hubs.
Answer: (a) Eventhouse, (b) Activator, (c) Azure Stream Analytics, (d) Azure Event Hubs.
Common mistakes
MistakeThinking Real-Time Intelligence is a single product.
InsteadIt is a Fabric workload with several components: Real-Time hub, Eventstream, Eventhouse, KQL queryset, Real-Time dashboards and Activator.
MistakeExpecting KQL to look like SQL.
InsteadKQL starts with a table and pipes the data through operators.
MistakeAlerting on every reading above a threshold.
InsteadAggregate over windows and require the condition to persist to avoid false alarms.
MistakeForgetting to alert on missing data.
InsteadA sensor or gateway that stops sending is also a failure.
Summary and key terms
- A real-time analytics solution ingests events, processes them as they flow, stores them for fast time-based queries, and visualizes or acts on them.
- In Microsoft Fabric, Real-Time Intelligence provides the Real-Time hub, Eventstream for capture and routing, Eventhouse with KQL databases for storage and queries, KQL querysets, Real-Time dashboards and Activator for no-code alerts and actions.
- Kusto Query Language pipes a table through operators.
- Azure services include Event Hubs and IoT Hub for ingestion, Stream Analytics for SQL-like stream processing, Azure Data Explorer for KQL analytics and Spark Structured Streaming.
- Real-Time Intelligence
- The Microsoft Fabric workload for streaming and event data.
- Eventstream
- A Fabric item that captures, transforms and routes events without code.
- Eventhouse
- A Fabric store of KQL databases optimized for time-based data.
- KQL
- Kusto Query Language, which pipes data through operators.
- Activator
- A Fabric component that triggers actions when data meets conditions.
- Azure Event Hubs
- An Azure service that ingests very high volumes of events.
- Azure Stream Analytics
- A managed Azure service that runs continuous SQL-like queries over streams.
Practice problems
Work each problem on paper first, then reveal the answer to check.
Which language queries an Eventhouse?
Show answer
Kusto Query Language (KQL), and T-SQL in a KQL queryset.
Which Fabric component sends an alert when a value crosses a threshold?
Show answer
Activator.
Which Azure service adds device management to event ingestion?
Show answer
Azure IoT Hub.
Lesson quiz · 5 questions
Score 60% or more to complete this lesson.
Create a free account to save your progress, take quizzes and earn a certificate.