
MSAZ-121 · Lesson 12 of 12 · 18 min
Choosing visualizations
▶ Video coming soon A video version of this lesson is on the way.
The last clinic of the series brought the whole course together. Keiko had built a first draft of the Store Performance report from a sample of gold-layer data, and Nikolai, Grace Oduya and Dana Whitcombe gathered round a screen to review it. The draft had eleven visuals on one page: two pie charts with fourteen slices each, a gauge, a three-dimensional column chart, a map with a dot for every sale, and a table of 400 rows. Everything was correct, and almost nothing was clear. Dana said what everyone was thinking: "I can't tell whether we had a good week."
Choosing visualizations is the last DP-900 objective, and it is less about Power BI's menus than about matching a picture to a question. A visual is good when the reader can answer the question it was chosen for at a glance, and bad when they have to work it out.
Start with the question
Every visual should answer one question, and the question decides the visual. Most business questions fall into a small number of types: comparing values across categories, showing change over time, showing parts of a whole, showing a single key number against a target, showing the relationship between two measures, showing distribution, and showing where something happens. Power BI has visuals for each, and the DP-900 outline expects you to recognize appropriate choices.
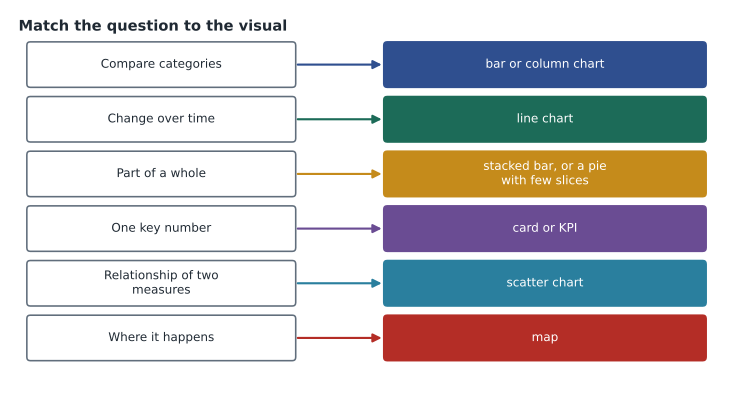
Comparing categories: bar and column charts
Bar charts, with horizontal bars, and column charts, with vertical bars, compare values across categories: sales by store, units by department, returns by reason. People judge length along a common baseline very accurately, which is why bars are the most useful general-purpose chart. Horizontal bars suit long category names, such as store names, and long lists; columns suit a few categories or categories in a natural order. Sort bars by value unless the categories have their own order, and start the value axis at zero, because a bar's length is its message. Clustered bars compare two measures side by side, such as this year and last year for each store.
Change over time: line charts
Line charts show how a measure changes over a continuous period: weekly sales across a year, daily website visits, freezer temperatures by minute. The eye follows the slope, so trends, seasonality and sudden changes stand out. Several lines can share a chart if there are only a few, such as sales for three regions; more than four or five lines become a tangle. Area charts are line charts with the area below filled, useful for showing volume; combo charts combine columns and a line, for example monthly sales as columns and margin rate as a line on a second axis, though that second axis must be clearly labelled.
Parts of a whole: pie, donut, stacked bars and treemaps
Pie and donut charts show how a total divides into parts, but people judge angles and areas poorly, so they work only with a few slices, perhaps two to five, that differ clearly. Keiko's fourteen-slice pies were impossible to read. Stacked bar or stacked column charts show parts of a whole and allow comparison across categories, such as the department mix of each store. Power BI's 100-stacked versions, scaled so every bar has the same total, show shares rather than amounts. A treemap shows parts of a whole as nested rectangles and copes with many categories and hierarchies, such as department then category.
Key numbers: cards, KPIs and gauges
Some questions want one number: total sales this week, online orders today, average basket. A card shows a single value in large type; a multi-row card shows several. A KPI visual shows a value against a target with an indicator of whether it is on track and a small trend, which is exactly what Dana meant by "a good week". A gauge shows a value on a dial against a target; it takes more space than a KPI for the same information. Key numbers belong at the top left of a page, where readers look first.
Relationships, distributions and detail
A scatter chart plots items by two measures, one on each axis, to show whether they are related: each store's staff hours against its sales, or temperature against patio furniture sales. A bubble chart adds a third measure as the size of each point. Distributions, such as how basket sizes are spread, are shown with histograms, built in Power BI as column charts of value ranges. Tables and matrices show exact values; a matrix groups rows and columns like a pivot table and supports drill down. They are right when readers need to look up figures, and wrong as the main way to show a pattern.
Where it happens: maps
Maps show values by location: sales by store, deliveries by postal area, door counts by province or state. Power BI's map visuals plot points or shade regions. A map is useful when location matters to the question, such as where online customers live relative to stores. A dot for every sale, as in Keiko's draft, shows only where the stores are, which everyone already knew.
| Question | Good choices | Usually avoid |
|---|---|---|
| How do stores compare? | Sorted bar chart | Pie with many slices; 3-D columns |
| How are sales trending? | Line chart | Pie or table |
| What share does each department have? | Stacked bar, treemap, pie with few slices | Line chart |
| Did we hit the target? | KPI or card | Large table |
| Do staff hours relate to sales? | Scatter chart | Two separate bar charts |
| Where are customers? | Map | Bar chart of postal codes |
| What exactly did each store sell? | Table or matrix | Chart with dozens of labels |
Design principles
Beyond choosing chart types, a few principles make reports readable. Put the most important information top left and build the page so it reads like a story: headline figures first, then the main breakdowns, then detail. Limit each page to a handful of visuals. Use colour sparingly and consistently: one colour per measure or category across every page, a neutral colour for everything else, and a highlight colour only for what needs attention; never use colour alone to carry meaning, since some readers cannot distinguish red from green. Remove clutter such as heavy gridlines, 3-D effects and unnecessary decimals. Give every visual a title that states its point where possible. And design for the device: store managers would mostly read on tablets, so Keiko would also build a mobile layout.
Accessibility matters too. Power BI supports alternative text for visuals, keyboard navigation, screen readers and a high-contrast mode. Alt text should say what the visual shows and its main message, not just its type. Tab order should follow the logical reading order.
# A quick check of Keiko's draft against her own rules of thumb
visuals = [("Sales by store", "pie", 14), ("Department mix", "pie", 9), ("Weekly sales", "line", 1),
           ("Margin", "gauge", 1), ("Units by department", "3-D column", 8), ("Every sale", "map", 600000)]
for title, kind, items in visuals:
    advice = []
    if kind == "pie" and items > 5: advice.append("too many slices: use a sorted bar chart")
    if kind.startswith("3-D"): advice.append("drop the 3-D effect")
    if kind == "map" and items > 1000: advice.append("plot stores, not individual sales")
    print(f"{title:20s} {kind:10s} {'; '.join(advice) or 'fine'}")
print("Visuals on page:", len(visuals) + 5, "-> aim for about six")Sales by store pie too many slices: use a sorted bar chart Department mix pie too many slices: use a sorted bar chart Weekly sales line fine Margin gauge fine Units by department 3-D column drop the 3-D effect Every sale map plot stores, not individual sales Visuals on page: 11 -> aim for about six
What this code does
Checks each visual in a draft report against simple design rules of thumb: pie charts with too many slices, 3-D effects, and maps that try to plot every individual sale. Each visual is labelled fine or given a suggested fix. The last check is whether the page has too many visuals.
The second draft
Keiko's second draft had six visuals. Across the top, three KPI visuals showed this week's sales, margin and loyalty sign-ups against targets. Below them, a sorted bar chart compared sales by store with last year's figure as a marker, and a line chart showed the last 52 weeks of sales with the previous year as a lighter line. At the bottom, a matrix listed departments with drill down to categories for anyone who needed exact numbers. A slicer let regional managers choose a region, and row-level security meant store managers saw only their own store. Dana looked for about ten seconds and said, "Good week, except for Store 12." That was the point.
Bringing the course together
The second draft depended on everything before it. Its data came from a gold-layer star schema in a Fabric lakehouse, built by ELT pipelines from StockLine, from the loyalty data mirrored out of Cosmos DB, and from door counts once kept in Table storage. Product images for drill-through pages came from Blob storage. The freezer tiles on Grace's operations page came from an Eventhouse fed by an eventstream. Keiko could now explain each piece, which was the goal she had set herself in lesson 1. She planned to sit DP-900 in March 2027, after the first month of the pilot.
Interaction: letting readers ask the next question
Power BI reports are interactive, and good design uses that. Cross-filtering and cross-highlighting mean that selecting a bar in one visual filters or highlights the others on the page. Slicers give readers obvious controls for common filters, such as region or week. Drill down follows a hierarchy within a visual, from department to category to product. Drill-through pages show detail for one item: right-click a store in the bar chart and open a page with that store's departments, staff hours and freezer status. Tooltips can show a small chart when the reader hovers over a point. These features let one tidy page answer many follow-up questions without cramming every visual onto it.
Keiko added a drill-through page for each store and a tooltip that showed the last eight weeks of sales when a reader hovered over a store's bar. Grace said that was the feature store managers would use most.
Reviewing a report before it is published
Keiko turned the lesson into a checklist for every report she would publish. Does each visual answer a stated question? Are key numbers at the top left? Are bar axes starting at zero and bars sorted? Are colours consistent with the company's other reports, with status shown by more than colour alone? Is there alt text for every visual and a sensible tab order? Does the mobile layout work on a tablet? Are row-level security roles tested by viewing the report as a store manager? Are measure names and descriptions clear? And has someone from the audience, not the author, looked at it for ten seconds and said what it tells them? She planned to ask Grace and Dana to be those reviewers for the first month of the pilot.
Nikolai added one item from experience: check that every number on the page can be traced to a single measure in the semantic model. If two visuals calculate the same figure in different ways, they will eventually disagree, and readers will stop trusting both.
Worked problem
Choosing visuals for a page
Grace wants a store operations page that answers: (a) How many shoppers are in each store right now? (b) How did door counts change hour by hour today? (c) Is there a relationship between door counts and sales across stores? (d) Which freezers are outside their safe range?
Show solution
- Comparing current counts across stores is a category comparison: a sorted bar chart.
- Hourly change through the day is change over time: a line chart.
- A relationship between two measures across stores is a scatter chart.
- A few freezers that need attention suit cards or a table highlighted with a consistent warning colour, with an icon or text as well as colour.
Answer: (a) Bar chart, (b) line chart, (c) scatter chart, (d) cards or a highlighted table.
Common mistakes
MistakeUsing pie charts for many categories.
InsteadUse a sorted bar chart, or keep pies to a few clearly different slices.
MistakeStarting bar chart axes above zero.
InsteadBars encode length, so the axis should start at zero.
MistakePutting every available visual on one page.
InsteadAnswer a few questions per page and move detail to drill-through pages.
MistakeRelying on red and green alone to show status.
InsteadAdd icons, labels or patterns so the meaning does not depend on colour.
Summary and key terms
- Choose each visual to answer one question.
- Bar and column charts compare categories; line charts show change over time; pie, donut, stacked bars and treemaps show parts of a whole, with pies limited to a few slices; cards, KPIs and gauges show key numbers against targets; scatter and bubble charts show relationships; tables and matrices show exact values; maps show location.
- Good reports put key figures first, limit visuals per page, use colour sparingly and consistently, avoid clutter and 3-D effects, design for the reader's device and include accessibility features such as alt text.
- Bar chart
- A chart that compares categories with horizontal bars.
- Line chart
- A chart that shows how a measure changes over time.
- KPI visual
- A visual that shows a value against a target with a status indicator.
- Scatter chart
- A chart that plots items by two measures to show a relationship.
- Treemap
- Nested rectangles that show parts of a whole, including hierarchies.
- Matrix
- A table that groups rows and columns and supports drill down.
- Alt text
- A text description of a visual for screen reader users.
Practice problems
Work each problem on paper first, then reveal the answer to check.
Which visual best shows a trend over 52 weeks?
Show answer
A line chart.
When is a pie chart appropriate?
Show answer
For a few clearly different parts of a whole.
Which visual shows whether a value is on target?
Show answer
A KPI visual (or a gauge or card with a target).
Lesson quiz · 5 questions
Score 60% or more to complete this lesson.
Create a free account to save your progress, take quizzes and earn a certificate.