
MBA-511 · Lesson 7 of 12 · 19 min
Risk, return and diversification
Prairie Ridge Energy's board has been presented with a proposal to buy a chain of farm equipment dealerships. The strategy team argues that the dealerships would smooth the company's earnings, which swing with oil and gas prices, and so reduce risk for shareholders. Owen is sceptical but cannot say exactly why. Dr. Varga uses the proposal to open the two lessons on risk. The first explains how investors measure risk and why only some of it is rewarded. The second, lesson 8, turns that idea into a discount rate.
What history says about risk and return
The long-run record of financial markets shows a clear pattern: assets with more volatile returns have, on average, earned higher returns. Over the past century, Canadian and US shares have returned roughly 9 to 10 per cent a year on average in nominal terms, long-term government bonds roughly 5 to 6 per cent and short-term Treasury bills roughly 3 to 4 per cent, with inflation averaging about 3 per cent. The difference between the average return on shares and on bills, the historical equity risk premium, has been around 5 to 6 points a year. But the extra return came with much larger swings: Canadian shares fell by more than a third in the global financial crisis of 2008 and by about a third in a few weeks in early 2020 before recovering.
Two measures summarize the pattern. The expected return is the probability-weighted average of possible outcomes, estimated in practice from history or from forward-looking models. Risk is usually measured by the standard deviation of returns, the typical size of deviations from the average, or by its square, the variance. The annual standard deviation of a broad stock index has been about 15 to 20 per cent, that of individual shares typically 25 to 50 per cent, and that of short-term government bills close to zero.
Why diversification works
Here is the puzzle that motivates the rest of this lesson. If individual shares have standard deviations of 30 to 50 per cent but the market as a whole has a standard deviation of under 20 per cent, much of the risk of each share must disappear when shares are combined. It does, and the reason is that the returns of different companies are not perfectly correlated. When one company has a bad quarter because a product fails or a plant floods, others are having good quarters for their own reasons, and the surprises partly cancel out.
For a portfolio of two assets with weights w1 and w2, the variance depends on the variances of each asset and on their covariance, the product of their correlation and standard deviations. Only if the correlation is plus one is the portfolio's standard deviation the weighted average of the two; for any lower correlation it is less.
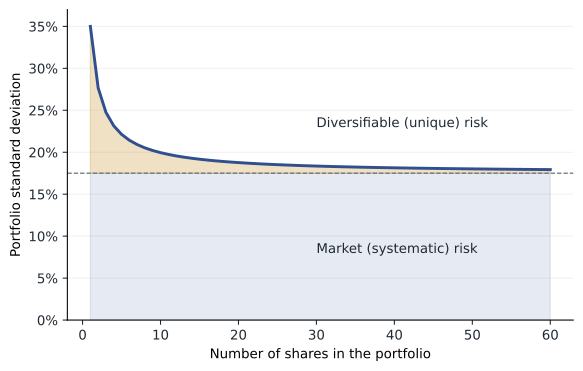
FIN-301 explored this formula from an investor's point of view, tracing out the minimum-variance portfolio and the efficient set. For a manager the key result is what happens as more and more shares are added. In an equally weighted portfolio of n shares, each with the same variance and the same average correlation with the others, the portfolio variance approaches the average covariance as n grows. The part of each share's risk that is unique to it, called diversifiable, unsystematic or idiosyncratic risk, is diversified away. What remains is the risk common to all shares, the risk of the economy and the market as a whole, called systematic or market risk.
# Two-asset portfolio risk, and how diversification shrinks risk toward a floor
import math
def two_asset(w1, s1, s2, rho):
    w2 = 1 - w1
    var = (w1 * s1) ** 2 + (w2 * s2) ** 2 + 2 * w1 * w2 * rho * s1 * s2
    return math.sqrt(var)
for rho in (1.0, 0.5, 0.0, -0.5):
    print(f"50/50 mix of 30% and 40% risk shares, correlation {rho:+.1f}: sd {two_asset(0.5, 0.30, 0.40, rho):.1%}")

sd, rho = 0.35, 0.25          # typical share: 35% sd, average correlation 0.25
for n in (1, 2, 5, 10, 30, 100, 1000):
    var = sd ** 2 / n + (1 - 1 / n) * rho * sd ** 2
    print(f"{n:5d} shares: portfolio sd {math.sqrt(var):.1%}")
print(f"floor as n grows: {math.sqrt(rho) * sd:.1%}")50/50 mix of 30% and 40% risk shares, correlation +1.0: sd 35.0%
50/50 mix of 30% and 40% risk shares, correlation +0.5: sd 30.4%
50/50 mix of 30% and 40% risk shares, correlation +0.0: sd 25.0%
50/50 mix of 30% and 40% risk shares, correlation -0.5: sd 18.0%
1 shares: portfolio sd 35.0%
2 shares: portfolio sd 27.7%
5 shares: portfolio sd 22.1%
10 shares: portfolio sd 20.0%
30 shares: portfolio sd 18.4%
100 shares: portfolio sd 17.8%
1000 shares: portfolio sd 17.5%
floor as n grows: 17.5%Only systematic risk is rewarded
Diversification is cheap. An investor can hold hundreds of companies through a low-cost index fund for a fee of a few hundredths of a per cent a year. Because diversifiable risk can be eliminated at almost no cost, competitive markets do not reward investors for bearing it. If a share offered a high expected return only because it had a lot of unique risk, diversified investors would buy it, since the unique risk would barely affect their portfolios, and they would bid up its price until its expected return fell. The return that investors can expect from an asset therefore depends only on its systematic risk, how much it moves with the market, not on its total volatility.
This idea is one of the most important in finance, and its consequences for managers are practical. A gold mining company may have very volatile returns, but if those returns are only loosely related to the market, its systematic risk and its required return may be modest. A utility may have stable earnings, but if those earnings move with the economy, it still carries systematic risk. The right discount rate for a project depends on how its cash flows move with the economy, not on how uncertain they are in isolation.
The efficient frontier and the market portfolio
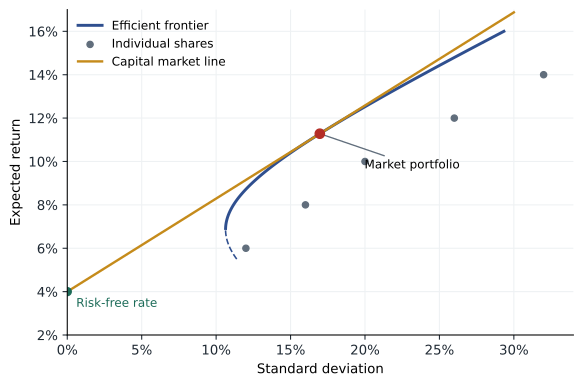
Harry Markowitz showed in 1952 that, given estimates of expected returns, standard deviations and correlations, there is a set of portfolios that give the highest expected return for each level of risk, the efficient frontier. James Tobin added a risk-free asset. Once investors can lend and borrow at a risk-free rate, the best risky portfolio is the one on the frontier with the highest ratio of excess return to risk, the tangency portfolio, and every investor should hold some mix of that portfolio and the risk-free asset. The line joining the risk-free rate to the tangency portfolio is the capital market line. If all investors share the same estimates, the tangency portfolio must be the market portfolio of all risky assets in proportion to their values. This is the foundation of the capital asset pricing model in lesson 8.
Should firms diversify for their shareholders?
Back to Prairie Ridge's proposal. The dealerships would indeed smooth the company's earnings: farm equipment demand is only partly linked to energy prices. But shareholders do not need Prairie Ridge to diversify for them. Any investor who wants exposure to both energy and farm equipment can buy shares of both kinds of company, in whatever proportions suit them, for a trivial fee. The diversification the merger offers is something shareholders can already do more cheaply and more flexibly themselves. And acquiring a company usually means paying a premium over its market value, often 20 to 40 per cent, which is a large price for a benefit shareholders can get for nothing.
The evidence supports this reasoning. Studies of diversified conglomerates, beginning with work by Philip Berger and Eli Ofek and by Larry Lang and René Stulz in the 1990s, found that they traded on average at a discount of roughly 10 to 15 per cent compared with portfolios of focused firms in the same industries, though later research argued that part of the discount reflects which firms choose to diversify. Many conglomerates have since broken themselves up. Dr. Varga notes that diversification at the corporate level can create value in specific circumstances: when the businesses share real capabilities or customers, when the combined firm can borrow more cheaply or use tax losses, or when it reduces the costs of financial distress, a topic for lesson 9. But reducing earnings volatility for its own sake is not one of them.
There is one group for whom firm-specific risk does matter: people who cannot diversify it away. The founding family of Northfield has most of its wealth in the company. Leo's employees hold stock options in Kestrel. Managers whose careers depend on a single firm bear its unique risk. These undiversified stakeholders may sensibly prefer lower risk, and their preferences can lead to decisions, such as conglomerate mergers, that serve them more than diversified shareholders. This is a version of the agency problem introduced in lesson 1.
Risk that managers can see but investors cannot diversify
Dr. Varga adds a practical caution. The distinction between systematic and unique risk is clean in theory but takes judgment in practice. Some risks that look specific to one company are in fact tied to the economy. A retailer's risk that a new store underperforms is mostly unique, but the risk that all its stores suffer in a recession is systematic. An energy producer's risk that one well is dry is unique; its exposure to the price of oil is shared with every other producer and with much of the economy. When estimating the cost of capital for a project, the question to ask is not how uncertain the project is but how its cash flows would behave in a bad year for the economy as a whole.
Unique risks still matter to managers even if investors do not demand a return for bearing them. They affect expected cash flows, and they can push a firm into financial distress, with real costs that lesson 9 describes. That is why firms buy insurance, hedge commodity prices and diversify suppliers: not to lower their cost of capital directly, but to avoid losses that would disrupt operations or force the sale of assets at poor prices. Grace's decision to use two suppliers for Fairway's private-label products is a sensible response to a unique risk, even though Fairway's shareholders, holding many companies, would barely notice if one supplier failed.
Worked problem
Risk in Hana's endowment
Lakeview Health's foundation holds a small endowment, of which 60 per cent is in a broad equity index with a standard deviation of 16 per cent and 40 per cent in a bond fund with a standard deviation of 6 per cent. The correlation between the two is 0.2. What is the portfolio's standard deviation, and how does it compare with the weighted average of the two?
Show solution
- Compute the weighted variance terms: 0.6 squared times 0.16 squared = 0.009216 and 0.4 squared times 0.06 squared = 0.000576.
- Covariance term: 2 times 0.6 times 0.4 times 0.2 times 0.16 times 0.06 = 0.000922.
- Total variance = 0.010714; standard deviation = square root = 0.1035, about 10.4 per cent.
- Weighted average of standard deviations = 0.6 times 16 plus 0.4 times 6 = 12.0 per cent.
Answer: The portfolio's standard deviation is about 10.4 per cent, lower than the 12.0 per cent weighted average because the two funds are far from perfectly correlated. The foundation gets most of the equity market's expected return with noticeably less risk.
Common mistakes
MistakeThe riskier an asset is in isolation, the higher its required return.
InsteadRequired return depends on systematic risk, not total volatility.
MistakeA firm should diversify to reduce risk for its shareholders.
InsteadShareholders can diversify more cheaply themselves; diversification for its own sake rarely creates value.
MistakeDiversification can eliminate all risk.
InsteadIt removes unique risk but not market risk.
MistakeA portfolio's standard deviation is the weighted average of its holdings' standard deviations.
InsteadIt is lower whenever correlations are below plus one.
Summary and key terms
- Over long periods, riskier assets such as shares have earned higher average returns than bonds and bills.
- Combining assets that are not perfectly correlated reduces risk; adding many shares eliminates their unique risk.
- Only systematic, or market, risk is rewarded, because unique risk can be diversified away at almost no cost.
- The efficient frontier and the capital market line show that efficient portfolios combine the risk-free asset and the market portfolio.
- Firms rarely create value by diversifying for shareholders, although undiversified stakeholders may prefer it.
- Standard deviation
- A measure of the typical deviation of returns from their average, used as a measure of risk.
- Correlation
- A measure from minus one to plus one of how closely two returns move together.
- Systematic risk
- Risk common to the whole market that cannot be removed by diversification.
- Diversifiable risk
- Risk unique to a company or project that can be eliminated by holding many assets.
- Efficient frontier
- The set of portfolios with the highest expected return for each level of risk.
- Conglomerate discount
- The tendency of diversified firms to be valued below a portfolio of comparable focused firms.
Practice problems
Work each problem on paper first, then reveal the answer to check.
Two shares each have a standard deviation of 30 per cent and a correlation of 0.4. What is the standard deviation of a 50/50 portfolio?
Show answer
Variance = 0.25 times 0.09 + 0.25 times 0.09 + 2 times 0.25 times 0.4 times 0.09 = 0.063; standard deviation is about 25.1 per cent.
Why would a share with a standard deviation of 45 per cent not necessarily have a higher required return than one with 25 per cent?
Show answer
If most of its risk is unique and it moves little with the market, its systematic risk could be lower, and only systematic risk is rewarded.
Give one situation in which a diversifying acquisition could create value.
Show answer
When the businesses share capabilities or customers, when the combination lowers borrowing costs or uses tax losses, or when it reduces expected costs of financial distress.
Northfield's founding family has 80 per cent of its wealth in the company. How might that affect their view of a risky but positive-NPV project?
Show answer
Because they cannot diversify, they bear the project's unique risk and may reject it even though diversified investors would accept it, an agency issue the board should recognize.
Lesson quiz · 5 questions
Score 60% or more to complete this lesson.
Create a free account to save your progress, take quizzes and earn a certificate.