
MBA-511 · Lesson 5 of 12 · 20 min
Capital budgeting: NPV, IRR and their pitfalls
Daniel Osei has two proposals on his desk at Northfield Components. The first, from the plant engineering team, is a new automated press line costing 14 million dollars that would cut labour and scrap costs by about 3.4 million dollars a year for eight years. The second, from the sales team, is a smaller retooling of the existing line for 6 million dollars that would let Northfield bid for a new family of brackets, adding about 1.9 million dollars a year of after-tax cash flow for six years. The plant floor has space for only one. The engineering team argues that its project has the higher net present value; the sales team points out that its project has the higher internal rate of return and pays back faster. Dr. Varga says that the disagreement is common and that resolving it requires knowing what each rule measures and where each one fails.
Net present value
The net present value of a project is the present value of its expected cash inflows minus the present value of its outflows, discounted at the project's cost of capital. A positive NPV means the project is expected to earn more than investors could earn on other investments of similar risk; in other words, it creates value. The NPV rule is simple: accept projects with a positive NPV and, when projects are mutually exclusive, choose the one with the highest NPV.
NPV has three properties that make it the benchmark against which other rules are judged. It uses cash flows, not accounting profits. It accounts for the timing of every cash flow through discounting. And it is additive: the NPV of two projects together equals the sum of their NPVs, so a firm's value increases by exactly the NPV of the projects it accepts. If Northfield's cost of capital for projects of this kind is 9 per cent, the press line has an NPV of about 4.8 million dollars and the retooling about 2.5 million.
Internal rate of return
The internal rate of return is the discount rate at which a project's NPV equals zero. It is the project's own rate of return, the same idea as a bond's yield to maturity. The IRR rule says to accept a project if its IRR exceeds the cost of capital. For a single conventional project, one with an initial outflow followed only by inflows, the IRR rule and the NPV rule always agree, because NPV falls steadily as the discount rate rises and crosses zero exactly once.
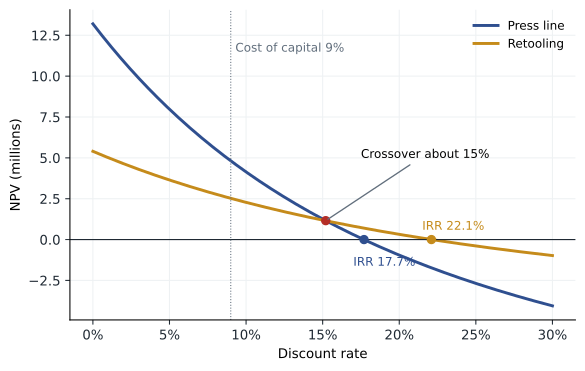
Managers like the IRR because it is a percentage, easy to compare with a hurdle rate or a borrowing rate, and because it does not require choosing a discount rate in advance. The press line has an IRR of about 17.7 per cent and the retooling about 22.1 per cent. Both exceed 9 per cent, so both are acceptable on their own. But the IRR can mislead in several ways, and Daniel's choice is one of them.
Pitfall 1: mutually exclusive projects of different size or timing
When projects are mutually exclusive, the IRR rule can rank them wrongly. The retooling has a higher IRR because it is smaller and its cash flows arrive sooner relative to its cost; a high rate of return on 6 million dollars may add less value than a lower rate on 14 million. The NPV profiles show this directly. At low discount rates, the press line, with its larger and longer cash flows, has the higher NPV. As the discount rate rises, its NPV falls faster, because its benefits are further in the future. The profiles cross at about 15 per cent, the crossover rate. At Northfield's cost of capital of 9 per cent, the press line adds about 2.3 million dollars more value than the retooling, so it is the better choice.
One way to reconcile the rules is to compute the IRR of the difference between the projects, the incremental cash flows from choosing the larger one. If that incremental IRR exceeds the cost of capital, the larger project is better. Here the incremental IRR equals the crossover rate, about 15.2 per cent, which exceeds 9 per cent. The NPV rule gives the same answer more directly.
Pitfall 2: multiple or no IRRs
A project whose cash flows change sign more than once can have more than one IRR, or none. This is not a curiosity. Mines and energy projects often require large reclamation spending at the end of their lives; Owen's company faces exactly this when it must plug and abandon wells. Consider a project that costs 10 million dollars, returns 23 million a year later, and then requires 13.2 million of clean-up in year two. Its NPV is zero at both 10 per cent and 20 per cent, and positive between them. Which IRR should be compared with the cost of capital? Neither tells the full story. The NPV at the cost of capital does.
# NPV, IRR (by bisection), MIRR, payback and a multiple-IRR example (millions)
def npv(rate, cfs):
    return sum(cf / (1 + rate) ** t for t, cf in enumerate(cfs))

def irr(cfs, lo=-0.99, hi=1.0):
    f_lo = npv(lo, cfs)
    for _ in range(200):
        mid = (lo + hi) / 2
        f_mid = npv(mid, cfs)
        if (f_mid > 0) == (f_lo > 0):
            lo, f_lo = mid, f_mid
        else:
            hi = mid
    return (lo + hi) / 2

def mirr(cfs, finance_rate, reinvest_rate):
    n = len(cfs) - 1
    pv_out = sum(-cf / (1 + finance_rate) ** t for t, cf in enumerate(cfs) if cf < 0)
    fv_in = sum(cf * (1 + reinvest_rate) ** (n - t) for t, cf in enumerate(cfs) if cf > 0)
    return (fv_in / pv_out) ** (1 / n) - 1

def payback(cfs):
    total = 0.0
    for t, cf in enumerate(cfs):
        if t > 0 and total + cf >= 0:
            return t - 1 + (-total) / cf
        total += cf
    return None

r = 0.09
press = [-14.0] + [3.4] * 8
retool = [-6.0] + [1.9] * 6
for name, cfs in [("press line", press), ("retooling", retool)]:
    print(f"{name:10s} NPV {npv(r, cfs):5.2f}  IRR {irr(cfs):.1%}  "
          f"MIRR {mirr(cfs, r, r):.1%}  payback {payback(cfs):.1f} years")
diff = [a - b for a, b in zip(press, retool + [0.0, 0.0])]
print(f"incremental IRR (press minus retooling): {irr(diff):.1%}")

clean_up = [-10.0, 23.0, -13.2]
for rate in (0.05, 0.10, 0.15, 0.20, 0.25):
    print(f"clean-up project NPV at {rate:.0%}: {npv(rate, clean_up):6.3f}")
print(f"IRRs found from two starting ranges: {irr(clean_up, 0.0, 0.15):.1%} and {irr(clean_up, 0.15, 0.5):.1%}")press line NPV 4.82 IRR 17.7% MIRR 13.1% payback 4.1 years retooling NPV 2.52 IRR 22.1% MIRR 15.6% payback 3.2 years incremental IRR (press minus retooling): 15.2% clean-up project NPV at 5%: -0.068 clean-up project NPV at 10%: 0.000 clean-up project NPV at 15%: 0.019 clean-up project NPV at 20%: 0.000 clean-up project NPV at 25%: -0.048 IRRs found from two starting ranges: 10.0% and 20.0%
Pitfall 3: the reinvestment assumption and MIRR
The IRR implicitly assumes that cash flows received during the project can be reinvested at the IRR itself. For a project with an IRR of 40 per cent, that is unlikely; the firm's other opportunities probably earn closer to its cost of capital. The modified internal rate of return addresses this. It compounds positive cash flows forward to the end of the project at a reinvestment rate, usually the cost of capital, discounts negative flows back at a financing rate, and finds the single rate that links the two. The MIRR of the retooling at a 9 per cent reinvestment rate is about 15.6 per cent, against about 13.1 per cent for the press line,, a narrower gap than the raw IRRs suggest. The MIRR always has a single value, which solves the multiple-IRR problem, but for choosing between mutually exclusive projects of different size it can still rank them wrongly. NPV remains the reliable guide.
Payback and the profitability index
The payback period is the number of years until a project's cumulative cash flows recover its initial cost. The retooling pays back in about 3.2 years and the press line in about 4.1. Payback is easy to explain and gives a rough sense of how long capital is at risk, which matters to firms that are short of cash or operate in countries with political risk. But it ignores the time value of money within the payback period, it ignores everything after the payback date, and its cut-off is arbitrary. A project that pays back in three years and stops is ranked above one that pays back in four and then earns for twenty. A discounted payback period, using discounted cash flows, fixes the first flaw but not the second.
The profitability index is the present value of future cash flows divided by the initial investment. A project with an index above 1 has a positive NPV. The index is useful when capital is rationed: if a firm can spend only a fixed budget this year, ranking projects by NPV per dollar invested and choosing from the top tends to maximize total NPV within the budget. The press line has an index of about 1.34 and the retooling about 1.42. If Northfield had 20 million dollars and room for both, it would take both; with room for only one, the higher total NPV wins.
| Rule | Press line | Retooling | Main weakness |
|---|---|---|---|
| NPV at 9 per cent | 4.82 million | 2.52 million | Requires a discount rate |
| IRR | 17.7 per cent | 22.1 per cent | Misranks exclusive projects; multiple IRRs |
| MIRR at 9 per cent | 13.1 per cent | 15.6 per cent | Can still misrank by size |
| Payback | 4.1 years | 3.2 years | Ignores timing and later cash flows |
| Profitability index | 1.34 | 1.42 | Misleads for exclusive projects |
Capital budgeting in practice
Surveys of chief financial officers, most famously by John Graham and Campbell Harvey, find that NPV and IRR are the most widely used rules in large companies, with payback still common, especially in smaller firms. Many companies compute all three and use judgment. Dr. Varga's advice is to make the decision on NPV, use IRR and payback to communicate, and spend most of the effort where it matters: on the cash-flow forecasts and the discount rate. A precisely calculated NPV built on optimistic forecasts is worse than useless, because it lends false authority to a bad decision. Lesson 6 turns to estimating cash flows, and lesson 8 to the discount rate.
There is also an organizational lesson. Many firms set hurdle rates well above their cost of capital, perhaps 15 per cent when the cost of capital is 9 per cent, to offset the optimism of project sponsors. That crude fix penalizes long-lived projects most heavily and can lead a firm to underinvest in exactly the strategic projects that build lasting value. Better remedies are to review forecasts independently, to compare them with the results of past projects, and to conduct post-completion audits that hold sponsors accountable for their estimates.
Worked problem
Choosing between the projects
Northfield's board will fund only one of the two projects. Its cost of capital for projects of this risk is 9 per cent. Which should it fund, and how would the answer change if the appropriate discount rate were 16 per cent?
Show solution
- At 9 per cent: NPV of the press line is about 4.82 million dollars and of the retooling about 2.52 million. Choose the press line.
- Find the crossover rate: the incremental IRR, the rate at which the two NPVs are equal, is about 15.2 per cent.
- At 16 per cent, above the crossover: the press line NPV falls to about 0.77 million dollars and the retooling to about 1.00 million.
- Above the crossover rate the ranking flips, because the press line's benefits arrive later and are discounted more heavily.
Answer: At 9 per cent Northfield should fund the press line, which adds about 2.3 million dollars more value than the retooling. If the press line were judged risky enough to need a 16 per cent discount rate, the retooling would be the better choice. The decision therefore depends less on which rule is used than on getting the discount rate right, which is why lesson 8 matters. Daniel should also ask whether the retooling could be done later, since a project that is not chosen now may still be available next year.
Common mistakes
MistakeThe project with the higher IRR always adds more value.
InsteadFor mutually exclusive projects of different size or timing, choose the higher NPV.
MistakeA project has one IRR.
InsteadCash flows that change sign more than once can produce several IRRs or none.
MistakeA short payback means a good project.
InsteadPayback ignores cash flows after the cut-off and the time value of money.
MistakeRaising the hurdle rate is a good way to deal with optimistic forecasts.
InsteadIt penalizes long-lived projects; review the forecasts instead.
Summary and key terms
- NPV is the present value of a project's cash flows minus its cost; accept positive-NPV projects and choose the highest NPV among exclusive ones.
- IRR is the discount rate that makes NPV zero; it agrees with NPV for single conventional projects.
- IRR can misrank exclusive projects, can have multiple values and assumes reinvestment at the IRR.
- MIRR fixes the reinvestment and multiple-IRR problems; payback and the profitability index are useful supplements.
- The quality of the forecasts and the discount rate matters more than the choice of rule.
- Net present value
- The present value of a project's cash inflows minus the present value of its outflows.
- Internal rate of return
- The discount rate at which a project's NPV is zero.
- Crossover rate
- The discount rate at which two projects have equal NPVs.
- Modified internal rate of return
- A rate of return that assumes reinvestment at a stated rate, usually the cost of capital.
- Payback period
- The time needed for cumulative cash flows to recover the initial investment.
- Profitability index
- The present value of future cash flows divided by the initial investment.
Practice problems
Work each problem on paper first, then reveal the answer to check.
A project costs 1 million dollars and returns 400,000 dollars a year for three years. At 8 per cent, what is its NPV?
Show answer
The annuity factor at 8 per cent for 3 years is 2.577, so PV = 1.031 million and NPV = about 31,000 dollars.
Why can the IRR rule and the NPV rule disagree when choosing between two projects?
Show answer
They differ in size or timing, so their NPV profiles cross. At discount rates below the crossover rate, the project with the lower IRR can have the higher NPV.
A firm has a budget of 10 million dollars and four independent projects: A costs 6 million with NPV 2.4; B costs 4 million with NPV 2.0; C costs 5 million with NPV 2.2; D costs 5 million with NPV 1.5. Which should it fund?
Show answer
Profitability indexes (PV / cost) are A 1.40, B 1.50, C 1.44, D 1.30. Combinations within 10 million: A and B give NPV 4.4; B and C give 4.2; C and D give 3.7. Fund A and B.
A project has cash flows of minus 100, plus 230 and minus 132. Why is the IRR rule unhelpful?
Show answer
The cash flows change sign twice, giving two IRRs, 10 and 20 per cent; NPV is positive only between them, so compute NPV at the cost of capital instead.
Lesson quiz · 5 questions
Score 60% or more to complete this lesson.
Create a free account to save your progress, take quizzes and earn a certificate.