
MBA-503 · Lesson 5 of 12 · 19 min
Engagement, wellbeing and the changing workplace
Leo Brandt opens the fifth session with a slide he has clearly shown to his board. Kestrel Analytics ran its first engagement survey last spring, and the headline number, 68 per cent favourable, looked healthy. Six months later, three of his best data engineers resigned within a month of each other, all from the same team. Leo wants to know what the survey missed. Dr. Sato's answer is that surveys rarely miss everything; usually the organization reads them at the wrong level, asks the wrong questions of the data, or does nothing visible afterward. This session is about what engagement is, what the evidence says about it, how work arrangements have changed, and how a leader turns survey data into action.
What engagement is and why it matters
Work engagement has two traditions. Academic researchers, notably Wilmar Schaufeli and Arnold Bakker, define it as a positive, fulfilling state of mind characterized by vigour, dedication and absorption, measured with instruments such as the Utrecht Work Engagement Scale. Gallup, the polling company, defines engaged employees as those who are involved in and enthusiastic about their work and workplace, measured with its twelve-item Q12 survey, which asks about conditions such as knowing what is expected, having the materials and equipment to do the work, receiving recognition and having someone at work who cares about you as a person. The two approaches overlap but are not identical: the academic measure focuses on the person's experience of work, while the Q12 focuses largely on the conditions a manager creates.
Gallup's State of the Global Workplace report published in 2026 found that only 20 per cent of employees worldwide were engaged in 2025, down from 21 per cent the year before. The fall was concentrated among managers, whose engagement dropped from 27 per cent in 2024 to 22 per cent. Gallup estimates that low engagement costs the world economy about 10 trillion dollars in lost productivity, roughly 9 per cent of global GDP, although estimates of this kind depend heavily on assumptions and should be read as an indication of scale rather than a precise figure. Only about a third of employees worldwide rated their lives well enough to be classified as thriving. In the United States, Gallup's 2025 data found 31 per cent of employees engaged and 17 per cent actively disengaged, well below the peak of 36 per cent engaged in 2020. Gallup's region combining the United States and Canada has historically reported some of the highest engagement levels in the world, which says as much about how low engagement is elsewhere as about how high it is in North America.
Why should leaders care? Gallup's own meta-analyses of business units, covering hundreds of thousands of teams, find that units in the top quartile of engagement have substantially higher productivity and profitability and much lower absenteeism, turnover and safety incidents than units in the bottom quartile. Academic studies broadly agree that engagement predicts performance and retention, though with smaller effects than consultancy reports sometimes imply. Two caveats matter. First, much of the evidence is correlational, and the causal arrow can run both ways: successful units are pleasant places to work, which raises engagement. Longitudinal studies suggest that the effect runs in both directions. Second, team-level engagement varies far more within an organization than between organizations, which is why Gallup's estimate that managers account for about 70 per cent of the variance in team engagement, discussed in the first session, is so important. Engagement is mostly a local phenomenon.
Demands, resources and burnout
The job demands-resources model, developed by Evangelia Demerouti, Arnold Bakker and colleagues, is the most widely used framework for understanding both engagement and burnout. Job demands are aspects of work that require sustained effort and therefore carry costs, such as workload, time pressure, emotional demands and role conflict. Job resources are aspects of work that help people achieve goals, reduce the costs of demands or stimulate growth, such as autonomy, social support, feedback, coaching and opportunities to develop. The model proposes two processes. In the health impairment process, high demands without recovery lead to exhaustion and health problems. In the motivational process, resources lead to engagement and performance. Resources also buffer the effect of demands: a heavy workload is far more sustainable when people have control over how they do it and colleagues who help.
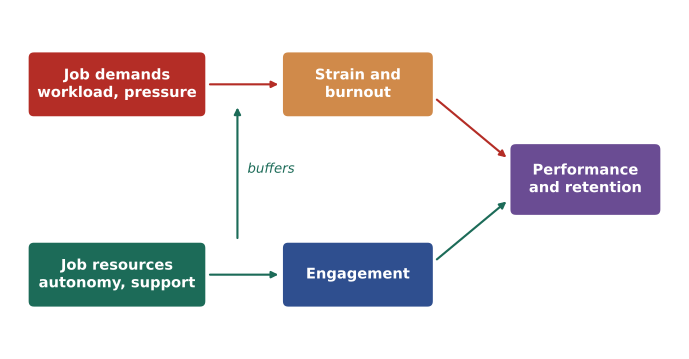
Burnout is the end point of the health impairment process. The World Health Organization's International Classification of Diseases, ICD-11, describes burnout as an occupational phenomenon, not a medical condition, resulting from chronic workplace stress that has not been successfully managed. It has three dimensions: feelings of energy depletion or exhaustion; increased mental distance from the job, including cynicism; and reduced professional efficacy. The definition matters for leaders because it locates the cause in the work rather than in the individual. Programs that offer meditation apps or resilience training while leaving workloads and staffing unchanged treat the symptom rather than the cause. A large study by William Fleming at the University of Oxford, using survey data from over 46,000 workers in the United Kingdom, found that participation in individual-level wellbeing interventions such as mindfulness classes, resilience training and wellbeing apps was generally not associated with better wellbeing, while changes in work conditions are what the broader evidence supports.
Hana recognizes all three dimensions in her emergency department. The nurses who left described exhaustion, a growing sense that they were processing patients rather than caring for them, and a feeling that nothing they did made a difference. In the language of the model, demands had risen sharply while resources had fallen: senior nurses who used to mentor new staff had left, schedules had become less predictable, and charge nurses had no time for debriefs after difficult cases. The model points her toward restoring resources, which is cheaper and more within her control than reducing patient volume.
Work arrangements after the pandemic
Where people work has changed permanently for many occupations. Statistics Canada's Labour Force Survey found that in May 2025 about 17.4 per cent of Canadian employees worked most of their hours from home, 5.1 per cent had hybrid arrangements and 77.6 per cent worked mostly on site. Remote and hybrid work are concentrated in professional, financial, scientific and public administration roles, while most jobs in health care, retail, manufacturing and hospitality remain on site, which means that a single organization may have two very different employee experiences.
The best evidence on hybrid work comes from a randomized experiment. Nicholas Bloom, Ruobing Han and James Liang studied 1,612 graduate employees at Trip.com, a large travel company, who were randomly assigned to work from home two days a week or to work fully in the office. The results, published in Nature in 2024, showed that hybrid work cut quit rates by about a third, with the largest reductions among women, non-managers and employees with long commutes, while performance reviews and promotions over the following two years were unaffected. Fully remote work has more mixed evidence: some studies find productivity gains for focused individual tasks, while others find costs in mentoring, innovation and the development of junior staff, who learn a great deal by watching and asking colleagues informally.
For leaders, the practical lessons are about coordination rather than location. Teams need agreed anchor days if in-person time is meant for collaboration, because hybrid schedules chosen individually often lead people to commute to the office only to spend the day on video calls. Managers need to be deliberate about visibility, because research on proximity bias suggests that people seen more often may be rated more favourably. Junior employees need structured access to experienced colleagues. And everyone needs clarity about response expectations, because flexible work can blur into always-on work.
Disconnecting and predictable schedules
Ontario was the first Canadian province to legislate on this issue. Under the Working for Workers Act, 2021, employers with 25 or more employees in Ontario have had to maintain a written policy on disconnecting from work since June 2022, setting out expectations about emails, calls and messages outside working hours. The law requires a policy rather than creating a new right to ignore messages, but it forces organizations to make expectations explicit, which is often the real problem. Other jurisdictions, including France and Australia, have gone further by giving employees a right to disconnect in many circumstances.
Whatever the legal position, leaders shape expectations directly. Research on after-hours email by William Becker and colleagues found that the expectation of monitoring email outside working hours, not just the time actually spent on it, was associated with anxiety and lower relationship satisfaction for employees and their partners. A manager who sends messages at eleven at night signals urgency even when none is intended. Simple norms, such as scheduling messages to send in the morning and stating that replies are not expected outside working hours except in defined emergencies, cost nothing and reduce strain.
Turning survey data into action
An engagement survey is only useful if it leads to visible change, and research on employee surveys consistently finds that conducting a survey and then doing nothing is worse than not surveying at all, because it teaches people that their views are ignored. Dr. Sato suggests a disciplined analysis. First, report results at the team level where samples permit, typically with a minimum of five or so respondents to protect anonymity, because organization-wide averages hide the variation that matters. Second, look at distributions, not just averages, because a team where half the people are delighted and half are miserable has a different problem from one where everyone is lukewarm. Third, examine which items move together, because correlations among items can reveal underlying issues. Fourth, ask teams to interpret their own results and choose one or two actions, rather than imposing a corporate action plan.
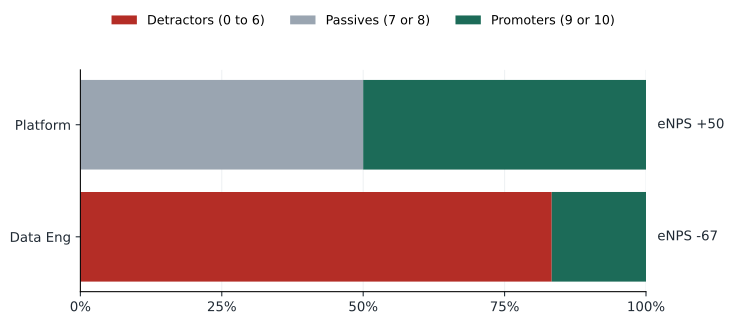
One popular metric is the employee net promoter score, or eNPS, adapted from a customer loyalty measure. People answer how likely they are to recommend the organization as a place to work on a scale from 0 to 10. Scores of 9 or 10 are promoters, 7 or 8 are passives and 0 to 6 are detractors. The eNPS is the percentage of promoters minus the percentage of detractors, so it ranges from minus 100 to plus 100. It is simple and easy to track, but a single item cannot tell you what to fix, and its cut-offs are arbitrary. It works best alongside more specific items.
# Team-level engagement analysis: means, eNPS and item correlations
from statistics import mean, correlation

items = ["know_expected", "tools", "recognition", "manager_cares", "growth"]
# Each row: five items on a 1-5 scale, then likelihood to recommend 0-10
teams = {
    "Platform": [(5,4,4,5,4,9),(4,4,3,4,4,8),(5,5,4,5,5,10),(4,3,4,4,3,7),
                 (5,4,5,5,4,9),(4,4,4,4,4,8)],
    "Data Eng": [(3,4,2,2,2,5),(4,4,2,3,2,6),(3,5,1,2,1,3),(4,4,3,3,2,6),
                 (3,4,2,2,2,4),(5,5,4,4,4,9)],
}

def enps(scores):
    pro = sum(s >= 9 for s in scores)
    det = sum(s <= 6 for s in scores)
    return round(100 * (pro - det) / len(scores))

for team, rows in teams.items():
    cols = list(zip(*rows))
    means = "  ".join(f"{name[:6]}={mean(col):.1f}" for name, col in zip(items, cols))
    fav_share = sum(r[0] + r[1] + r[2] + r[3] + r[4] >= 20 for r in rows) / len(rows)
    print(f"{team:<9} {means}  eNPS={enps(cols[5]):+d}  fav={fav_share:.0%}")

# Which items move with recommendation across all respondents?
allrows = [r for rows in teams.values() for r in rows]
cols = list(zip(*allrows))
print("Correlation with likelihood to recommend:")
for name, col in zip(items, cols):
print(f" {name:<14} r = {correlation(col, cols[5]):+.2f}")Platform know_e=4.5 tools=4.0 recogn=4.0 manage=4.5 growth=4.0 eNPS=+50 fav=67% Data Eng know_e=3.7 tools=4.3 recogn=2.3 manage=2.7 growth=2.2 eNPS=-67 fav=17% Correlation with likelihood to recommend: know_expected r = +0.93 tools r = +0.07 recognition r = +0.89 manager_cares r = +0.95 growth r = +0.96
The output shows why Leo's company-wide figure misled him. The Platform team is enthusiastic. The Data Engineering team, the one that lost three people, scores well on having the right tools and reasonably on knowing what is expected, but poorly on recognition, feeling that the manager cares and growth, and its eNPS is strongly negative. Across respondents, willingness to recommend moves closely with growth, the manager's care, clear expectations and recognition, and hardly at all with tools. With only twelve respondents the correlations are illustrative rather than reliable, but they point to the same place as the exit interviews: the team's manager, a brilliant engineer promoted the year before, had never been taught to give recognition or hold development conversations.
Worked problem
Choosing actions from survey results
Leo has the team-level results above. He has budget for one company-wide initiative and wants to know what to do about Data Engineering.
Show solution
- Do not average the teams: the problem is local, so the response must be local.
- Share the team's results with its members and ask them, in a facilitated session without the manager present for the first half, what lies behind the low recognition and growth scores.
- Support the manager rather than replacing them immediately: pair them with an experienced engineering manager as a coach and schedule monthly one-to-ones with each engineer focused on development.
- Use the company-wide budget for manager training on recognition and development conversations, since the correlations suggest these drive recommendation across teams.
- Commit to a short pulse survey in three months on the same items, and report back what changed.
Answer: Local, team-owned action on recognition and growth, backed by manager coaching and training, with a visible follow-up measurement.
Common mistakes
MistakeA healthy organization-wide engagement score means there is no problem.
InsteadEngagement varies mainly between teams within an organization, so averages can hide teams in serious trouble.
MistakeBurnout is a personal resilience problem to be solved with wellbeing apps.
InsteadBurnout arises from chronic work stress; the evidence favours changing demands and resources over individual-level programs alone.
MistakeRunning an engagement survey is a good thing in itself.
InsteadSurveying without visible follow-up teaches people that their views are ignored and can lower engagement further.
Summary and key terms
- Engagement can be defined as a state of vigour, dedication and absorption, or, in Gallup's approach, through the conditions managers create; both predict performance and retention.
- Gallup found 20 per cent of employees engaged worldwide in 2025 and a sharp fall in manager engagement; US engagement was 31 per cent.
- The job demands-resources model explains burnout through demands without recovery and engagement through resources, with resources buffering demands.
- Randomized evidence shows that hybrid work can cut quits without hurting performance, but it requires deliberate coordination and attention to junior staff.
- Survey data should be analysed at team level, through distributions and item relationships, and must be followed by visible, team-owned action.
- Work engagement
- A positive work-related state of vigour, dedication and absorption.
- Job demands
- Aspects of work requiring sustained effort, such as workload and emotional demands.
- Job resources
- Aspects of work that help achieve goals, reduce strain or support growth.
- Burnout
- An occupational phenomenon of exhaustion, mental distance and reduced efficacy from unmanaged chronic work stress.
- eNPS
- Percentage of promoters minus percentage of detractors on a 0 to 10 recommendation question.
- Proximity bias
- The tendency to favour people who are physically present more often.
Practice problems
Work each problem on paper first, then reveal the answer to check.
In a team of 20, eight people answer 9 or 10, seven answer 7 or 8 and five answer 6 or below. What is the eNPS?
Show answer
Promoters are 40 per cent and detractors 25 per cent, so eNPS = 40 - 25 = +15.
A manager has a team with heavy workloads that cannot be reduced this year. What does the job demands-resources model suggest?
Show answer
Increase resources that buffer demands: more control over how and when work is done, peer support, coaching, feedback and recovery time, so that the demands are less likely to lead to exhaustion.
Why might individually chosen hybrid schedules reduce the value of office days?
Show answer
If team members choose different days, people commute to the office but find their collaborators absent, so they spend the day on video calls; agreed anchor days align in-person time with collaboration.
Lesson quiz · 5 questions
Score 60% or more to complete this lesson.
Create a free account to save your progress, take quizzes and earn a certificate.