
MBA-501 · Lesson 7 of 12 · 21 min
DuPont analysis and return on invested capital
Return on equity is the single number shareholders care about most, but on its own it hides more than it shows. Two companies can earn the same return on equity in completely different ways: one with high margins and little debt, another with thin margins, fast-turning assets and heavy borrowing. DuPont analysis, developed by the chemical company's finance staff in the 1910s, breaks return on equity into its drivers. Return on invested capital goes further, separating the performance of the operations from the way they are financed. Together they are the core tools for understanding how a business creates value.
The three-step DuPont identity
The identity multiplies three ratios whose intermediate terms cancel out. Net margin measures how much profit each dollar of sales generates. Asset turnover measures how many dollars of sales each dollar of assets generates. The equity multiplier, assets divided by equity, measures financial leverage: how many dollars of assets each dollar of equity supports.
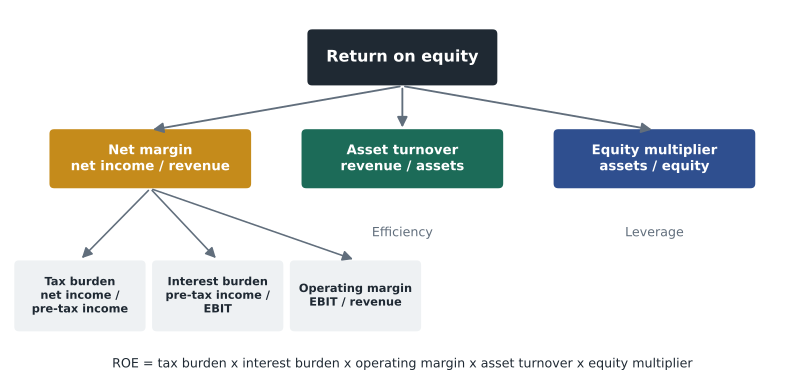
The decomposition tells a manager where to look. A falling return on equity caused by a lower margin points to pricing, costs or mix. One caused by lower turnover points to idle capacity, excess inventory or slow collections. One caused by lower leverage may simply reflect a decision to repay debt, which reduces risk as well as return. Owen pointed out that the third lever is the cheapest to pull: borrowing more raises return on equity immediately, as long as the business earns more on its assets than the debt costs, but it also raises the risk that a bad year wipes out the equity.
The five-step version
The five-step version splits net margin into three parts. The tax burden is net income divided by pre-tax income, showing how much profit survives taxes. The interest burden is pre-tax income divided by operating profit (EBIT), showing how much survives interest. Operating margin is EBIT divided by revenue. Multiplying these with asset turnover and the equity multiplier gives return on equity again.
The five-step version separates the effects of operations, financing and tax. Leverage appears twice: it raises the equity multiplier but lowers the interest burden. A company that borrows heavily at high interest rates may see the two effects nearly cancel.
# DuPont analysis, three and five steps, for three companies (millions of dollars)
data = {
    #             revenue  EBIT    interest  tax    avg assets  avg equity
    "Northfield": (214.0,  11.8,   2.6,     2.4,   110.8,      50.3),
    "Fairway":    (3150.0, 173.0,  31.0,    37.0,  1880.0,     640.0),
    "Prairie R.": (1420.0, 248.0,  88.0,    40.0,  4300.0,     1720.0),
}
for name, (rev, ebit, intr, tax, assets, equity) in data.items():
    ebt = ebit - intr
    ni = ebt - tax
    margin, turnover, multiplier = ni / rev, rev / assets, assets / equity
    tax_burden, int_burden, op_margin = ni / ebt, ebt / ebit, ebit / rev
    roe = margin * turnover * multiplier
    print(f"{name:<11} ROE {roe:6.1%} = margin {margin:5.1%} x turnover {turnover:4.2f} x multiplier {multiplier:4.2f}")
    print(f"{'':<11} 5-step: tax {tax_burden:4.2f} x interest {int_burden:4.2f} x op margin {op_margin:5.1%}"
f" x turnover {turnover:4.2f} x multiplier {multiplier:4.2f}")Northfield ROE 13.5% = margin 3.2% x turnover 1.93 x multiplier 2.20
5-step: tax 0.74 x interest 0.78 x op margin 5.5% x turnover 1.93 x multiplier 2.20
Fairway ROE 16.4% = margin 3.3% x turnover 1.68 x multiplier 2.94
5-step: tax 0.74 x interest 0.82 x op margin 5.5% x turnover 1.68 x multiplier 2.94
Prairie R. ROE 7.0% = margin 8.5% x turnover 0.33 x multiplier 2.50
5-step: tax 0.75 x interest 0.65 x op margin 17.5% x turnover 0.33 x multiplier 2.50The three companies earn returns on equity of roughly 14 %, 16 % and 7 %, but by different routes. Fairway's net margin is only about 3.3 %, yet it turns its assets over 1.7 times and uses moderate leverage. Prairie Ridge earns a net margin above 8 % but turns its huge asset base over only a third of a time a year. Northfield sits in between. A manager at each firm would look at a different lever first.
Why return on equity is not enough
Return on equity mixes operating performance with financing decisions. A company can raise it by borrowing to buy back shares without improving its operations at all, and it can be distorted when equity is small or negative after years of buybacks or losses. Return on assets avoids leverage in the denominator but still uses net income, which is after interest, and it includes non-operating assets such as excess cash. For judging how well the operations themselves perform, analysts prefer return on invested capital.
Return on invested capital
Return on invested capital (ROIC) relates the after-tax operating profit of the business to the capital invested in its operations. The numerator is net operating profit after tax (NOPAT): operating profit, or EBIT, multiplied by one minus the tax rate, as if the company had no debt. The denominator is invested capital: the operating assets the business needs, net of operating liabilities. It can be calculated from the asset side, as operating working capital plus net property, plant and equipment, intangible assets and goodwill, or from the financing side, as debt plus leases plus equity minus excess cash and non-operating investments. Both routes should give the same answer.
ROIC is independent of how the business is financed, which makes it the best single measure of operating performance and a key input to valuation. When it exceeds the cost of capital, the weighted average return investors require, growth creates value; when it falls short, growth destroys value, because each new dollar invested earns less than investors could get elsewhere at similar risk. The difference between ROIC and the cost of capital, multiplied by invested capital, is economic profit, sometimes sold under the trademark EVA.
# ROIC and economic profit, calculated from both sides (millions of dollars)
ebit, tax_rate = 11.8, 0.26
nopat = ebit * (1 - tax_rate)
# operating side
receivables, inventory, payables, accrued = 18.4, 21.5, 14.1, 3.9
net_ppe, intangibles = 62.3, 1.8
oper_wc = receivables + inventory - payables - accrued
ic_operating = oper_wc + net_ppe + intangibles
# financing side
debt, leases, equity, excess_cash = 38.6, 2.5, 52.7, 0.0
ic_financing = debt + leases + equity - excess_cash
print("NOPAT:", round(nopat, 2))
print("Invested capital, operating side:", round(ic_operating, 1), " financing side:", round(ic_financing, 1))
roic = nopat / ic_operating
for wacc in (0.08, 0.09, 0.10):
    ep = (roic - wacc) * ic_operating
print(f"ROIC {roic:5.1%} WACC {wacc:4.0%} economic profit {ep:6.2f}")NOPAT: 8.73 Invested capital, operating side: 86.0 financing side: 93.8 ROIC 10.2% WACC 8% economic profit 1.85 ROIC 10.2% WACC 9% economic profit 0.99 ROIC 10.2% WACC 10% economic profit 0.13
The two sides of invested capital do not quite match here (86.0 million on the operating side against 93.8 million on the financing side), mainly because cash and a few small items such as income tax balances sit on one side but not the other. In practice analysts reconcile them carefully. Northfield's ROIC of about 10.2 % is only slightly above its cost of capital, so economic profit is small: about 1.9 million at an 8 % WACC and close to zero at 10 %. Daniel took the uncomfortable message to the owners: the company is profitable but barely covering the return its capital requires, and growth that needs more plant and working capital will not create value unless margins or turnover improve.
The drivers of ROIC
ROIC itself decomposes into an after-tax operating margin and a capital turnover, revenue divided by invested capital. This links ROIC directly to managers' daily choices. Pricing, product mix, purchasing and productivity drive the margin. Plant utilization, inventory, collections and supplier terms drive the turnover. A value-driver tree maps each operating measure, such as scrap rate, utilization, days sales outstanding or revenue per employee, onto ROIC, so that teams can see how their work affects value.
| Lever | Affects | Northfield example |
|---|---|---|
| Price and mix | Operating margin | Exit low-margin legacy parts; price tooling separately |
| Material and conversion cost | Operating margin | Reduce scrap from 3.8 % to 2.5 % of steel used |
| Overhead | Operating margin | Consolidate two warehouses |
| Fixed asset utilization | Capital turnover | Add a second shift on existing presses instead of buying a new one |
| Inventory | Capital turnover | Vendor-managed steel, smaller batches |
| Receivables and payables | Capital turnover | Enforce 45-day terms; align supplier terms with customer terms |
Adjustments and comparability
Like every ratio, ROIC depends on definitions. Analysts commonly add capitalized operating leases to invested capital (now largely automatic under the lease standards), exclude excess cash and non-operating investments, decide whether to include goodwill (including it measures returns on the price paid for acquisitions; excluding it measures returns on the underlying operations), and sometimes capitalize research and development or marketing spending that builds long-lived assets. For a company like Kestrel, which expenses most of its investment in software and customers, conventional ROIC can look either terrible (in the early years) or spectacular (once the expensed investments pay off), and capitalizing research and development gives a more sensible picture.
For Lakeview Health, a not-for-profit, the same logic applies with a different purpose. The hospital does not need to earn a return for shareholders, but it does need to cover the cost of replacing its buildings and equipment and to fund growth in services. Hana calculated an operating margin and an asset turnover for each clinic to identify which services consumed the most capital per patient visit.
Using ROIC to set targets
Return on invested capital becomes useful to operating managers when it is broken into measures they control. A plant manager cannot move ROIC directly, but can affect the operating margin through yield, scrap and labour efficiency, and the capital side through inventory levels, equipment utilization and the speed of collecting from customers. A value driver tree links each of these to ROIC, so that a target such as reducing inventory by ten days can be translated into its effect on invested capital and economic profit. This turns a corporate financial goal into something a team on the shop floor can act on.
Companies that adopt economic profit or EVA as a performance measure usually make a few adjustments to accounting numbers before calculating it. Research and development and some marketing spending may be capitalized and amortized, because they create long-lived assets that the accounts expense immediately. Goodwill may be added back to invested capital so that managers are charged for the full price of acquisitions. Restructuring charges may be spread over several years so that a necessary decision is not penalized in a single year. Each adjustment has a rationale, but too many make the measure hard to understand, and most firms that use the approach settle on a small number.
Dr. Achterberg ends the discussion with a warning about time horizons. ROIC can be raised in the short term by cutting investment, because invested capital falls while profit holds up for a while. A manager rewarded only on this year's ROIC may starve the business of the maintenance and growth spending it needs. Good targets pair ROIC with growth, with investment plans approved in advance, or with multi-year measurement periods.
Worked problem
Explaining a change in ROE
A retailer's return on equity rose from 12 % to 15 % in a year. Net margin fell from 3.0 % to 2.8 %, asset turnover was unchanged at 2.0, and the equity multiplier rose from 2.0 to 2.7. What happened?
Show solution
- Check the identity: 3.0 % × 2.0 × 2.0 = 12 %; 2.8 % × 2.0 × 2.7 ≈ 15 %.
- Operations did not improve: margin fell slightly and turnover was flat.
- The entire increase came from leverage, probably from borrowing to buy back shares or pay a special dividend.
- Return on invested capital, which ignores financing, would have fallen slightly. Shareholders now earn more, but with more risk.
Answer: The higher return on equity reflects more debt, not better operations. ROIC and the interest burden reveal the real story.
Common mistakes
MistakeA higher return on equity always means the business is performing better.
InsteadIt may reflect more leverage or a shrinking equity base rather than better operations.
MistakeNOPAT is net income.
InsteadNOPAT is operating profit after tax, calculated as if the company had no debt.
MistakeInvested capital equals total assets.
InsteadIt is operating assets net of operating liabilities such as payables, excluding excess cash.
MistakeGrowth always creates value.
InsteadGrowth creates value only when ROIC exceeds the cost of capital.
MistakeLeverage is free return.
InsteadDebt raises return on equity only while returns exceed its cost, and it raises the risk of losses.
Summary and key terms
- The three-step DuPont identity splits ROE into net margin, asset turnover and the equity multiplier.
- The five-step version splits margin into tax burden, interest burden and operating margin.
- ROE mixes operating performance with financing; ROIC isolates the operations.
- ROIC equals NOPAT divided by invested capital, which can be measured from the operating or financing side.
- Economic profit equals the spread between ROIC and the cost of capital, times invested capital.
- ROIC decomposes into after-tax operating margin and capital turnover, linking value to operating levers.
- Definitions matter: treatment of leases, excess cash, goodwill and expensed investments changes ROIC.
- DuPont analysis
- Decomposing return on equity into margin, turnover and leverage.
- Equity multiplier
- Average assets divided by average equity.
- Tax burden
- Net income divided by pre-tax income.
- Interest burden
- Pre-tax income divided by operating profit.
- NOPAT
- Net operating profit after tax: EBIT times one minus the tax rate.
- Invested capital
- The capital tied up in operations, net of operating liabilities.
- ROIC
- Return on invested capital: NOPAT divided by invested capital.
- Cost of capital
- The return investors require for the risk of the business, often measured as WACC.
- Economic profit
- The return earned above the cost of capital, in dollars.
- Value-driver tree
- A map linking operating measures to ROIC and value.
Practice problems
Work each problem on paper first, then reveal the answer to check.
Net margin 5 %, asset turnover 1.6, equity multiplier 2.5. What is ROE?
Show answer
20 %.
EBIT 40, tax rate 25 %, invested capital 250. What are NOPAT and ROIC?
Show answer
NOPAT 30; ROIC 12 %.
ROIC 12 %, WACC 9 %, invested capital 250. What is economic profit?
Show answer
7.5 million.
A company's interest burden falls from 0.95 to 0.80 while its equity multiplier rises. What happened?
Show answer
It borrowed more; interest takes a bigger share of operating profit while leverage magnifies returns.
Name two operating levers that improve capital turnover.
Show answer
Higher plant utilization, lower inventory, faster collections, longer supplier terms.
Portfolio task: build a three-step DuPont analysis for two competitors and explain the difference in their ROE.
Show answer
Answers vary.
Lesson quiz · 5 questions
Score 60% or more to complete this lesson.
Create a free account to save your progress, take quizzes and earn a certificate.