
MBA-501 · Lesson 6 of 12 · 22 min
Ratio analysis: profitability, efficiency, liquidity and solvency
A single number from a financial statement means little on its own. Revenue of 214 million dollars could be excellent for one company and disastrous for another. Ratios relate numbers to each other, so that a company can be compared with its own past, with competitors and with expectations. This lesson organizes the main ratios into four families, profitability, efficiency, liquidity and solvency, shows how to calculate them consistently, and explains the traps that make ratio analysis misleading when it is done mechanically.
Why ratios, and compared with what
Ratios answer questions such as: how much profit does each dollar of sales produce, how hard are the assets working, can the company pay its bills next month, and could it survive a bad year? A ratio becomes meaningful only against a benchmark. Time-series analysis compares a company with itself over several years, revealing trends. Cross-sectional analysis compares it with peers in the same industry at the same time. Targets, budgets and loan covenants provide a third benchmark. Dr. Achterberg insists that the cohort always state the comparison: "A current ratio of 1.3 is neither good nor bad. It is good for a grocer and alarming for a builder of custom machines."
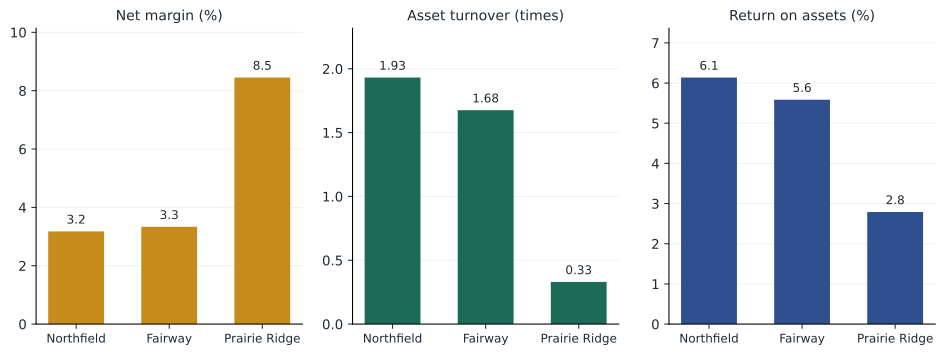
Industry matters because business models differ. Fairway Grocers earns thin margins but turns its assets over quickly. Prairie Ridge Energy earns higher margins on enormous, slow-turning assets. Kestrel Analytics has high gross margins, little debt and no inventory. Comparing their ratios directly tells you more about grocery, energy and software than about management. Within an industry, however, ratios expose genuine differences in strategy and execution.
Profitability ratios
Margins express profit as a share of revenue at different levels of the income statement. Gross margin reflects pricing and production cost; operating margin adds overhead; net margin includes financing and taxes. Returns relate profit to the capital invested. Return on assets (ROA) uses net income, or sometimes operating profit after tax, divided by average total assets. Return on equity (ROE) divides net income by average shareholders' equity and measures the return to owners. Return on invested capital (ROIC), covered in the next lesson, measures the return on the capital provided by both lenders and owners to run the operations.
| Ratio | Formula | What it shows |
|---|---|---|
| Gross margin | Gross profit / revenue | Pricing power and production cost |
| Operating margin | Operating profit / revenue | Profitability of operations before financing |
| Net margin | Net income / revenue | Profit after all costs |
| Return on assets | Net income / average total assets | Profit generated by the asset base |
| Return on equity | Net income / average equity | Return to shareholders |
| EBITDA margin | EBITDA / revenue | Operating cash generation before capital spending |
Efficiency ratios
Efficiency, or activity, ratios measure how well the business uses its assets. Asset turnover is revenue divided by average total assets: how many dollars of sales each dollar of assets supports. Inventory turnover is cost of goods sold divided by average inventory, and its inverse in days is the days inventory outstanding met in Lesson 4. Receivables turnover is revenue divided by average receivables, with days sales outstanding as its inverse. Payables turnover uses purchases or cost of goods sold divided by average payables. Fixed asset turnover, revenue divided by net property, plant and equipment, is useful for capital-intensive businesses like Northfield, where the question is whether the plant is busy enough.
Efficiency ratios are where operations managers can make the biggest difference to financial performance. When Northfield improved its press changeover times, it could run smaller batches, carry less inventory and win short-run orders, which raised inventory turnover and fixed asset turnover together. Daniel showed the cohort that each additional turn of inventory released about 4 million dollars of cash.
Liquidity ratios
Liquidity ratios ask whether the business can meet its short-term obligations. The current ratio divides current assets by current liabilities; the quick ratio, or acid test, excludes inventory and prepaid expenses, which may be hard to turn into cash quickly; and the cash ratio counts only cash and short-term investments. Lenders often set minimum current ratios in loan covenants. But liquidity ratios are snapshots, and they can be dressed up at year-end, for example by delaying purchases or paying down payables just before the balance sheet date.
Operating cash flow relative to current liabilities is a useful complement because it measures the flow that pays bills, not just the stock of assets. Fairway's current ratio is below 1, which would be worrying in most industries, but its strong, steady operating cash flow and fast inventory turnover make it perfectly able to pay suppliers.
Solvency and coverage ratios
Solvency ratios measure long-term financial risk. Debt to equity compares borrowings with shareholders' equity; debt to capital divides debt by debt plus equity; and net debt to EBITDA, the measure lenders and rating agencies use most, estimates how many years of operating cash generation would be needed to repay borrowings. Coverage ratios relate earnings to fixed charges: interest coverage divides operating profit (EBIT) by interest expense, and fixed charge coverage includes lease payments. A company with high debt but very stable cash flows, like a regulated utility, can carry more leverage than a cyclical manufacturer.
| Ratio | Formula | Typical concern |
|---|---|---|
| Current ratio | Current assets / current liabilities | Below about 1.0 to 1.2 in most non-retail industries |
| Quick ratio | (Cash + investments + receivables) / current liabilities | Low values when inventory is slow-moving |
| Debt to equity | Total debt / equity | High values for cyclical or early-stage firms |
| Net debt to EBITDA | (Debt - cash) / EBITDA | Above about 3 to 4 times for many industrial borrowers |
| Interest coverage | EBIT / interest expense | Below about 3 times raises refinancing risk |
Calculating ratios consistently
Ratio analysis is easy to automate and easy to get wrong. Use averages of opening and closing balances when relating a flow (revenue, profit) to a stock (assets, equity, inventory), because the balance sheet at year-end may not represent the year. Be consistent about definitions: does debt include leases, is EBITDA before or after one-time items, is ROA based on net income or operating profit? Annualize quarterly flows before dividing by balance sheet items. And keep the numbers in the same currency and units.
# Ratio calculator for one year (millions of dollars); averages use opening and closing balances
inc = {"revenue": 214.0, "cogs": 173.3, "opex": 28.9, "interest": 2.6, "tax": 2.4, "dep": 7.9}
bs_open = {"cash": 4.1, "receivables": 12.8, "inventory": 17.7, "ppe": 61.6,
           "payables": 12.9, "debt": 34.0, "equity": 47.9}
bs_close = {"cash": 3.2, "receivables": 18.4, "inventory": 21.5, "ppe": 62.3,
            "payables": 14.1, "debt": 38.6, "equity": 52.7}
avg = {k: (bs_open[k] + bs_close[k]) / 2 for k in bs_open}
assets_avg = avg["cash"] + avg["receivables"] + avg["inventory"] + avg["ppe"]
gross = inc["revenue"] - inc["cogs"]
ebit = gross - inc["opex"]
net = ebit - inc["interest"] - inc["tax"]
ratios = {
    "gross margin": gross / inc["revenue"],
    "operating margin": ebit / inc["revenue"],
    "net margin": net / inc["revenue"],
    "return on assets": net / assets_avg,
    "return on equity": net / avg["equity"],
    "asset turnover (x)": inc["revenue"] / assets_avg,
    "inventory turnover (x)": inc["cogs"] / avg["inventory"],
    "current ratio (x)": (bs_close["cash"] + bs_close["receivables"] + bs_close["inventory"]) / bs_close["payables"],
    "debt to equity (x)": bs_close["debt"] / bs_close["equity"],
    "net debt / EBITDA (x)": (bs_close["debt"] - bs_close["cash"]) / (ebit + inc["dep"]),
    "interest coverage (x)": ebit / inc["interest"],
}
for k, v in ratios.items():
print(f"{k:<24}" + (f"{v:8.2f}" if "(x)" in k else f"{v:8.1%}"))gross margin 19.0% operating margin 5.5% net margin 3.2% return on assets 6.7% return on equity 13.5% asset turnover (x) 2.12 inventory turnover (x) 8.84 current ratio (x) 3.06 debt to equity (x) 0.73 net debt / EBITDA (x) 1.80 interest coverage (x) 4.54
For simplicity the code treats payables as Northfield's only current liability; in practice the current portion of debt, accrued wages and other items would be included, so the real current ratio is lower. The output gives Northfield a picture lenders would recognize: an operating margin of about 5.5 %, a return on equity of about 14 %, inventory turning about nine times a year, net debt of about 1.8 times EBITDA and interest covered about 4.5 times. Nothing alarming, but Daniel's board will want to know why inventory turnover fell from ten times the year before.
Pitfalls in ratio analysis
Several traps catch careless analysts. Accounting differences, such as LIFO versus FIFO, lease treatment or capitalized development costs, can change ratios without any economic difference. Seasonality means a year-end balance sheet may show unusually low inventory for a retailer whose year ends after the holidays. Window dressing can flatter liquidity at the reporting date. Acquisitions part-way through the year make averages misleading. And ratios that combine two numbers can move for either reason: a rising current ratio may mean more cash, or it may mean inventory piling up.
A deeper trap is treating a ratio as a target rather than a symptom. If managers are rewarded for return on assets, they may avoid sensible investments or keep fully depreciated equipment running past its economic life. If they are rewarded for inventory turnover, they may push stock back to suppliers or cause shortages. Ratios are diagnostic tools; the useful question is always what operating decisions lie behind them.
From ratios to a story
Good analysis turns ratios into a coherent explanation. Start with the overall return, decompose it into margin and turnover (Lesson 7 formalizes this), identify which components changed, and then look for the operating causes in the MD&A, segment notes and industry data. Finally, check whether the story is consistent with cash flow: improving margins that never show up as operating cash flow deserve suspicion.
Grace used this approach on Fairway. Return on assets had slipped from 6.4 % to 5.5 % over three years. Gross margin was stable, but operating expenses had risen faster than sales because of higher wages and new delivery services, and asset turnover had fallen because the company had opened six large stores whose sales were still ramping up. The story was not that Fairway was mismanaged, but that it was investing in growth that had not yet paid off, and the question for the board was how long to wait.
Ratios in loan agreements
Ratios are not only analytical tools; they are written into contracts. Most bank loans and bond agreements contain financial covenants, such as a maximum ratio of debt to EBITDA, a minimum interest or fixed-charge coverage ratio, or a minimum level of tangible net worth. A breach usually gives the lender the right to demand repayment, which in practice means renegotiating the loan on worse terms. Managers therefore need to know how each covenant is defined, because the contract definition often differs from the textbook one: EBITDA may be adjusted for specified one-time items, leases may be included or excluded, and the test may be performed on a trailing twelve-month basis at each quarter end.
Daniel Osei tracks Northfield's covenant headroom every month, not just at quarter ends. When a large customer delayed an order, his forecast showed debt to EBITDA rising from 2.6 to 3.3 times against a covenant limit of 3.5. The early warning allowed the company to defer a planned equipment purchase and to talk to the bank before the test date, which is a far stronger position than explaining a breach after the fact.
Worked problem
Interpreting liquidity
A machinery maker reports a current ratio that rose from 1.6 to 2.1 and a quick ratio that fell from 0.9 to 0.7. Sales were flat. What is the most likely explanation, and is the company more liquid?
Show solution
- The current ratio includes inventory; the quick ratio excludes it.
- A rising current ratio with a falling quick ratio means inventory has grown while cash and receivables have not.
- With flat sales, the extra inventory may be unsold machines or slow-moving parts.
- The company is probably less liquid in practice: more of its current assets are tied up in inventory that may be hard to sell.
Answer: The improving current ratio is misleading; inventory build-up has made the company less liquid. Check inventory ageing and production plans.
Common mistakes
MistakeA higher current ratio always means a safer company.
InsteadIt can reflect slow-moving inventory or uncollected receivables; check the quick ratio and cash flow.
MistakeRatios can be compared across any industries.
InsteadBusiness models produce very different typical ratios; compare with peers and with the company's own history.
MistakeYear-end balances are the best denominators.
InsteadUse averages for ratios that combine flows and balances, and watch for seasonality.
MistakeA high return on equity proves good management.
InsteadHigh leverage or past buybacks can inflate ROE; examine margin, turnover and leverage separately.
MistakeRatios are targets to be maximized.
InsteadThey are symptoms; managing them directly can encourage harmful decisions.
Summary and key terms
- Ratios relate statement items to each other and are meaningful only against a benchmark: history, peers or targets.
- Profitability ratios include margins and returns on assets, equity and invested capital.
- Efficiency ratios measure how intensively assets are used, such as asset, inventory and receivables turnover.
- Liquidity ratios measure short-term solvency; operating cash flow complements the balance sheet snapshot.
- Solvency and coverage ratios such as net debt to EBITDA and interest coverage measure long-term financial risk.
- Consistent definitions, average balances and attention to accounting differences prevent misleading comparisons.
- Good analysis turns ratios into a story about operating causes and checks it against cash flow.
- Time-series analysis
- Comparing a company with its own past results.
- Cross-sectional analysis
- Comparing a company with peers at the same time.
- Return on assets
- Net income divided by average total assets.
- Return on equity
- Net income divided by average shareholders' equity.
- Asset turnover
- Revenue divided by average total assets.
- Inventory turnover
- Cost of goods sold divided by average inventory.
- Current ratio
- Current assets divided by current liabilities.
- Quick ratio
- Liquid current assets, excluding inventory, divided by current liabilities.
- Net debt to EBITDA
- Borrowings minus cash, divided by EBITDA.
- Interest coverage
- Operating profit divided by interest expense.
Practice problems
Work each problem on paper first, then reveal the answer to check.
Revenue 80, net income 6, average assets 60 (millions). What are net margin, asset turnover and ROA?
Show answer
7.5 %, 1.33 times and 10 %.
Current assets 45, inventory 20, current liabilities 30. What are the current and quick ratios?
Show answer
1.5 and about 0.83.
Debt 120, cash 20, EBITDA 40. What is net debt to EBITDA?
Show answer
2.5 times.
EBIT 18, interest 4.5. What is interest coverage?
Show answer
4 times.
Why might a retailer with a year-end of 31 January show unusually high inventory turnover?
Show answer
Inventory is at its lowest after the holiday season, so the year-end balance understates average inventory.
Portfolio task: calculate five ratios for your own employer or a public company over three years and explain the trend.
Show answer
Answers vary.
Lesson quiz · 5 questions
Score 60% or more to complete this lesson.
Create a free account to save your progress, take quizzes and earn a certificate.