
MBA-501 · Lesson 10 of 12 · 22 min
Budgeting, variances and management control
A budget is a plan expressed in numbers. It forces managers to agree on what they expect to sell, what they will spend and what they will need to finance, and it becomes the yardstick against which results are judged. Budgets are also among the most criticized tools in management: they can take months to prepare, become obsolete within weeks, and encourage gaming. This lesson explains how budgets are built, how flexible budgets and variance analysis separate the effects of volume, price and efficiency, and how budgets fit into a broader system of management control.
Why organizations budget
Budgets serve several purposes at once. They are plans, translating strategy into resources. They coordinate departments: production needs the sales forecast, purchasing needs the production plan, and the treasurer needs all of them to plan cash. They communicate expectations and allocate authority to spend. They provide a benchmark for evaluating performance. And they often set targets for bonuses. The trouble is that these purposes conflict. A budget used for planning should be the most accurate forecast possible; a budget used for bonuses invites managers to negotiate easy targets. Dr. Achterberg calls this the central tension of budgeting.
The master budget
The master budget is a set of linked schedules. It usually starts with the sales budget, because nearly everything else depends on expected volume and prices. The production budget then determines how many units must be made, given the desired change in finished goods inventory. Direct materials, direct labour and overhead budgets follow, then the budgets for selling and administrative expenses. These operating budgets feed a budgeted income statement. The financial budgets, the capital expenditure budget, the cash budget and the budgeted balance sheet, show whether the plan can be financed.
| Schedule | Main inputs | Main outputs |
|---|---|---|
| Sales budget | Volume and price forecasts by product and region | Budgeted revenue and collections |
| Production budget | Sales units, desired ending inventory | Units to produce |
| Materials, labour and overhead budgets | Production units, standards, rates | Purchases and conversion costs |
| Operating expense budgets | Plans for selling, administration, research | Period expenses |
| Capital budget | Approved projects | Capital spending and depreciation |
| Cash budget | All of the above plus collection and payment timing | Monthly cash balance and borrowing needs |
| Budgeted statements | All schedules | Projected income statement and balance sheet |
The cash budget deserves special attention because profitable plans can still run out of cash. It converts sales into collections using the expected payment pattern and purchases into payments using supplier terms, adds capital spending, debt service and taxes, and shows the month-by-month cash position. When the balance falls below a minimum, the budget shows how much must be borrowed. Northfield's cash budget showed that a new contract starting in March would require 4.2 million dollars of extra working capital by June, well before the first payments arrived, which is why Daniel negotiated a temporary increase in the credit line in January.
Approaches to budgeting
Incremental budgeting starts from last year's figures and adjusts them. It is quick but perpetuates past inefficiencies. Zero-based budgeting requires every cost to be justified from scratch each cycle, which challenges assumptions but takes great effort; many organizations use it selectively for discretionary costs. Activity-based budgeting builds costs from the activities required by the planned volume and mix, using the drivers from Lesson 9. Rolling forecasts replace the fixed annual budget with a forecast updated every quarter for the next four or five quarters, so the plan never runs out and responds to change. Kestrel uses a rolling forecast because a fast-growing start-up's annual budget is obsolete by spring.
Participative budgeting, in which managers help set their own budgets, improves accuracy and commitment but invites budgetary slack, deliberately easy targets. Top-down budgeting is faster and keeps targets ambitious but may be unrealistic and resented. Most organizations combine the two: senior management sets overall targets, and managers propose detailed plans that are negotiated to fit.
Static and flexible budgets
A static budget is prepared for one planned level of activity. Comparing actual results with a static budget mixes two effects: the effect of selling more or fewer units than planned, and the effect of spending more or less per unit than planned. A flexible budget recalculates what revenue and costs should have been at the actual level of activity, using the budgeted prices and cost behaviour from Lesson 8. Comparing the static budget with the flexible budget isolates the sales volume variance; comparing the flexible budget with actual results isolates the flexible budget variances, which reflect prices, rates and efficiency.
Price and quantity variances
Flexible budget variances for variable costs split further into a price variance and a quantity, or efficiency, variance. The price variance compares the actual price paid with the standard price, for the actual quantity used. The quantity variance compares the actual quantity used with the standard quantity allowed for the actual output, at the standard price. Together they explain the whole difference between actual cost and flexible budget cost.
A variance is described as favourable when it increases profit relative to the budget and unfavourable when it reduces it. An unfavourable material price variance means the company paid more per kilogram than planned; an unfavourable quantity variance means it used more kilograms than the standard allows for the output achieved. The labels describe direction, not good or bad management: a purchasing manager who buys cheap, poor-quality steel creates a favourable price variance and an unfavourable quantity variance on the shop floor.
# Flexible budget and variances for one month on Northfield's bracket line
budget = {"units": 26_000, "price": 18.40, "steel_kg": 0.82, "steel_price": 1.95,
          "work_hrs": 0.050, "wage": 36.00, "var_oh_per_unit": 1.42, "fixed_oh": 119_000}
actual = {"units": 24_500, "revenue": 446_390, "steel_kg_used": 20_830, "steel_cost": 42_910,
          "work_hrs": 1_295, "wages": 47_270, "var_oh": 35_600, "fixed_oh": 121_400}
def tag(v):                                        # F if the effect raises profit, U if it lowers it
    return f"{abs(v):>9,.0f} {'F' if v >= 0 else 'U'}"
cm_budget = budget["price"] - budget["steel_kg"] * budget["steel_price"] - budget["work_hrs"] * budget["wage"] - budget["var_oh_per_unit"]
volume_var = (actual["units"] - budget["units"]) * cm_budget
price_var = actual["revenue"] - actual["units"] * budget["price"]
std_kg = actual["units"] * budget["steel_kg"]
ap_steel = actual["steel_cost"] / actual["steel_kg_used"]
steel_price_var = -(ap_steel - budget["steel_price"]) * actual["steel_kg_used"]
steel_qty_var = -(actual["steel_kg_used"] - std_kg) * budget["steel_price"]
std_hrs = actual["units"] * budget["work_hrs"]
wage_rate_var = -(actual["wages"] - actual["work_hrs"] * budget["wage"])
efficiency_var = -(actual["work_hrs"] - std_hrs) * budget["wage"]
var_oh_var = -(actual["var_oh"] - actual["units"] * budget["var_oh_per_unit"])
fixed_oh_var = -(actual["fixed_oh"] - budget["fixed_oh"])
rows = [("Sales volume", volume_var), ("Selling price", price_var), ("Steel price", steel_price_var),
        ("Steel quantity", steel_qty_var), ("Wage rate", wage_rate_var), ("Work efficiency", efficiency_var),
        ("Variable overhead", var_oh_var), ("Fixed overhead spending", fixed_oh_var)]
for name, v in rows:
    print(f"{name:<24}{tag(v)}")
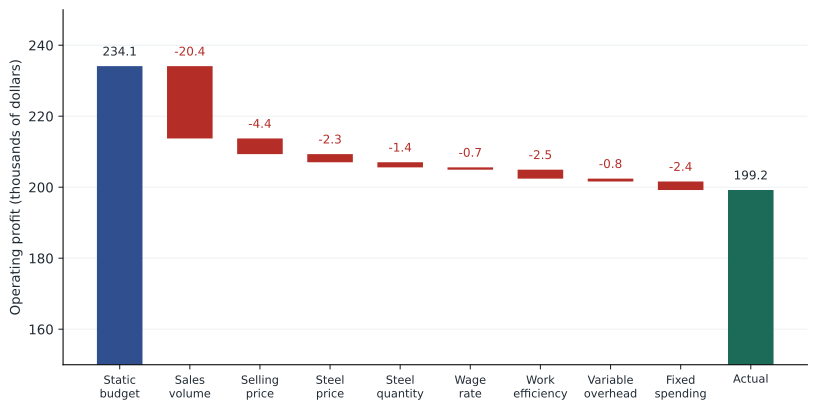
print(f"{'Total':<24}{tag(sum(v for _, v in rows))}")Sales volume 20,371 U Selling price 4,410 U Steel price 2,291 U Steel quantity 1,443 U Wage rate 650 U Work efficiency 2,520 U Variable overhead 810 U Fixed overhead spending 2,400 U Total 34,896 U
The analysis tells a clear story. Volume was about 6 % below plan, costing about 20,400 dollars of contribution, well over half of the total shortfall of about 34,900 dollars. Selling prices were slightly below standard, probably because of a volume rebate. Steel cost more per kilogram than planned, and the line used more steel than the standard allowed. Labour hours were above standard, which suggests the scrap and rework problem Daniel had been chasing. The variances do not say who is to blame; they tell managers which questions to ask, starting with the steel quantity and efficiency variances, which point to the same cause on the line.
Fixed overhead and the volume trap
Fixed overhead variances need care. The spending variance, actual minus budgeted fixed overhead, is straightforward. But in an absorption costing system, fixed overhead is also applied to units at a predetermined rate, and producing fewer units than planned leaves some fixed overhead unabsorbed, which shows up as a production volume variance. This variance does not represent a change in spending; it reflects the use of capacity. Managers who are judged on absorbed costs can make the variance look better by producing more than they can sell, building inventory that hides fixed costs on the balance sheet. For performance evaluation, many companies therefore use variable costing internally, treating fixed overhead as a period cost.
Management control beyond the budget
Budgets are one element of a management control system. Responsibility accounting assigns each unit the measures it can influence: cost centres are judged on costs, revenue centres on sales, profit centres on profit, and investment centres on return on investment, ROIC or economic profit. Transfer prices, the prices charged between divisions, affect divisional profits and can lead managers to make decisions that are good for the division but bad for the company. Non-financial measures such as quality, delivery, safety and customer satisfaction, often organized in a balanced scorecard, complement the financial measures. MBA-514 and MBA-503 return to these tools.
The Beyond Budgeting movement, which started with Scandinavian companies such as Svenska Handelsbanken, argues that fixed annual targets cause more harm than good. Its adherents replace them with relative targets, such as beating peers or last year, rolling forecasts and dynamic resource allocation. Hana found the idea attractive for Lakeview's clinics, where patient demand is hard to predict a year in advance: managers could be judged on cost per visit relative to other clinics rather than on hitting a fixed budget.
Behavioural effects
Budgets shape behaviour, for better and worse. Targets that are challenging but achievable tend to motivate; targets that are impossible demotivate, and targets that are too easy waste effort. Rigid spend-it-or-lose-it rules encourage year-end spending sprees. Bonuses tied to hitting a number encourage managers to pull sales forward, delay maintenance or cut training when they are short, and to hold back when they are already over target. Good control systems reduce these incentives: they combine financial and non-financial measures, separate forecasting from target-setting, and use judgement in evaluation rather than formulas alone.
Rolling forecasts
Many organizations now supplement or replace the annual budget with a rolling forecast. Every quarter, the forecast is extended by another quarter, so that managers always look a full year or more ahead rather than toward a fixed year end that gets closer each month. A rolling forecast is updated with the latest information about demand, prices and costs, and it focuses on a limited number of key drivers rather than hundreds of line items. Because it is a forecast rather than a target, managers have less reason to build in slack.
The approach works best when it is separated from performance evaluation. If the forecast also determines bonuses, managers will treat it as a negotiation, and its accuracy will suffer. Owen Tremblay's company, Prairie Ridge Energy, moved to quarterly rolling forecasts after commodity price swings made its annual budgets obsolete within weeks. Targets are now set relative to peers and to the volumes and prices that actually occurred, while the forecast is used for cash planning, hedging decisions and capital allocation.
Worked problem
Reading a variance report
Lakeview's main clinic shows total costs 6 % over the static budget for the quarter. Patient visits were 9 % above budget. Should Hana be concerned?
Show solution
- A static budget comparison is misleading because visits were higher than planned; variable costs should rise with visits.
- Prepare a flexible budget: budgeted fixed costs plus budgeted variable cost per visit times actual visits.
- If variable costs are, say, 60 % of the budget, the flexible budget would be about 1.054 times the static budget, so actual costs are only slightly over the flexible budget.
- Investigate the remaining variance by type: staff overtime rates, supply prices, supply usage per visit and fixed cost spending.
Answer: Against a flexible budget the clinic is roughly on target. The question is whether the small remaining overrun is a price or an efficiency problem.
Common mistakes
MistakeA favourable variance always means good performance.
InsteadIt indicates direction only; cheap materials can cause unfavourable quantity variances elsewhere.
MistakeActual costs should be compared with the original static budget.
InsteadComparing with a flexible budget separates volume effects from price and efficiency effects.
MistakeProducing more than needed is harmless if overhead variances improve.
InsteadIt builds inventory and hides fixed costs on the balance sheet.
MistakeParticipative budgets are always accurate.
InsteadThey improve commitment but invite budgetary slack.
MistakeBudgets should be used for planning and bonuses without adjustment.
InsteadThe purposes conflict; separating forecasts from targets reduces gaming.
Summary and key terms
- Budgets plan, coordinate, communicate, allocate authority and benchmark performance, and these purposes can conflict.
- The master budget links sales, production, cost, capital and cash budgets into budgeted statements.
- Cash budgets reveal financing needs that profitable plans can create.
- Flexible budgets recalculate expected revenue and costs at actual activity, isolating volume variances.
- Price and quantity variances split cost differences into what was paid and how much was used.
- Fixed overhead volume variances reflect capacity use, not spending, and can encourage overproduction.
- Budgets are part of a broader control system with responsibility centres, non-financial measures and behavioural effects.
- Master budget
- An integrated set of operating and financial budgets for a period.
- Cash budget
- A projection of cash receipts, payments and balances by period.
- Static budget
- A budget for a single planned level of activity.
- Flexible budget
- A budget adjusted to the actual level of activity.
- Sales volume variance
- The effect on profit of selling more or fewer units than planned.
- Price variance
- The difference between actual and standard price, times actual quantity.
- Quantity variance
- The difference between actual and standard quantity for actual output, times standard price.
- Budgetary slack
- Deliberately understated revenue or overstated costs in a budget.
- Rolling forecast
- A forecast updated regularly for a fixed number of future periods.
- Responsibility centre
- A unit whose manager is accountable for specified costs, revenues, profit or investment.
Practice problems
Work each problem on paper first, then reveal the answer to check.
A plant used 10,400 kg of material at 2.10 dollars per kg; the standard is 10,000 kg at 2.00 dollars for actual output. What are the price and quantity variances?
Show answer
Price 1,040 dollars unfavourable; quantity 800 dollars unfavourable.
Budgeted fixed costs 200,000, variable cost 12 dollars per unit, actual volume 15,000 units. What is the flexible budget cost?
Show answer
380,000 dollars.
Actual sales 9,000 units against 10,000 budgeted; budgeted contribution 25 dollars per unit. What is the sales volume variance?
Show answer
25,000 dollars unfavourable.
Why might a purchasing manager's favourable price variance worry the production manager?
Show answer
Cheaper inputs may be of lower quality, raising usage, scrap and rework.
Name one advantage and one drawback of rolling forecasts.
Show answer
They stay current and responsive; they take continual effort and may weaken commitment to targets.
Portfolio task: obtain a variance report from your organization and identify which variances reflect volume, price and efficiency.
Show answer
Answers vary.
Lesson quiz · 5 questions
Score 60% or more to complete this lesson.
Create a free account to save your progress, take quizzes and earn a certificate.