
LES-203 · Lesson 11 of 12 · 21 min
Time, distance and avoidability
▶ Video coming soon A video version of this lesson is on the way.
Two weeks after the collision, Kowalczyk sat in the traffic office with four pieces of evidence open on his screens: Siddiqui's dashboard camera video, the pickup's event data recorder report, the signal timing log and the extraction report from Halloran's phone. Each had its own clock. The dashboard camera was 2.3 seconds fast compared with the signal controller, which is synchronized to a time server. The phone's clock was accurate. Before he could ask what each driver could have done, he had to line all four up on one timeline, to the tenth of a second.
This lesson covers the analysis that turns measurements into answers about responsibility: how long each event took, where each vehicle was at each moment, what each driver could have perceived, and whether either of them could have avoided the collision. It also covers the legal authority to obtain the electronic evidence that makes this analysis possible.
Speed, distance and time
Almost every question in this lesson is answered with one relationship: distance equals speed multiplied by time. If a vehicle travels at a steady speed, the distance it covers in a given time is the speed times the time; the time it takes to cover a given distance is the distance divided by the speed. To use this relationship, speeds must be in metres per second. Dividing a speed in kilometres per hour by 3.6 gives metres per second, so 50 km/h is 13.9 m/s and 76 km/h is about 21.2 m/s.
Kowalczyk tells the class to get into the habit of thinking in these units. A car at 50 km/h covers about 14 metres every second, roughly three car lengths. At 76 km/h it covers about 21 metres, more than four car lengths. 'When a witness says it all happened in a second, they are telling you the truck covered about 20 metres while they were noticing it.'
Perception and reaction
A driver does not brake the instant a hazard appears. First they must see it, then recognize it as a hazard, then decide what to do, and then move their foot from the accelerator to the brake. The total time is called perception-response time, or perception-reaction time. Research on drivers responding to unexpected hazards in real traffic has found times that commonly range from about 1 to 2.5 seconds, and investigators and courts often use 1.5 seconds as a typical value for an alert driver facing an unexpected but clearly visible hazard. Times are longer at night, for hazards that are hard to see or unexpected, for older drivers and for drivers who are distracted or impaired.
Perception-response time matters because a vehicle keeps travelling at full speed throughout it. The total stopping distance is therefore the distance travelled during perception and response, plus the braking distance. Because braking distance grows with the square of the speed, the total grows quickly as speed rises.
Worked problem
Stopping distance at two speeds
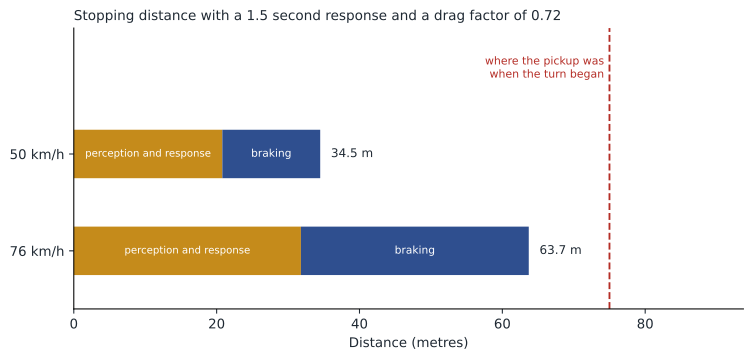
Using a perception-response time of 1.5 s and the Kingsway drag factor of 0.72, how far does a pickup need to stop from 50 km/h, and from 76 km/h?
Show solution
- At 50 km/h, or 13.9 m/s, the truck covers 13.9 times 1.5, which is 20.8 m, before braking.
- \[d_{\text{brake}} = \frac{v^2}{2 f g} = \frac{13.9^2}{2 \times 0.72 \times 9.81} \approx 13.7 \text{ m}\]
- Total at 50 km/h: about 34.5 m.
- At 76.4 km/h, or 21.2 m/s: 31.8 m before braking and 31.9 m of braking, a total of about 63.7 m.
Answer: About 34.5 m at 50 km/h and 63.7 m at 76 km/h: the extra 26 km/h almost doubles the stopping distance.
Event data recorders
The pickup's event data recorder was part of its airbag control module. Like most recorders in light vehicles, it recorded the five seconds before the airbag module detected the crash, in half-second or one-second steps, including vehicle speed, accelerator position, whether the brake pedal was pressed and whether the driver's seat belt was buckled. The data are read with a crash data retrieval tool connected to the vehicle or directly to the module. Investigators treat recorder data as strong evidence, but they still check it against the physical evidence, because recorded speed can be affected by wheel slip during hard braking and by tire size.
| Time before impact | Recorded speed | Accelerator | Brake |
|---|---|---|---|
| 5.0 s | 78 km/h | 22 in 100 | Off |
| 4.0 s | 78 km/h | 20 in 100 | Off |
| 3.0 s | 77 km/h | 0 | Off |
| 2.0 s | 77 km/h | 0 | Off |
| 1.0 s | 64 km/h | 0 | On |
| 0.0 s (impact) | 39 km/h | 0 | On |
The recorder confirmed the reconstruction from the marks. The truck was travelling at about 77 to 78 km/h in the seconds before the collision, the driver came off the accelerator about three seconds before impact, the brakes came on between two seconds and one second before impact, and the speed at impact was about 39 km/h. Kowalczyk's calculation from the marks had used an impact speed of 38 km/h from an early reading of the data and a momentum analysis, and the speed at the start of braking, about 76 km/h, sat just below the recorded pre-braking speed, as it should.
Building a timeline
With the clocks aligned, Kowalczyk built a timeline of the last six seconds. The dashboard video showed the hatchback beginning its left turn, its front wheels crossing into the first westbound lane, 3.9 seconds before impact. The impact itself was at 01:40:09.0 on the signal controller's clock. From the recorder and the marks, the pickup's brakes came on 1.5 seconds before impact, 24.0 metres from the point of impact, and the truck was travelling at about 21.2 m/s before that.
Worked problem
Where was the pickup when the turn began?
The turn began 3.9 s before impact. The pickup braked for the last 1.5 s, over 24.0 m, and before that travelled at about 21.2 m/s. How far from the point of impact was it when the turn began?
Show solution
- Before braking, the truck travelled for 3.9 minus 1.5, which is 2.4 seconds.
- \[2.4 \times 21.2 \approx 50.9 \text{ m}\]
- Add the 24.0 m of braking: about 75 m.
Answer: About 75 m from the point of impact.
That figure answers two questions at once. First, what gap did Ana Pereira see when she started to turn? A vehicle 75 m away at 50 km/h would arrive in about 5.4 seconds; at 76 km/h it arrives in about 3.5 seconds. Research on left-turning drivers shows that most accept gaps of about five seconds or more and that drivers are poor at judging the speed of approaching vehicles at night, when they see mostly headlights. The hatchback needed about 5.1 seconds from the start of its turn to clear the pickup's lane. At the speed limit, the pickup would have arrived after the hatchback had cleared it.
Second, could Halloran have stopped? From 75 m away, a driver at 76 km/h needs about 63.7 m to stop with a normal 1.5-second perception-response time. He had enough distance to stop before the point of impact if he had responded to the turning car when it began to turn. But his brakes did not come on until 1.5 seconds before impact, which means that, with a typical response time, he began to perceive the hazard about 3.0 seconds before impact, roughly 0.9 seconds after the turn began. At the speed limit, with the same late response, he would also have had far more distance than he needed.
| Question | Evidence | Answer |
|---|---|---|
| How fast was the pickup going? | Marks, test stops, event data recorder, earlier lidar reading | About 76 to 78 km/h in a 50 km/h zone |
| Where was it when the turn began? | Dashboard video, recorder, marks | About 75 m from the point of impact |
| Was the gap reasonable for a car at the limit? | Time-distance calculation | Yes: about 5.4 s, more than the 5.1 s she needed |
| Could Halloran have stopped? | Stopping distance with 1.5 s response | Yes, if he had responded when the turn began: 63.7 m needed, 75 m available |
| Why did he respond late? | Phone extraction, timeline | A message was sent from his phone about a second before the turn began |
Phones and distraction
Halloran's phone was seized at the scene and searched under a warrant. The extraction showed that a messaging app was open, that he had been exchanging messages with a friend since 01:36, and that he sent a message at 01:40:04, about one second before the hatchback began its turn and five seconds before impact. The message said 'almost there'. The phone did not show whether he was holding it or looking at it in the following seconds; that is a question of inference for the court, from the timing of the message, his late response and where the phone was found. Kowalczyk's report sets out the facts and the inference separately, so that the court can weigh each.
Using a hand-held communication device while driving is an offence under section 78.1 of the Highway Traffic Act, with set fines of 615 dollars or more on conviction for a first offence, three demerit points and a three-day licence suspension. Desjardins points out that distraction is often impossible to prove without electronic evidence. 'Nobody says, I was texting. The phone says it for them.'
The legal authority to obtain electronic evidence
Electronic evidence is powerful precisely because it is private. A phone holds a person's messages, photographs, location history and much more, and the data in a vehicle can show where and how a person drove. Courts in both countries have therefore required police to have proper legal authority before obtaining it. In R. v. Fearon in 2014, the Supreme Court of Canada set strict limits on searching a phone incident to arrest, and in practice police obtain a warrant to search a phone in a collision investigation. Records held by phone companies require a production order. Most Canadian services also obtain a warrant before downloading a vehicle's event data recorder unless the owner consents, because courts have treated the data as capable of attracting a reasonable expectation of privacy. Port Ardent obtained warrants for both vehicles' recorders and for Halloran's phone, and Ana Pereira consented in writing to the download of her car's recorder.
Momentum and other methods
Investigators often check speed estimates with a second method based on conservation of momentum. In a collision, the total momentum of the vehicles, which is mass times velocity in a given direction, is the same just before and just after the impact. If investigators know the masses of the vehicles, their directions before impact and their speeds and directions just after impact, calculated from the distances and surfaces over which they slid to final rest, they can work backward to the impact speeds. Momentum analysis is beyond the scope of this course, but students should know that a careful reconstruction never relies on a single method. On Kingsway, the momentum analysis gave the pickup an impact speed of 35 to 41 km/h, consistent with the recorder.
Seeing at night
Many collisions happen at night, when what a driver can see depends on headlights, street lighting and the contrast between an object and its background. Low-beam headlights light the road for a limited distance ahead, and at higher speeds the stopping distance can exceed the distance the driver can see clearly. A pedestrian in dark clothing on an unlit road may not be visible until the car is very close, while the same pedestrian in reflective clothing can be seen several times farther away. Investigators therefore study visibility at night, under the same lighting, before they decide what a driver could reasonably have perceived. On Kingsway, the intersection was well lit, and the hatchback had its headlights and turn signal on, so visibility was not in dispute.
Common mistakes
MistakeDrivers react instantly to hazards.
InsteadPerception-response time is commonly about 1.5 seconds and longer at night or when distracted.
MistakeRecorder data replace physical evidence.
InsteadThey are checked against the marks, test stops and other methods, and vice versa.
MistakeThe driver with the right of way cannot share responsibility.
InsteadA driver far over the limit who responds late may be responsible even when the other driver had to yield.
MistakeA phone found in the vehicle proves the driver was using it.
InsteadThe timing of messages and other evidence support an inference that the court must weigh.
Summary and key terms
- Distance equals speed times time; speeds must be converted to distance per second.
- Perception-response time is commonly about 1.5 seconds, and the vehicle travels at full speed during it.
- Stopping distance is the perception-response distance plus the braking distance, and grows quickly with speed.
- Event data recorders record speed, accelerator, brake and belt data for a few seconds before a crash.
- A timeline built from aligned clocks shows where vehicles were and what drivers could have done.
- Phones and recorders require proper authority: warrants or consent (Fearon).
- Perception-response time
- The time from a hazard appearing to the driver starting to brake or steer.
- Stopping distance
- The distance travelled during perception and response plus the braking distance.
- Avoidability analysis
- An analysis of whether a driver could have avoided a collision at a given speed and response time.
- Conservation of momentum
- The principle that total momentum is the same just before and just after a collision.
Practice problems
Work each problem on paper first, then reveal the answer to check.
Why did Kowalczyk align the clocks before building the timeline?
Show answer
Because the dashboard camera, recorder, signal log and phone each had their own clock, and some were inaccurate.
What perception-response time is often used for an alert driver?
Show answer
About 1.5 seconds.
Would the hatchback have cleared the pickup's lane if the pickup had been at the limit?
Show answer
Yes: the pickup would have taken about 5.4 seconds to arrive, and the hatchback needed about 5.1.
What did the phone extraction show?
Show answer
That a message was sent about one second before the turn began and five seconds before impact.
Lesson quiz · 5 questions
Score 60% or more to complete this lesson.
Create a free account to save your progress, take quizzes and earn a certificate.