
JAVA-280 · Lesson 9 of 12 · 24 min
Monitoring and logging in production
▶ Video coming soon A video version of this lesson is on the way.
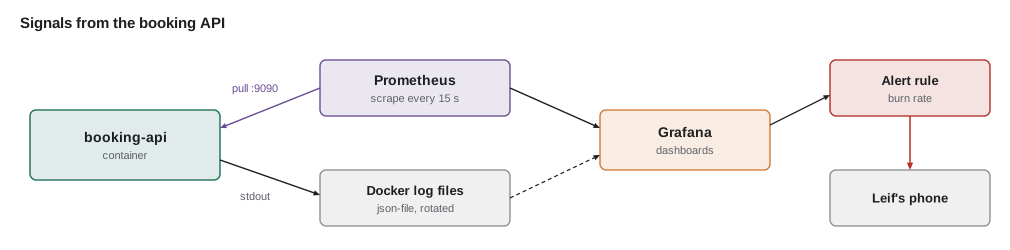
On Thursday, March 23, Leif opened his laptop on the bench and showed Hamza an empty Grafana dashboard on the shop server. He had installed Prometheus and Grafana there that afternoon, next to the health service, in two more containers. "In three weeks the booking API goes live," he said. "From that day, the only way we know what it is doing is what it tells us. Tonight we decide what it says." In Ingrid's course, the booking API had gained Actuator, Micrometer metrics and health groups; this lesson is about the other end, collecting those signals on the server, keeping logs and turning both into alerts that wake the right person for the right reasons.
Three kinds of signal
A running service can be observed through three kinds of signal. Logs are records of individual events, written as lines of text: a booking created, a supplier call that timed out. Metrics are numbers sampled over time: requests per second, the 95th percentile latency, heap used, bookings created. Traces follow one request through every component it touches, with the time spent in each. Metrics answer whether something is wrong and how much, logs and traces answer what and why. A small service needs all three, but in that order of importance: metrics first, because they are what alerts are built on.
| Signal | Question it answers | At Second Gear |
|---|---|---|
| Metrics | Is it healthy? How fast? How many? | Actuator /actuator/prometheus, scraped by Prometheus |
| Logs | What happened to this request? | JSON lines on standard output, kept by Docker |
| Traces | Where did this slow request spend its time? | Trace IDs in every log line; full tracing later |
| Health | Should it receive traffic? Should it be restarted? | Readiness and liveness groups on port 9090 |
Logs as an event stream
The twelve-factor rule for logs is that a service never manages log files itself. It writes events to standard output, one per line, and the environment decides where they go. In a container that is the natural design: Docker captures standard output, Compose shows it with docker compose logs, and a log shipper can forward it. What the service controls is the content of each line. A line meant for a person, such as Booking 2041 created for Ana at 10:30, is easy to read and hard to search. A structured log line is a JSON object with named fields, easy to filter by booking ID or level and still readable.
Spring Boot 3.4 and later write structured logs without extra libraries: the property logging.structured.format.console set to ecs, logstash or gelf switches the console output to JSON in that format. Hamza used ecs, the Elastic Common Schema, for the prod profile. The example writes such a line by hand, with the fields the booking API's lines carry.
import java.time.*;
import java.util.*;

public class Main {
    static String json(String s) {
        StringBuilder b = new StringBuilder("\"");
        for (char c : s.toCharArray()) {
            switch (c) {
                case '"' -> b.append("\\\"");
                case '\\' -> b.append("\\\\");
                case '\n' -> b.append("\\n");
                default -> b.append(c);
            }
        }
        return b.append('"').toString();
    }

    static String line(Instant at, String level, String logger, String message, Map<String, String> fields) {
        StringBuilder b = new StringBuilder("{");
        b.append("\"@timestamp\":").append(json(at.toString()));
        b.append(",\"log.level\":").append(json(level));
        b.append(",\"log.logger\":").append(json(logger));
        b.append(",\"message\":").append(json(message));
        new TreeMap<>(fields).forEach((k, v) -> b.append(",").append(json(k)).append(":").append(json(v)));
        return b.append("}").toString();
    }

    public static void main(String[] args) {
        Instant t = Instant.parse("2028-04-29T14:30:05.120Z");
        System.out.println(line(t, "INFO", "o.s.booking.BookingService", "booking created",
            Map.of("booking.id", "2041", "booking.start", "2028-05-06T10:30", "trace.id", "4bf92f3577b34da6")));
        System.out.println(line(t.plusSeconds(2), "WARN", "o.s.booking.SupplierStock", "supplier \"Velotek\" timed out\nafter 1000 ms",
            Map.of("supplier", "velotek", "trace.id", "a3ce929d0e0e4736")));
    }
}{"@timestamp":"2028-04-29T14:30:05.120Z","log.level":"INFO","log.logger":"o.s.booking.BookingService","message":"booking created","booking.id":"2041","booking.start":"2028-05-06T10:30","trace.id":"4bf92f3577b34da6"}
{"@timestamp":"2028-04-29T14:30:07.120Z","log.level":"WARN","log.logger":"o.s.booking.SupplierStock","message":"supplier \"Velotek\" timed out\nafter 1000 ms","supplier":"velotek","trace.id":"a3ce929d0e0e4736"}What this code does
The json method escapes quotes, backslashes and newlines, so a message containing any of them still gives one valid line; without it, a newline would split one event into two broken ones. Extra fields are added in sorted order so that lines are easy to compare. The trace ID ties every line of one request together, and none of the fields holds a customer's name or phone number.
That last point was deliberate. A log line is copied to more places and kept longer than the database row it describes, so the booking API logs booking IDs, not customers. JAVA-260 added the redaction rules that enforce it.
Docker's default logging driver writes each container's output to a JSON file on the host, and by default that file grows without limit. Leif set rotation for every service in the Compose file: three files of twenty megabytes each, about a week of the booking API's logs at its expected volume.
x-logging: &logging
  driver: json-file
  options:
    max-size: "20m"
    max-file: "3"

services:
  booking-api:
    logging: *logging
  proxy:
    logging: *logging
What this code does
The x-logging block is a YAML anchor that each service reuses with *logging, so the rule is written once. max-size and max-file bound each container's logs to sixty megabytes on disk. Lines older than that are gone, so anything that must be kept longer, such as booking history, belongs in the database, not the log.
Log levels in production
Levels decide what is written. Leif's policy was short. ERROR is something that needs a person, such as a failed database migration. WARN is something unusual that the service handled, such as a supplier timeout answered from the last known price. INFO is a business event, such as a booking created or canceled, at most a few lines per request. DEBUG is off in production, and switched on for one logger at a time through an environment variable when chasing a problem, as lesson 5 showed.
Metrics with Prometheus
Prometheus pulls metrics: every few seconds it requests a page of text from each service, the scrape, and stores each number with its time. Spring Boot's Actuator provides that page at /actuator/prometheus, on the management port 9090, in Prometheus's text exposition format: one line per series, a metric name, labels in braces and a value. The example writes the format for two of the booking API's metrics.
import java.util.*;

public class Main {
    record Series(String name, Map<String, String> labels, double value) {}

    static String render(String name, String type, String help, List<Series> series) {
        StringBuilder b = new StringBuilder();
        b.append("# HELP ").append(name).append(" ").append(help).append("\n");
        b.append("# TYPE ").append(name).append(" ").append(type).append("\n");
        for (Series s : series) {
            StringJoiner lj = new StringJoiner(",", "{", "}");
            new TreeMap<>(s.labels()).forEach((k, v) -> lj.add(k + "=\"" + v + "\""));
            b.append(s.name()).append(lj).append(" ").append(s.value()).append("\n");
        }
        return b.toString();
    }

    public static void main(String[] args) {
        System.out.print(render("bookings_total", "counter", "Repair bookings by outcome", List.of(
            new Series("bookings_total", Map.of("outcome", "created"), 412),
            new Series("bookings_total", Map.of("outcome", "slot_taken"), 9))));
        System.out.print(render("http_server_requests_seconds", "summary", "HTTP request latency", List.of(
            new Series("http_server_requests_seconds_count", Map.of("uri", "/api/v1/repair-slots", "status", "200"), 5210),
            new Series("http_server_requests_seconds_sum", Map.of("uri", "/api/v1/repair-slots", "status", "200"), 312.6))));
    }
}# HELP bookings_total Repair bookings by outcome
# TYPE bookings_total counter
bookings_total{outcome="created"} 412.0
bookings_total{outcome="slot_taken"} 9.0
# HELP http_server_requests_seconds HTTP request latency
# TYPE http_server_requests_seconds summary
http_server_requests_seconds_count{status="200",uri="/api/v1/repair-slots"} 5210.0
http_server_requests_seconds_sum{status="200",uri="/api/v1/repair-slots"} 312.6What this code does
Each metric starts with HELP and TYPE comments, then one line per combination of labels. A **counter** only ever goes up, here the bookings created and refused since the service started. Latency is published as a count and a sum, from which Prometheus computes the average over any window, and with histogram buckets enabled it can compute percentiles as well.
global:
  scrape_interval: 15s

scrape_configs:
  - job_name: booking-api
    metrics_path: /actuator/prometheus
    static_configs:
      - targets: ["booking-api:9090"]
        labels: { env: production }
  - job_name: ops-health
    metrics_path: /metrics
    static_configs:
      - targets: ["ops:8080"]
What this code does
Prometheus runs in a container on the same Compose network, so it reaches the booking API by service name on the management port, which is never published to the internet. The env label is added to every series from this target, so the same dashboards can later show staging too. Fifteen seconds is frequent enough to notice a problem within a minute and cheap for a service of this size.
Counters are scraped as running totals, so a dashboard always works with their rate: the increase per second over a window. Prometheus's rate function also handles counter resets: when the service restarts, its counters start again from zero, and a naive subtraction would give a large negative number. The example computes a rate the same way from scraped samples.
import java.util.*;

public class Main {
    record Sample(int second, double value) {}

    static double rate(List<Sample> s) {
        double increase = 0;
        for (int i = 1; i < s.size(); i++) {
            double d = s.get(i).value() - s.get(i - 1).value();
            increase += d >= 0 ? d : s.get(i).value();
        }
        int span = s.get(s.size() - 1).second() - s.get(0).second();
        return increase / span;
    }

    public static void main(String[] args) {
        List<Sample> normal = List.of(new Sample(0, 400), new Sample(15, 403), new Sample(30, 405), new Sample(45, 409), new Sample(60, 412));
        List<Sample> restart = List.of(new Sample(0, 400), new Sample(15, 403), new Sample(30, 1), new Sample(45, 4), new Sample(60, 7));
        System.out.printf("bookings per minute: %.1f%n", rate(normal) * 60);
        System.out.printf("with a restart at 20 s: %.1f%n", rate(restart) * 60);
        System.out.printf("naive (last - first): %.1f%n", (restart.get(4).value() - restart.get(0).value()) / 60 * 60);
    }
}bookings per minute: 12.0 with a restart at 20 s: 10.0 naive (last - first): -393.0
What this code does
rate adds the increases between consecutive samples, and when a value drops it assumes the counter restarted from zero and counts the new value as the increase. The normal series shows twelve bookings a minute, and the restart lowers the answer to ten, because the bookings between the last scrape and the restart are lost. The naive difference gives a nonsense negative rate, which is why dashboards always use rate on counters.
What to watch: RED and saturation
Leif's dashboard had four rows, following the RED method for request-driven services, plus one for the JVM. Rate: requests per second, by endpoint. Errors: the share of requests answered with a 5xx status. Duration: the 95th and 99th percentile latency. And saturation: how full the resources are, here the heap after GC, the database connection pool and the container's memory against its limit. Business metrics such as bookings created per hour sat at the top, because a drop in bookings on a Saturday morning is the most important alert of all, whatever the technical graphs say.
| Row | Prometheus query (sketch) | Healthy looks like |
|---|---|---|
| Bookings | increase(bookings_total{outcome="created"}[1h]) | Steady on open days, zero on Mondays |
| Rate | sum by (uri) (rate(http_server_requests_seconds_count[5m])) | A few requests per second |
| Errors | 5xx rate divided by total rate | Zero, or close to it |
| Duration | histogram_quantile(0.95, ...) | p95 under 300 ms |
| Saturation | hikaricp_connections_active, jvm_memory_used_bytes | Pool below 8 of 10; heap well below its maximum |
Alerts that mean something
An alert should mean that a person needs to act, now. Alerts on causes, such as CPU above 80 for five minutes, fire often and mostly mean nothing; alerts on symptoms that customers feel, such as errors or slow answers, are rarer and real. Leif wrote the booking API's targets as service level objectives, SLOs: 99.5 of every 100 requests in a 30-day window succeed, and 95 of every 100 finish within 300 milliseconds. The 0.5 left over is the error budget, about 216 minutes of full failure a month, which lesson 6's exercise computed.
Alerting on every failed request would page someone for a single blip. Alerting when the monthly budget is gone would be far too late. The standard answer is the burn rate: how fast the budget is being spent compared with an even spend over the month. A burn rate of 1 uses the budget exactly in 30 days; a burn rate of 14.4 sustained for an hour would use 2 in every 100 of a month's budget in that hour. Alerting when both a long window and a short window burn fast catches real outages quickly without firing on short spikes.
import java.util.*;

public class Main {
    static double burn(long errors, long requests, double slo) {
        double budget = 1 - slo / 100;
        return requests == 0 ? 0 : ((double) errors / requests) / budget;
    }

    public static void main(String[] args) {
        double slo = 99.5;
        long[][] cases = {
            {2, 4000, 0, 300},      // a normal hour: 2 errors; last 5 min clean
            {300, 4000, 28, 320},   // database failing for 20 minutes, still failing
            {350, 4000, 0, 330},    // an earlier spike, recovered now
            {0, 0, 0, 0}};          // shop closed
        String[] names = {"normal hour", "outage in progress", "recovered spike", "no traffic"};
        for (int i = 0; i < cases.length; i++) {
            long[] c = cases[i];
            double longBurn = burn(c[0], c[1], slo), shortBurn = burn(c[2], c[3], slo);
            boolean page = longBurn > 14.4 && shortBurn > 14.4;
            System.out.printf("%-18s 1h burn %5.1f, 5m burn %5.1f -> %s%n", names[i], longBurn, shortBurn, page ? "PAGE LEIF" : "no alert");
        }
    }
}normal hour 1h burn 0.1, 5m burn 0.0 -> no alert outage in progress 1h burn 15.0, 5m burn 17.5 -> PAGE LEIF recovered spike 1h burn 17.5, 5m burn 0.0 -> no alert no traffic 1h burn 0.0, 5m burn 0.0 -> no alert
What this code does
burn divides the observed error rate by the rate the budget allows, which is 0.005 for an objective of 99.5. The outage fires because both the hour and the last five minutes are above 14.4. The recovered spike burned fast over the hour but is clean now, so nobody is woken for a problem that has already ended, and no traffic gives no alert rather than a division by zero.
groups:
  - name: booking-api
    rules:
      - alert: BookingApiErrorBudgetBurn
        expr: |
          (sum(rate(http_server_requests_seconds_count{job="booking-api",status=~"5.."}[1h]))
            / sum(rate(http_server_requests_seconds_count{job="booking-api"}[1h]))) > (14.4 * 0.005)
          and
          (sum(rate(http_server_requests_seconds_count{job="booking-api",status=~"5.."}[5m]))
            / sum(rate(http_server_requests_seconds_count{job="booking-api"}[5m]))) > (14.4 * 0.005)
        labels: { severity: page }
        annotations:
          summary: "Booking API is failing requests"
          runbook: "https://github.com/second-gear/secondgear/blob/main/booking-api/docs/runbook.md#errors"
      - alert: BookingApiNotReady
        expr: up{job="booking-api"} == 0
        for: 2m
        labels: { severity: page }
What this code does
The first rule is the two-window burn-rate alert from the example, written in Prometheus's query language. The second fires when Prometheus has failed to scrape the service for two minutes, which covers a crashed or stuck container. Each alert links to a section of the runbook, so the person woken knows what to check first.
Leif left the rules as a draft that evening; he finished them with Hamza and Ingrid the following Wednesday, when the readiness alert and the slot alert were set up in Grafana.
Exercises
Try it yourself
Rate with a reset
Complete increase so that it returns the total increase of a counter over the samples, treating any drop as a restart from zero (the new value then counts as the increase).
public class Main {
    static double increase(double[] samples) {
        return samples[samples.length - 1] - samples[0];
    }

    public static void main(String[] args) {
        System.out.println(increase(new double[] {10, 12, 15, 15, 20}));
        System.out.println(increase(new double[] {10, 12, 2, 5, 9}));
        System.out.println(increase(new double[] {7}));
    }
}
Try it yourself
Should someone be paged?
Complete decide so that it returns page when the error rate (errors divided by requests) is above 14.4 times the budget in both windows, ticket when it is above 1 times the budget in the long window only, and ok otherwise. The budget is 1 - slo / 100, and a window with no requests has an error rate of 0.
public class Main {
    static String decide(double slo, long errLong, long reqLong, long errShort, long reqShort) {
        return "ok";
    }

    public static void main(String[] args) {
        System.out.println(decide(99.5, 300, 4000, 28, 320));
        System.out.println(decide(99.5, 40, 4000, 0, 330));
        System.out.println(decide(99.5, 2, 4000, 0, 300));
        System.out.println(decide(99.5, 0, 0, 0, 0));
    }
}
At ten o'clock the dashboard had one live row, the health service's request rate, a flat line at the four requests a minute that Docker's own health check produced. Leif said that a flat line nobody looks at is the best kind.
Common mistakes
MistakeWriting log files from inside the service.
InsteadWrite one event per line to standard output and let the platform store and rotate it.
MistakeLeaving Docker's json-file logs unbounded.
InsteadSet max-size and max-file for every service.
MistakeLogging customers' names and phone numbers.
InsteadLog IDs and references; keep personal data in the database.
MistakeGraphing counters as raw values.
InsteadUse rate or increase over a window, which also handles restarts.
MistakeAlerting on causes such as CPU or on every single error.
InsteadAlert on customer-facing symptoms with SLOs and two-window burn rates.
Summary and key terms
- Services are observed through metrics, logs, traces and health checks, and metrics carry the alerts.
- Logs are events written one per line to standard output, structured as JSON (Spring Boot's logging.structured.format.console), carrying IDs and trace IDs but no personal data, and rotated by Docker's json-file options.
- Prometheus scrapes Actuator's /actuator/prometheus on the private management port, storing counters, gauges and latency summaries, and dashboards use rate on counters to handle resets.
- The RED method watches rate, errors and duration, plus saturation and business metrics.
- Service level objectives define an error budget, and alerts page a person when both a long and a short window burn the budget fast, linking to a runbook.
- Structured log
- A log line made of named fields, usually JSON, rather than free text.
- Metric
- A number sampled over time, such as requests per second.
- Trace
- The record of one request across components, with timings.
- Scrape
- Prometheus fetching the current metric values from a service.
- Counter
- A metric that only increases, until the process restarts.
- Rate
- The per-second increase of a counter over a window.
- RED method
- Watching the rate, errors and duration of requests.
- Service level objective
- A target for reliability, such as 99.5 of every 100 requests succeeding.
- Error budget
- The amount of failure an objective allows over its window.
- Burn rate
- How fast the error budget is being used compared with an even spend.
Practice problems
Work each problem on paper first, then reveal the answer to check.
Where should a container's service write its logs?
Show answer
To standard output, one event per line.
Why does the booking API log booking IDs but not names?
Show answer
Logs are copied and kept widely, so personal data stays in the database.
How does Prometheus get metrics from the booking API?
Show answer
It scrapes /actuator/prometheus on port 9090 every 15 seconds.
What does rate do when a counter drops to zero?
Show answer
It treats the drop as a restart and keeps counting the increase.
Why use two windows in a burn-rate alert?
Show answer
The long window shows a real problem and the short one shows it is still happening.
Lesson quiz · 5 questions
Score 60% or more to complete this lesson.
Create a free account to save your progress, take quizzes and earn a certificate.