
JAVA-280 · Lesson 8 of 12 · 24 min
Performance tuning and profiling
▶ Video coming soon A video version of this lesson is on the way.
On Thursday, March 16, Hamza came in with a complaint from Kofi. The parts availability report that the booking API would serve to the counter computer took almost four seconds on the development server, and Kofi was used to PartsDesk answering instantly. Hamza had already started changing things: a bigger heap, a different collector, a thread pool of fifty. Leif stopped him. "Which of those did you measure?" None of them. This lesson is about doing it the other way round: measure, find the one place that matters, change it, and measure again.
Measure before tuning
Performance work has a reliable shape. First decide what "fast enough" means as a number, such as ninety-five requests in a hundred answered within 300 milliseconds. Then measure the current state under a realistic load, find where the time goes with a profiler, change one thing, and measure again with the same load. Changing JVM flags without a measurement is guessing, and guesses about performance are wrong more often than they are right, because the slow part of a program is rarely where its author expects.
| Step | Question | Tool in this lesson |
|---|---|---|
| Set a target | What latency or throughput is acceptable? | Percentiles, agreed with Odile and Kofi |
| Measure | Where are we now, under realistic load? | A load test; Actuator metrics in lesson 9 |
| Profile | Where does the time go? | Java Flight Recorder and jfr |
| Inspect | What is the JVM doing right now? | jcmd and jstat |
| Change one thing | Did that change help? | The same measurement again |
Latency is a distribution
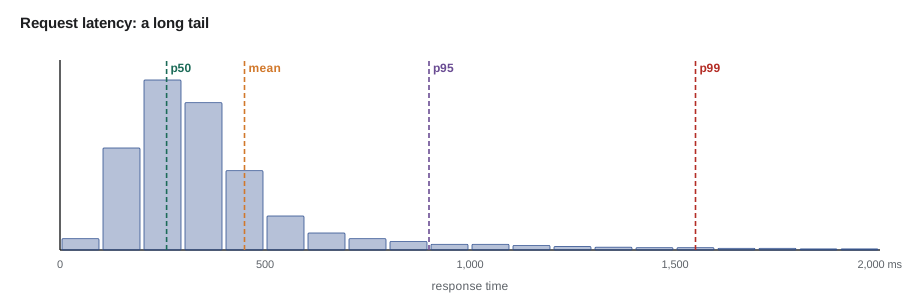
An average hides what customers feel. If ninety requests take 50 milliseconds and ten take two seconds, the average is 245 milliseconds, which describes nobody's experience. Percentiles describe the distribution: the 50th percentile, or median, is the time within which half the requests finish, the 95th the time within which ninety-five in a hundred finish, and the 99th captures the slow tail. Targets are written on percentiles, and so are alerts in lesson 9.
import java.util.*;

public class Main {
    static long percentile(List<Long> sorted, double p) {
        int rank = (int) Math.ceil(p / 100 * sorted.size());
        return sorted.get(Math.max(rank, 1) - 1);
    }

    public static void main(String[] args) {
        List<Long> ms = new ArrayList<>();
        for (int i = 0; i < 90; i++) ms.add(40L + (i * 7) % 41);
        for (int i = 0; i < 8; i++) ms.add(400L + i * 50);
        ms.add(1900L);
        ms.add(3800L);
        Collections.sort(ms);
        double mean = ms.stream().mapToLong(Long::longValue).average().orElse(0);
        System.out.printf("requests %d, mean %.0f ms%n", ms.size(), mean);
        for (double p : new double[] {50, 90, 95, 99, 100})
            System.out.printf("p%-3.0f %5d ms%n", p, percentile(ms, p));
    }
}requests 100, mean 157 ms p50 61 ms p90 80 ms p95 600 ms p99 1900 ms p100 3800 ms
What this code does
The percentile method uses the nearest-rank rule: sort the values, multiply the percentage by the count, round up, and take that element. Ninety requests fall between 40 and 80 milliseconds, so the median is fast, but the 95th percentile lands in the slow group and the 99th is almost two seconds. The mean of about 160 milliseconds matches no real request, which is why targets are not written on it.
Kofi's four seconds were not a tail: the report was slow every time. That made it a good first target, because a problem that happens on every request is easy to reproduce and to profile.
Little's law and thread pools
Hamza's thread pool of fifty was a guess too. Little's law relates three numbers for any system in a steady state: the average number of requests in progress equals the arrival rate multiplied by the average time each spends inside. If the booking API receives 20 requests a second and each takes 0.1 seconds, about two are in progress at any moment. Threads beyond what the law predicts, with a margin for bursts, do nothing but use memory, and threads far below it make requests queue.
public class Main {
    public static void main(String[] args) {
        double[][] cases = {
            {20, 0.100},   // normal Saturday: 20 requests/s, 100 ms each
            {20, 0.400},   // a supplier API slows down to 400 ms
            {60, 0.100},   // the website launch, three times the traffic
            {0.25, 3.800}  // Kofi's report today: one every 4 s, 3.8 s each
        };
        System.out.println("arrivals/s  seconds each  in progress  threads (x2 margin)");
        for (double[] c : cases) {
            double inProgress = c[0] * c[1];
            int threads = (int) Math.ceil(inProgress * 2);
            System.out.printf("%10.2f  %12.3f  %11.2f  %8d%n", c[0], c[1], inProgress, Math.max(threads, 1));
        }
    }
}arrivals/s seconds each in progress threads (x2 margin)
20.00 0.100 2.00 4
20.00 0.400 8.00 16
60.00 0.100 6.00 12
0.25 3.800 0.95 2What this code does
Each row multiplies the arrival rate by the time in the system to get the average number of requests in progress, and doubles it for bursts. A slow supplier multiplies the threads needed by four, which is why JAVA-260 put timeouts on every call to a supplier. Kofi's report needs about one thread, two with the margin; its problem is the 3.8 seconds, not the pool.
Tomcat's default of 200 threads, or virtual threads, which Spring Boot can use with spring.threads.virtual.enabled=true, make the pool size matter less for a service like this one. Little's law still says what matters: if the time inside goes up, everything else follows.
Profiling with Java Flight Recorder
Java Flight Recorder, JFR, is built into the JVM. It records events such as method samples, allocations, garbage collections, locks and file and socket input and output, with an overhead low enough, around one in a hundred, to leave on in production. A recording is started with a flag or with jcmd on a running process, written to a .jfr file, and read with JDK Mission Control or with the jfr command-line tool, whose view command prints ready-made reports.
Hamza found the cause by reproducing the report's key-building code in a small program. It builds a 200-character key for each part with string concatenation in a loop, the way the report's grouping code did, and counts the keys in a map for four seconds. He recorded it with JFR. The session is real; the recording path is shortened.
$ java -XX:StartFlightRecording=duration=10s,filename=busy.jfr Busy
[0.670s][info][jfr,startup] Started recording 1. The result will be written to:
[0.670s][info][jfr,startup]
[0.670s][info][jfr,startup] .../opsdemo/gc/busy.jfr
keys 26
$ jfr view hot-methods busy.jfr

                      Java Methods that Executes the Most

Method                                                          Samples Percent
--------------------------------------------------------------- ------- -------
java.lang.StringConcatHelper.newString(byte[], long)                 36  67.92%
Busy.slowKey(int)                                                    11  20.75%
java.lang.StringLatin1.hashCode(byte[])                               4   7.55%
java.util.HashMap.merge(Object, Object, BiFunction)                   2   3.77%
What this code does
StartFlightRecording records for up to ten seconds into busy.jfr, and the JVM prints where the file will go. jfr view hot-methods lists the methods that were running most often when JFR took its samples. More than two thirds of the samples were in StringConcatHelper.newString, the JDK method that builds a new string for each concatenation, called from slowKey, so the program was spending its time copying strings, not counting them.
String concatenation in a loop creates a new string at every step and copies everything built so far, so building a key of 200 characters copies about 20,000 characters. A StringBuilder appends into one growing buffer. The example checks that the faster version builds exactly the same keys, which is the first rule of optimization: it must still be correct.
import java.util.*;

public class Main {
    static String slowKey(int n) {
        String s = "";
        for (int i = 0; i < 200; i++) s += (char) ('A' + (n + i) % 26);
        return s;
    }

    static String fastKey(int n) {
        StringBuilder sb = new StringBuilder(200);
        for (int i = 0; i < 200; i++) sb.append((char) ('A' + (n + i) % 26));
        return sb.toString();
    }

    public static void main(String[] args) {
        boolean same = true;
        for (int n = 0; n < 500; n++) same &= slowKey(n).equals(fastKey(n));
        System.out.println("same keys for 500 parts: " + same);
        long copiedSlow = 0;
        for (int len = 1; len <= 200; len++) copiedSlow += len;
        System.out.println("characters copied per key: slow " + copiedSlow + ", fast 200");
        Set<String> distinct = new HashSet<>();
        for (int n = 0; n < 500; n++) distinct.add(fastKey(n));
        System.out.println("distinct keys: " + distinct.size());
    }
}same keys for 500 parts: true characters copied per key: slow 20100, fast 200 distinct keys: 26
What this code does
Both methods produce the same 500 keys, so the change cannot alter the report. Concatenation copies every character built so far at each of the 200 steps, 20,100 characters per key, while the builder writes each character once into a buffer sized in advance. Only 26 keys are distinct because the key depends on n modulo 26, which is also why the counting map in the profiled program ended with 26 entries.
In the booking API the fix was one method. The report went from 3.8 seconds to 140 milliseconds, measured the same way, and the JVM flags Hamza had changed went back to their earlier values, because none of them had been the cause.
Profiles are not always this kind. Hamza wrote a small program that turns the hot-methods table into the share of samples spent in the shop's own code versus the JDK, which is often the first question when reading one.
import java.util.*;

public class Main {
    public static void main(String[] args) {
        String table = String.join("\n",
            "java.lang.StringConcatHelper.newString(byte[], long)                 36  67.92%",
            "Busy.slowKey(int)                                                    11  20.75%",
            "java.lang.StringLatin1.hashCode(byte[])                               4   7.55%",
            "java.util.HashMap.merge(Object, Object, BiFunction)                   2   3.77%");
        Map<String, Integer> byOwner = new TreeMap<>();
        int total = 0;
        for (String line : table.lines().toList()) {
            String[] f = line.trim().split("\\s+");
            int samples = Integer.parseInt(f[f.length - 2]);
            String owner = line.startsWith("java.") ? "JDK" : "application";
            byOwner.merge(owner, samples, Integer::sum);
            total += samples;
        }
        for (var e : byOwner.entrySet())
            System.out.printf("%-12s %3d samples, %4.1f of every 100%n", e.getKey(), e.getValue(), 100.0 * e.getValue() / total);
    }
}JDK 42 samples, 79.2 of every 100 application 11 samples, 20.8 of every 100
What this code does
Each line is split on runs of spaces, and the sample count is the second-to-last field, because method signatures contain spaces of their own. Methods are grouped by whether their class is in a java package. Most samples are in JDK code, but the JDK was only doing what slowKey asked, so the time belongs to the application's code that called it.
Looking inside a running JVM
JFR answers where time went. jcmd answers what a running JVM is doing now: it lists Java processes, and for a process ID it can print the flags in effect, a thread dump, heap information, a class histogram, or start and stop a JFR recording, all without restarting. jstat prints garbage collection statistics at intervals. Hamza ran the health service from lesson 2 and pointed both at it. The output is real.
$ jcmd
11586 health.jar
11628 jdk.jcmd/sun.tools.jcmd.JCmd
$ jcmd 11586 VM.flags
11586:
-XX:CICompilerCount=2 -XX:ConcGCThreads=1 -XX:G1ConcRefinementThreads=2 -XX:G1EagerReclaimRemSetThreshold=12 -XX:G1HeapRegionSize=1048576 -XX:G1RemSetArrayOfCardsEntries=12 -XX:G1RemSetHowlMaxNumBuckets=8 -XX:G1RemSetHowlNumBuckets=4 -XX:GCDrainStackTargetSize=64 -XX:InitialHeapSize=98566144 -XX:MarkStackSize=4194304 -XX:MaxHeapSize=134217728 -XX:MaxNewSize=79691776 -XX:MinHeapDeltaBytes=1048576 -XX:MinHeapSize=8388608 -XX:NonNMethodCodeHeapSize=5826188 -XX:NonProfiledCodeHeapSize=122916026 -XX:ProfiledCodeHeapSize=122916026 -XX:ReservedCodeCacheSize=251658240 -XX:+SegmentedCodeCache -XX:SoftMaxHeapSize=134217728 -XX:-THPStackMitigation -XX:+UseCompressedOops -XX:+UseFastUnorderedTimeStamps -XX:+UseG1GC
$ jcmd 11586 GC.heap_info
11586:
 garbage-first heap   total 98304K, used 2959K [0x00000000f8000000, 0x0000000100000000)
  region size 1024K, 2 young (2048K), 0 survivors (0K)
 Metaspace       used 1143K, committed 1280K, reserved 1114112K
  class space    used 118K, committed 192K, reserved 1048576K
$ jstat -gcutil 11586 1000 3
  S0     S1     E      O      M     CCS    YGC     YGCT     FGC    FGCT     CGC    CGCT       GCT
     -      -  16.67   0.00      -      -      0     0.000     0     0.000     0     0.000     0.000
     -      -  16.67   0.00      -      -      0     0.000     0     0.000     0     0.000     0.000
     -      -  16.67   0.00      -      -      0     0.000     0     0.000     0     0.000     0.000
What this code does
jcmd with no arguments lists the JVMs on the machine, including itself. VM.flags shows the flags the JVM is really running with, including the ones ergonomics chose, such as a maximum heap of 128 megabytes and G1. jstat -gcutil printed three samples a second apart; the idle service had used about a sixth of eden and run no collections, which is what an idle service should look like.
Inside a container these tools are run with docker exec, and the JDK must be present; a JRE image does not include jcmd. Leif's answer was to keep JFR recordings switchable through jcmd from a separate debugging container that shares the process namespace, and to enable a continuous recording in production that keeps the last hour in memory and is dumped only when needed.
-XX:StartFlightRecording=name=continuous,maxage=1h,settings=default,dumponexit=true,filename=/app/dumps/What this code does
maxage keeps a rolling hour of events in memory and on disk, and settings=default is the low-overhead profile intended for production. dumponexit writes the recording when the JVM stops, so a crash or a restart leaves evidence behind. The filename names a folder on the dumps volume, and the JVM chooses a file name with the process ID and time.
Start-up time
Start-up matters for deployment, not for customers: a version that starts in two seconds can be switched in and out quickly, and lesson 11's rollbacks depend on that. A Spring Boot service spends most of its start-up loading and linking thousands of classes. Class data sharing, CDS, stores classes already parsed and verified in an archive that later runs map into memory. Hamza tried it on a small program that loads the HTTP client and logging classes. The timings are real and vary from run to run.
$ java -XX:ArchiveClassesAtExit=app.jsa Startup
ready for 2028-04-27 with HTTP_2
$ ls -lh app.jsa
6.5M app.jsa
$ time java Startup
ready for 2028-04-27 with HTTP_2
real	0m0.740s
$ time java -XX:SharedArchiveFile=app.jsa Startup
ready for 2028-04-27 with HTTP_2
real	0m0.643s
What this code does
ArchiveClassesAtExit writes the classes loaded during a training run to app.jsa, here 6.5 megabytes. A normal run took 0.74 seconds and a run using the archive 0.64, a saving of about a tenth for a program that does almost nothing else. The saving grows with the number of classes, so a Spring Boot service gains more.
Java 24 extended CDS into an ahead-of-time cache, JEP 483, which also stores classes already linked, and Java 25 made it simpler to create (JEP 514) and added method profiles from the training run (JEP 515), so the JIT compiler starts with a head start. On Java 25 a training run and the production run look like this.
java -XX:AOTCacheOutput=app.aot -Dspring.context.exit=onRefresh -jar booking-api.jar
java -XX:AOTCache=app.aot -jar booking-api.jar
What this code does
The first command runs the application once with a training workload and writes the cache when it exits; spring.context.exit=onRefresh makes Spring Boot stop as soon as its context has started, which is a convenient training run. The second command uses the cache. The cache only works with the same JDK and the same class path, so it is built inside the image, from the same JAR.
Spring Boot 4's buildpack support can build the cache into the image with the environment variable BP_JVM_AOTCACHE_ENABLED=true on Java 25. The training run must not reach real services such as the production database, which is why the onRefresh exit is useful. Leif put the cache on the list for after go-live: a measured start-up time first, then the cache, then the start-up time again.
What not to tune
Leif's closing list was a set of things that usually do not need touching for a service like this one: the young generation's size, the G1 region size, the number of GC threads, the JIT compiler's thresholds. The JVM's ergonomics choose them well, and a flag copied from an old blog post may have been right for Java 8 and wrong ever since. The flags worth setting are few: the heap percentage, the collector in a small container, GC logging, heap dumps and exit on out-of-memory, JFR, and perhaps the AOT cache.
Exercises
Try it yourself
Nearest-rank percentile
Complete percentile using the nearest-rank rule: sort a copy of the values, compute ceil(p / 100 * n) and return the element at that rank (ranks start at 1). For p = 0 return the smallest value.
import java.util.*;

public class Main {
    static int percentile(List<Integer> values, double p) {
        return values.get(0);
    }

    public static void main(String[] args) {
        List<Integer> ms = List.of(120, 45, 60, 52, 900, 48, 75, 51, 64, 58);
        for (double p : new double[] {0, 50, 90, 95, 100})
            System.out.println("p" + (int) p + " = " + percentile(ms, p) + " ms");
    }
}
Try it yourself
How much can a fix save?
Amdahl's law: if a fraction f of the run time is made s times faster, the new time is (1 - f) + f / s of the old. Complete newTime so that it returns the new time in milliseconds for an old time, a fraction and a speed-up, rounded to the nearest millisecond.
public class Main {
    static long newTime(long oldMs, double fraction, double speedup) {
        return oldMs;
    }

    public static void main(String[] args) {
        System.out.println(newTime(3800, 0.95, 50) + " ms");
        System.out.println(newTime(3800, 0.20, 50) + " ms");
        System.out.println(newTime(3800, 0.95, 2) + " ms");
    }
}
The second exercise was Leif's point in numbers: making a fifth of the program fifty times faster saves less than making nearly all of it twice as fast. Profile first, and the profile tells you which fraction is worth the work.
Common mistakes
MistakeChanging JVM flags before measuring.
InsteadSet a target, measure, profile, change one thing and measure again.
MistakeReporting the average latency.
InsteadReport and alert on percentiles such as p95 and p99.
MistakeSizing thread pools by feel.
InsteadUse Little's law: requests in progress equal arrival rate times time inside, plus a margin.
MistakeBuilding strings with + inside a loop on a hot path.
InsteadUse a StringBuilder, and check the result is unchanged.
MistakeCopying tuning flags from old articles.
InsteadTrust ergonomics for the fine details and set only the few flags you can justify.
Summary and key terms
- Performance tuning starts with a numeric target, a measurement under realistic load and a profile, then changes one thing and measures again.
- Latency is described with percentiles, because the mean hides the tail.
- Little's law relates requests in progress, arrival rate and time inside, which sizes thread pools and shows why slow dependencies are dangerous.
- Java Flight Recorder records samples and events with low overhead and can run continuously in production; jfr view prints reports such as hot methods. jcmd inspects a running JVM's flags, threads, heap and recordings, and jstat samples GC statistics.
- Class data sharing and the ahead-of-time cache of Java 24 and 25 shorten start-up, and Spring Boot 4 can build the cache into an image.
- Most fine-grained JVM flags are best left to ergonomics.
- Profiler
- A tool that shows where a program spends its time or memory.
- Percentile
- The value below which a given share of measurements fall, such as p95.
- Little's law
- Requests in progress equal arrival rate times average time in the system.
- Java Flight Recorder
- The JVM built-in event recorder for profiling, cheap enough for production.
- Hot method
- A method found running in many profiler samples.
- jcmd
- The JDK tool that sends diagnostic commands to a running JVM.
- jstat
- The JDK tool that prints GC and class-loading statistics at intervals.
- Class data sharing
- Storing parsed classes in an archive that later runs map into memory.
- AOT cache
- The Java 24 and 25 cache of loaded, linked classes and profiles from a training run.
- Training run
- A run of the application used to record what to put in a CDS archive or AOT cache.
Practice problems
Work each problem on paper first, then reveal the answer to check.
Why is the mean a poor latency target?
Show answer
It hides the slow tail and may match no real request.
At 20 requests a second and 0.1 s each, how many are in progress?
Show answer
About 2.
What did the hot-methods view show for Hamza's program?
Show answer
Most samples in string concatenation called from slowKey.
Which tool shows the flags a running JVM is really using?
Show answer
jcmd PID VM.flags.
Why must an AOT cache be built inside the image?
Show answer
It works only with the same JDK and the same class path.
Lesson quiz · 5 questions
Score 60% or more to complete this lesson.
Create a free account to save your progress, take quizzes and earn a certificate.